Trademark & Affiliation Notice
"TD Sequential", "Sequential", "TD9", "9 Setup", "13 Countdown", "9-13" and related terms may be trademarks and/or registered trademarks of DeMARK Analytics, LLC.
Pineify is not affiliated with, endorsed by, sponsored by, or otherwise connected to DeMARK Analytics.
This page is for educational and informational purposes only. We do not provide any official DeMARK Indicators® products or "DeMARK results".
Price just blew through your stop. I've been there — staring at a chart wondering where that reversal came from. That's exactly why I started using the TD Supply & Demand Points indicator.
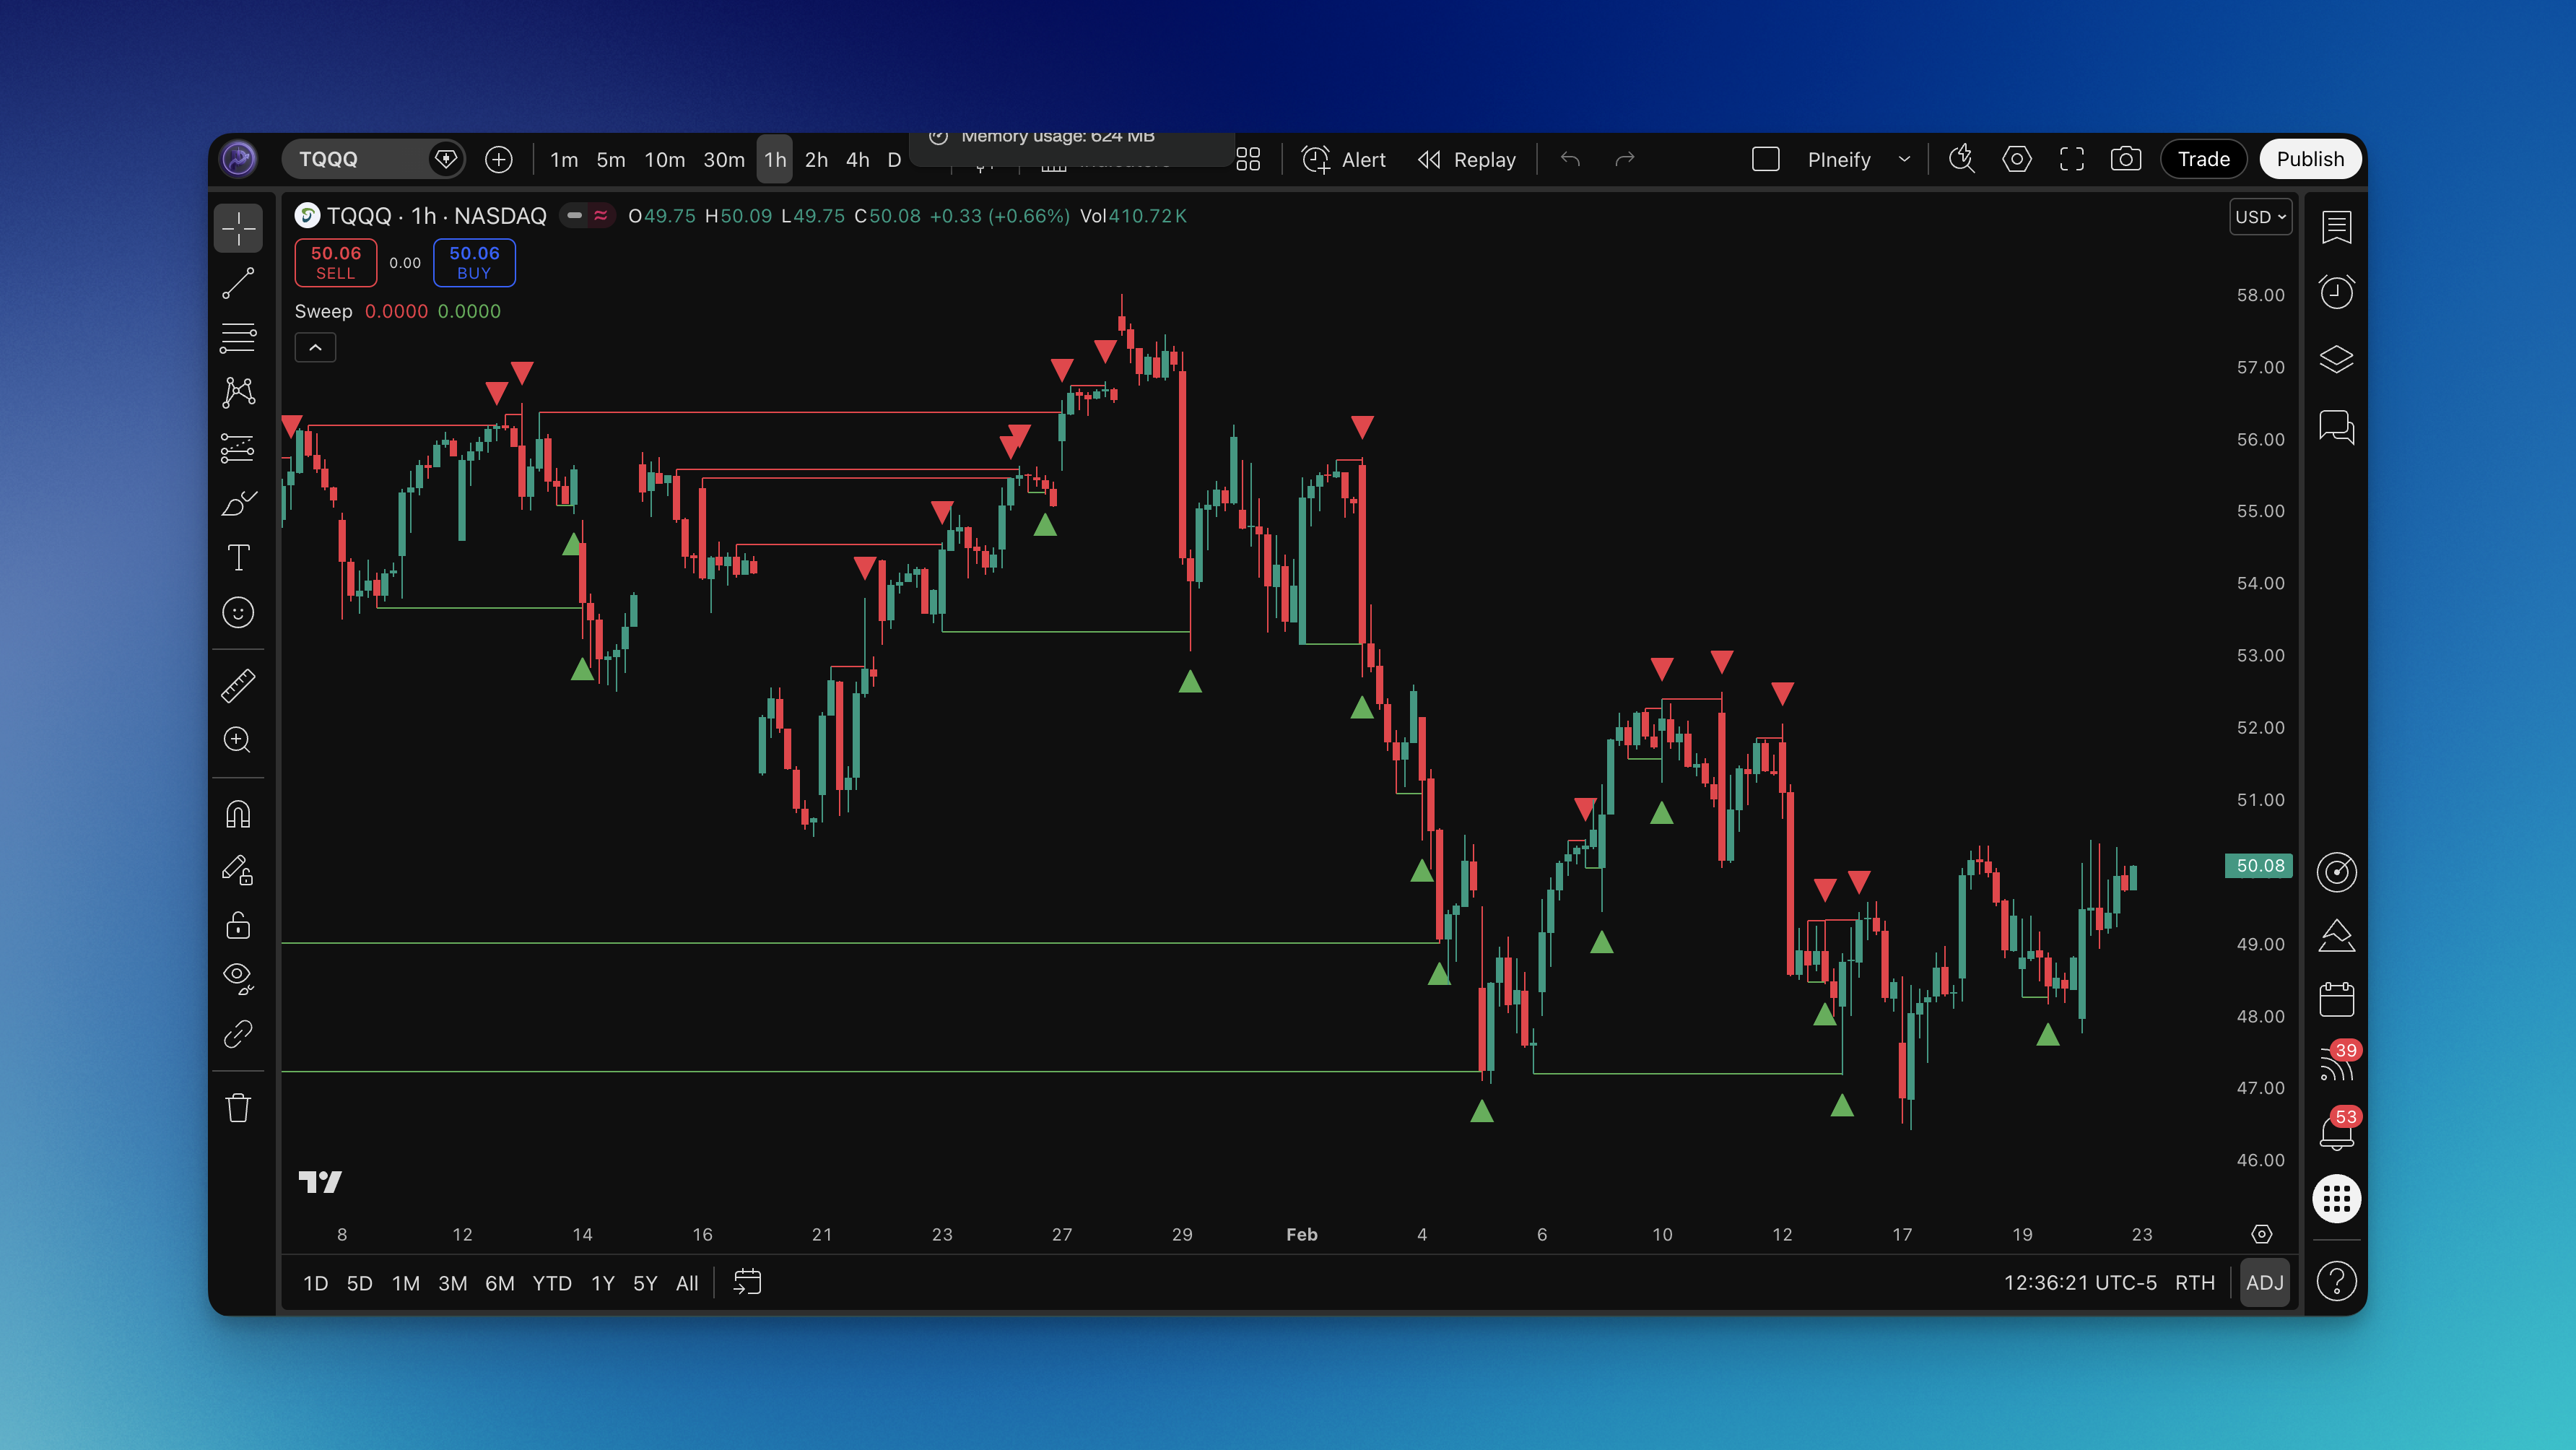
TD Supply & Demand Points are candlestick-based reversal zones that use Tom DeMark's pattern recognition methodology to mark where institutional money is likely to step in. When a candle's high exceeds both neighboring candles, it signals a supply point — sellers overwhelmed buyers at that level. When a candle's low drops below both adjacent candles, it's a demand point, showing where buyers absorbed the selling pressure. This isn't guesswork. Tom DeMark spent decades codifying these patterns.
I tested this on EUR/USD back in November 2024 and caught a clean 120-pip reversal at a Level 2 demand point on the 4-hour chart. I've also run it on BTC/USD since March 2025, and the Level 1 patterns gave decent scalping signals on the 15-minute timeframe. My honest take: this indicator spots "invisible walls" before they hit you.