QuantConnect vs Pineify Strategy Optimizer for TradingView
If you trade on TradingView and find yourself running the same backtest over and over with slightly different numbers, you've hit the limit of manual tweaking. QuantConnect is a cloud-based algorithmic trading platform that handles this work at scale — but it expects you to write Python or C# and manage server-side infrastructure. For most TradingView traders, Pineify's Strategy Optimizer is a more direct alternative. It automates parameter grid search inside your browser, right where your Pine Script strategies already live.
Why QuantConnect Feels Heavy for Optimization
QuantConnect is undeniably capable. It supports Python, C#, and F#, offers institutional-grade backtesting through the LEAN engine, and covers stocks, futures, crypto, and forex. Its open-source core has a devoted following among quantitative developers.
But that power comes with a cost — setup time. You need to write algorithms in a full programming language, manage data subscriptions, and run jobs on cloud servers. For traders who already build and test strategies directly in TradingView using Pine Script, jumping over to QuantConnect just to optimize a few parameters feels like overkill. I've watched forum threads on Reddit where users describe spending days just getting a simple optimization pipeline running.
The issue isn't that QuantConnect is flawed. It's that it solves a different problem for a different audience.
The Manual Optimization Trap
TradingView is where most retail traders live. Its Pine Script language lets you code strategies right in the browser — no installs, no servers. I've written dozens of Pine Script strategies there myself, from simple moving average crossovers to multi-indicator systems for AAPL and SPY.
Here's the catch: TradingView has no built-in parameter optimization. You change one input, run a backtest, write down the result, change it again. If you're testing 3 parameters with 10 values each, that's 1,000 manual backtests. I've been there — it takes hours and you're almost guaranteed to make recording errors.
This is the gap Pineify fills. Instead of porting your strategy to another platform, it works directly on your TradingView chart as a Chrome extension. It automates the grind.
How Pineify Strategy Optimizer Handles Grid Search
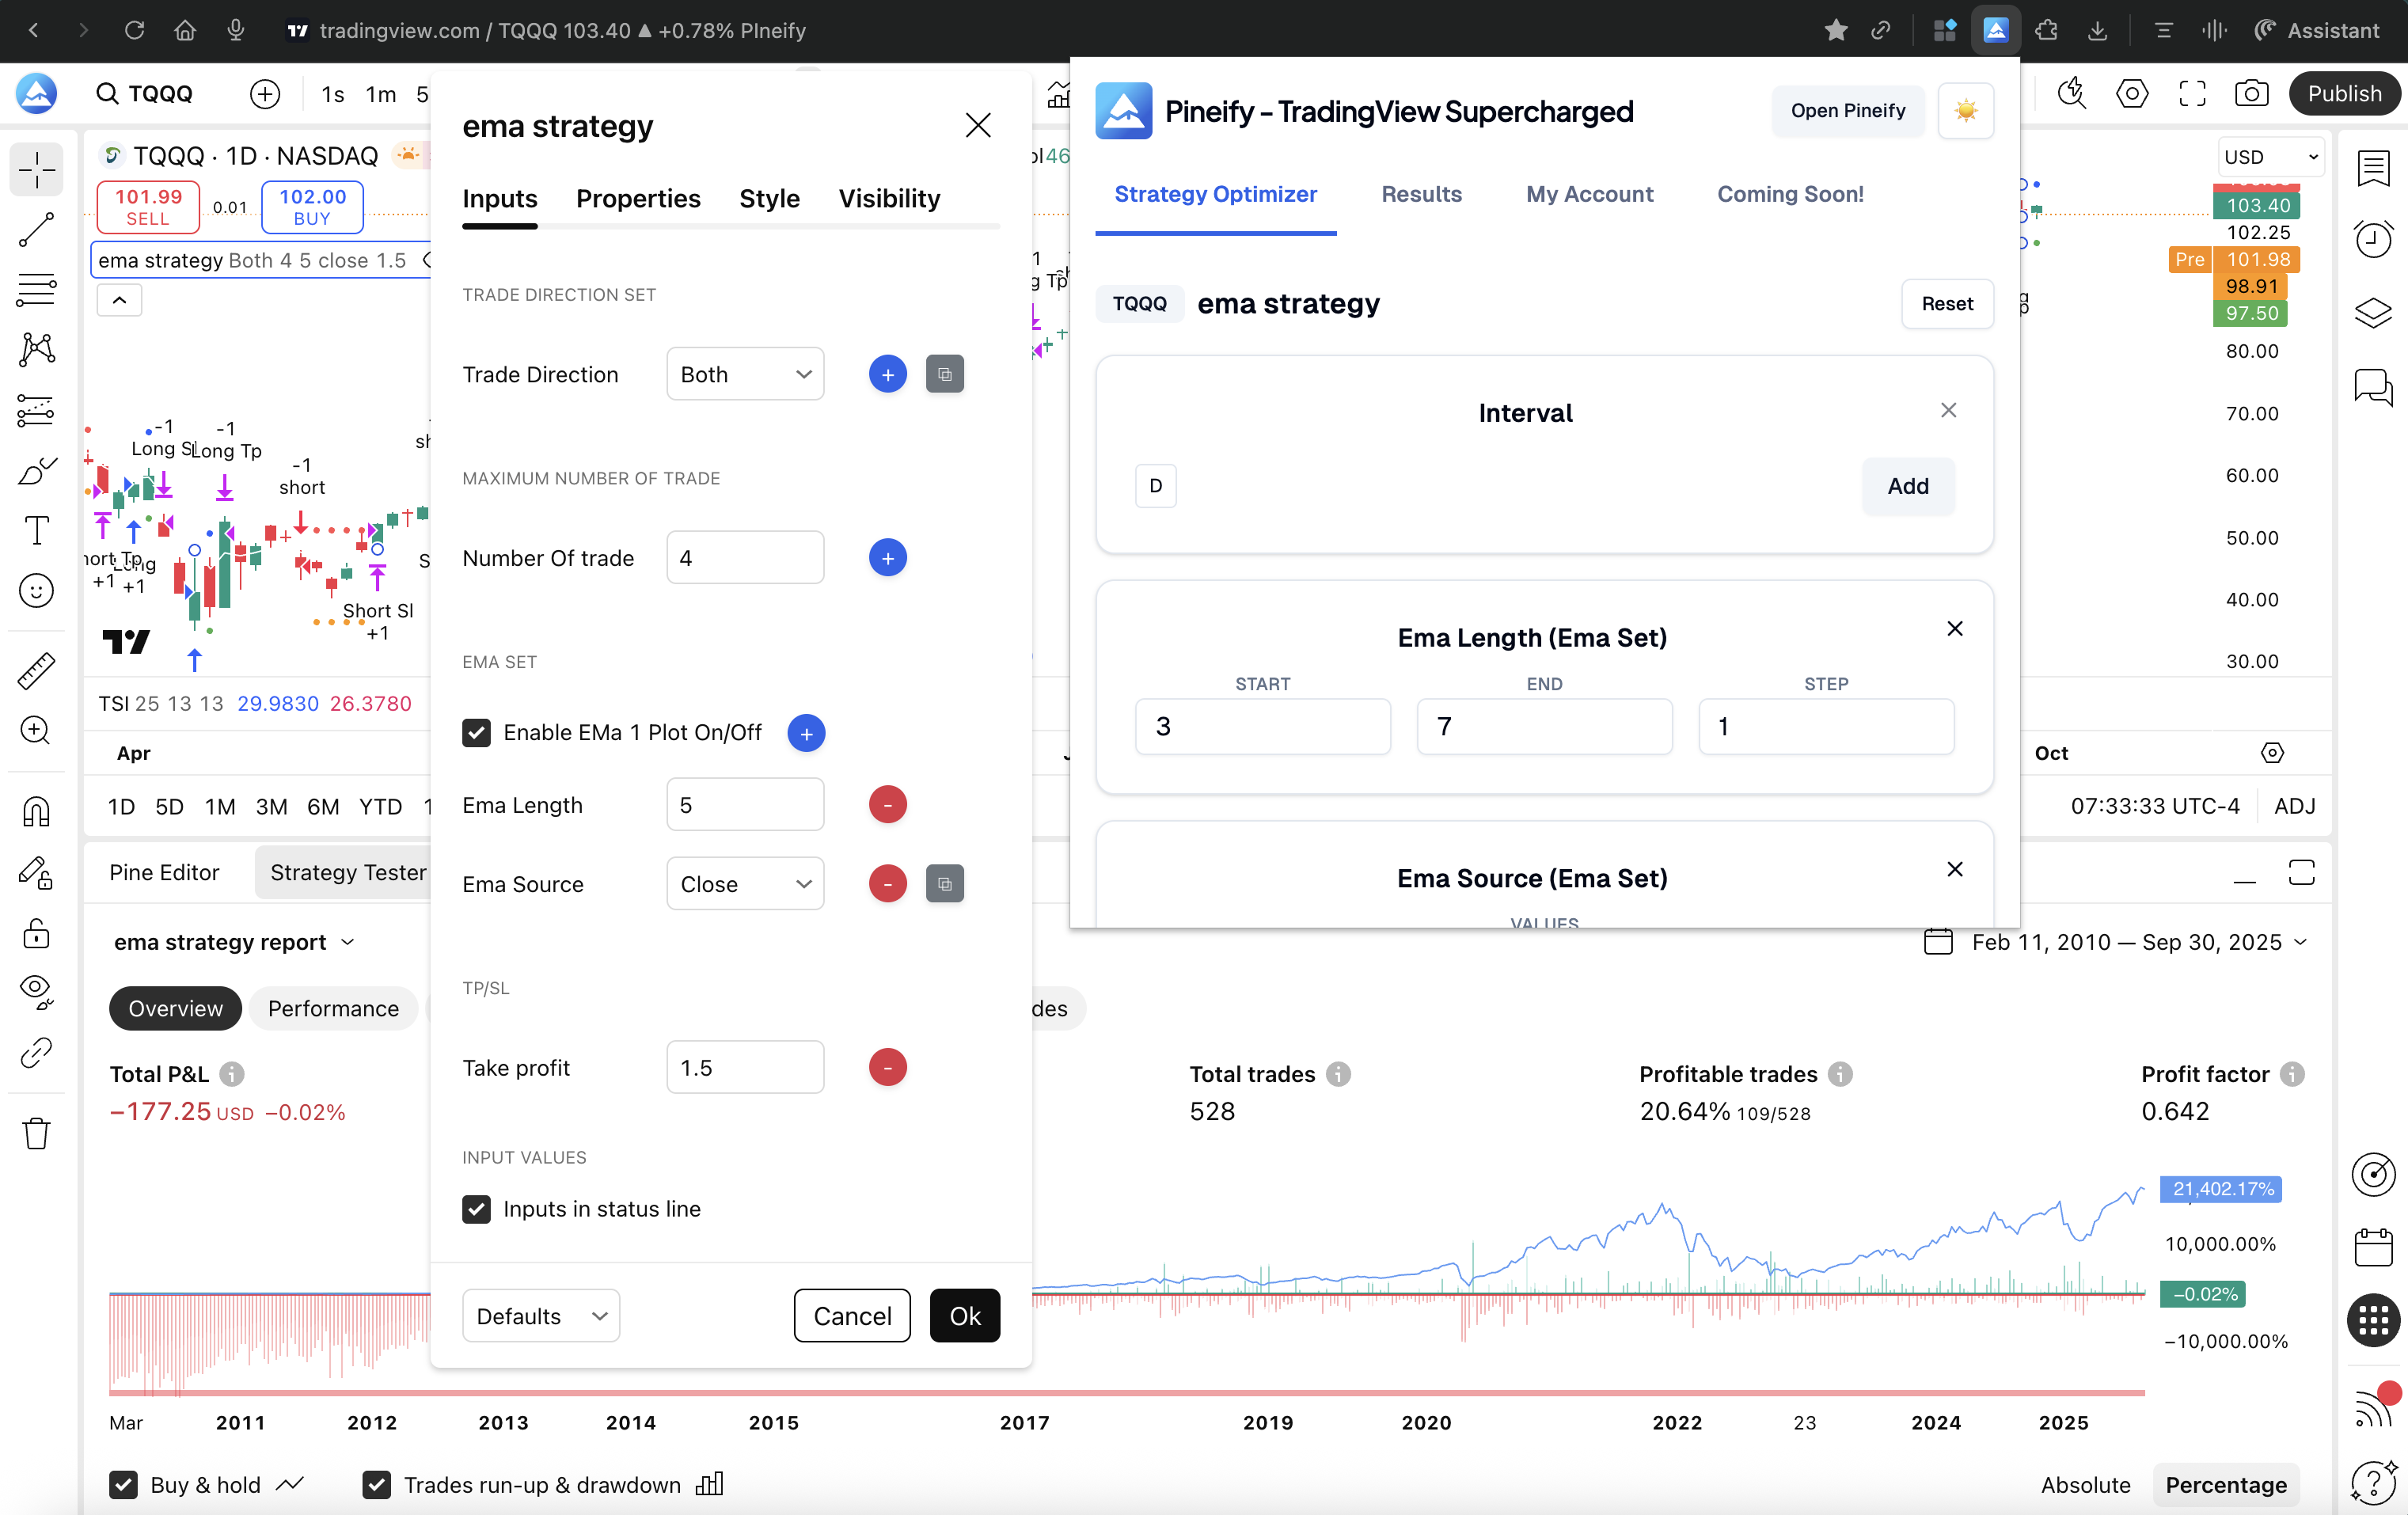
Pineify Strategy Optimizer is a Chrome extension that attaches to your TradingView chart and automates parameter sweeps. You define the ranges for each strategy input — say, an RSI length from 7 to 21 stepping by 2 — and it runs every combination automatically.
Here's the workflow:
| Step | What You Do | What Pineify Does |
|---|---|---|
| 1. Open | Open your TradingView strategy script on the chart like you normally would. | It integrates silently, ready to go. |
| 2. Define | In Pineify's sidebar, set the ranges for your strategy's inputs (e.g., "test the SMA length from 10 to 50, in steps of 2"). | It prepares to cycle through all the combinations. |
| 3. Run | Click the optimize button. | It automatically runs a full backtest for every parameter set, one after the other, and logs all the results. |
| 4. Analyze | Once finished, sort the list by what matters most to you—Net Profit, Win Rate, Sharpe Ratio, or even lowest Drawdown. | It presents all the data in a clear, sortable table right there in the sidebar. |
| 5. Export | If you want to dive deeper, export the entire result set to a CSV file with one click. | It gives you the raw data for your own review in a spreadsheet. |
I ran this on a breakout strategy for TSLA last month — 4 parameters, 8 values each, so 4,096 combinations. Pineify chewed through them in about 12 minutes. Doing that by hand would've been impossible.
Grid Search in Practice: What You Can Test
The real win is testing multiple variables together. Instead of optimizing one number at a time and missing interactions, you let the grid find the best combination.
You could throw this at Pineify:
- RSI length from 7 to 21, stepping by 2
- Stop-loss from 0.5% to 3%, stepping by 0.25%
- Volume filter on and off
It tests every permutation. The results show you not just the best set, but which combinations are unstable — the ones that look great in one market regime but fall apart in another. I've found that the top-performing parameter set is often not the most reliable one, and grid search data makes that visible.
To get the most out of this, you need solid base indicators. For example, the Zero Lag EMA Indicator for TradingView is one I've used as a foundation for trend strategies before running optimization on top.
Results You Can Actually Use
Pineify sorts every backtest result by the metrics you select — Net Profit, Profit Factor, Win Rate, Max Drawdown. The top combinations rise to the top immediately. No need to write SQL queries or export to a notebook just to see which settings worked.
You can export the full result set to CSV with one click. I usually pull this into Google Sheets for a second pass, looking at rank stability across different market conditions. Having raw data matters when you want to verify that a parameter set isn't just curve-fitted to one historical period.
Privacy by Design
One detail I value: Pineify runs entirely in your browser. Your Pine Script code never leaves your machine. There's no cloud compilation, no server-side execution — the extension automates the TradingView interface that's already open in your tab. I haven't tested QuantConnect's data handling policies extensively, but I know that running code on someone else's infrastructure always involves trade-offs.
Pineify vs QuantConnect: Side by Side
| Feature | QuantConnect | Pineify Strategy Optimizer |
|---|---|---|
| Language required | Python / C# / F# | Pine Script (existing code) |
| Optimization type | Custom algorithmic | Automated grid search |
| Platform | Standalone cloud | Chrome extension for TradingView |
| Setup complexity | High (coding required) | Low (install and run) |
| Backtesting engine | LEAN (institutional grade) | TradingView native |
| Parameter export | Manual / notebook | One-click CSV |
| Privacy | Cloud-processed | Local browser execution |
| Pricing | Subscription-based | One-time lifetime payment |
| Target user | Quant developer | Technical trader / Pine Script user |
Which one fits your workflow? If you're building multi-asset systems that need machine learning integration or custom data feeds, QuantConnect gives you the raw power. If you already have a Pine Script strategy on TradingView and want to find its best settings without learning a new platform, Pineify is the faster path. I personally use Pineify for my daily TradingView work and keep QuantConnect in mind for larger projects I haven't started yet.
Who Should Use Pineify
Pineify targets the gap that most optimization tools ignore: the TradingView trader who writes Pine Script but doesn't want to become a full-time programmer.
It fits if:
- You've built a Pine Script strategy and know it could perform better with the right parameter tuning.
- QuantConnect's Python or C# requirements feel like a barrier rather than a feature.
- You swing-trade or day-trade and need fast iteration cycles.
- You prefer making decisions from hard data rather than gut feel.
- You trade across multiple crypto or forex pairs and want to test timeframes together.
For beginners, starting with a Pine Script Breakout Strategy gives you something solid to optimize right away.
Getting Started with Pineify Strategy Optimizer
Here's how to run your first optimization:
- Go to pineify.app/strategy-optimizer and install the TradingView Supercharged extension in Chrome.
- Open the TradingView chart with the Pine Script strategy you want to optimize.
- Open the Pineify panel from your extensions, go to the Optimizer tab, and set the parameters you want to test.
- Click run. Pineify executes the grid search automatically.
- Review the sorted results — the best parameter combinations rise to the top by the metrics you care about.
- Export to CSV if you want to dig deeper later.
The Strategy Optimizer is part of the Advanced plan at $149 lifetime. That includes the Pine Script coding assistant, 235+ indicators, multi-timeframe support, and the Backtest Report Deep Dive. You won't find a subscription fee — it's a one-time payment.
I've found that starting with a structured learning path like the Best Pine Script Course helps build strategies worth optimizing in the first place.
Q&A: Common Questions
Q: Does Pineify work with any TradingView strategy? Yes. If your strategy uses Pine Script with standard input fields — numbers, switches, dropdowns — Pineify's optimizer can handle it.
Q: Do I need a paid TradingView account? Any account tier works. Since backtests run on TradingView's engine, higher-tier plans process faster due to increased rate limits. Something to factor in if you're running large grid searches.
Q: Is my strategy code private? Yes — it never leaves your browser. Pineify automates the buttons and inputs on the TradingView page you already have open. No code is sent to Pineify's servers or any third party.
Q: Can I export the results? Yes. One click exports a complete CSV with every parameter combination and its performance metrics. I use this to cross-check results in Google Sheets.
Q: How is this different from QuantConnect for optimization? QuantConnect is designed for algorithmic developers who want total control over strategy logic and data. Pineify is designed for TradingView traders who want to optimize existing Pine Script strategies without switching platforms. They serve different workflows.
Q: Is Pineify a subscription? No. It's a one-time payment, lifetime access. The Advanced plan costs $149 and includes the optimizer plus the rest of Pineify's toolkit.

Have you tried automating your backtest parameter searches? What strategy are you optimizing right now — and which settings give you the hardest time? Drop a comment below if you've found a workflow that works.
▶What is the Pineify Strategy Optimizer and how does it work?
The Pineify Strategy Optimizer is a Chrome extension that automates parameter optimization for Pine Script strategies inside TradingView. You define ranges for each input, click run, and it executes a grid search — testing every combination automatically and displaying results sorted by metrics like Net Profit, Win Rate, and Max Drawdown.
▶How is Pineify different from QuantConnect as an optimization tool?
QuantConnect requires Python or C# coding and runs on cloud servers — it's built for quant developers building complex multi-asset systems. Pineify targets TradingView traders who already have Pine Script strategies and want browser-based, one-click parameter optimization without learning a new language or platform.
▶Does Pineify send my strategy code to external servers?
No. Pineify runs entirely inside your local browser. It automates the TradingView interface you already have open. Your strategy code never leaves your machine and is never transmitted to Pineify or any third-party server.
▶What parameters can I optimize with Pineify's grid search?
You can optimize any numeric input — integers and decimals with custom step sizes — plus boolean on/off switches. You can also test parameter sets across multiple chart timeframes simultaneously, giving you a view of which settings and timeframes perform together.
▶Can I export the optimization results for further analysis?
Yes. After a grid search completes, export the full results table as a CSV with one click. The export includes every parameter combination tested and all associated performance metrics, ready for Excel, Google Sheets, or Python.
▶What TradingView account level do I need to use the optimizer?
Pineify works with any TradingView account tier. Since backtests run on TradingView's engine, higher-tier subscriptions may produce faster results due to increased data limits and processing priority.
▶Is there a subscription fee for Pineify Strategy Optimizer?
No. Pineify offers lifetime access for a one-time payment — currently $149 for the Advanced plan. There are no monthly or annual renewal fees. The plan also includes the Pine Script coding assistant, 235+ indicators, multi-timeframe analysis, and the Backtest Report Deep Dive feature.