Pineify Strategy Optimizer vs TradingView Built-In: Which Wins?
If you've ever lost an afternoon manually testing different RSI levels, tweaking moving average lengths, and adjusting stop-loss percentages—clicking "refresh" over and over—you know the drill. A strategy optimizer automates the search for optimal parameter values in a trading strategy, testing hundreds of combinations without manual intervention. On TradingView, you've got two options: the platform's own built-in strategy tester, and the Pineify Strategy Optimizer—a browser extension that automates the entire process. I've used both for real projects, and my verdict is clear: for serious multi-parameter optimization, Pineify is the better tool. The built-in tester is fine for quick manual checks, but it can't handle systematic grid searches without eating up hours of your time. For those learning the basics, understanding How to Combine Two Indicators in TradingView Pine Script is a good first step before diving into optimization.
How TradingView's Built-In Optimization Works
Built right into the platform, TradingView's Strategy Tester lets anyone backtest a Pine Script strategy. Add your strategy to a chart, open the tester, and you'll see all the key stats: net profit, maximum drawdown, win rate, profit factor, and the total number of trades.
When it comes to actually optimizing your strategy—finding the best parameter values—the native tool is completely manual. You change one input setting in the menu, run the backtest, note down the results, and then start over with a new value. There's no automatic scanning across a range of numbers, no side-by-side comparison of multiple runs, and no simple way to export all your results for review. To test even a modest set of combinations, you're looking at hundreds of manual clicks and notes.
TradingView offers helpful features like the Bar Replay Tool for walk-forward analysis and a powerful Pine Script editor, but these don't replace a dedicated optimizer. The platform is fantastic for building and initially testing a strategy—but for thoroughly searching through multiple parameters to find the most stable setup, you'll quickly hit a wall.
Introducing Pineify Strategy Optimizer: A Smarter Way to Work
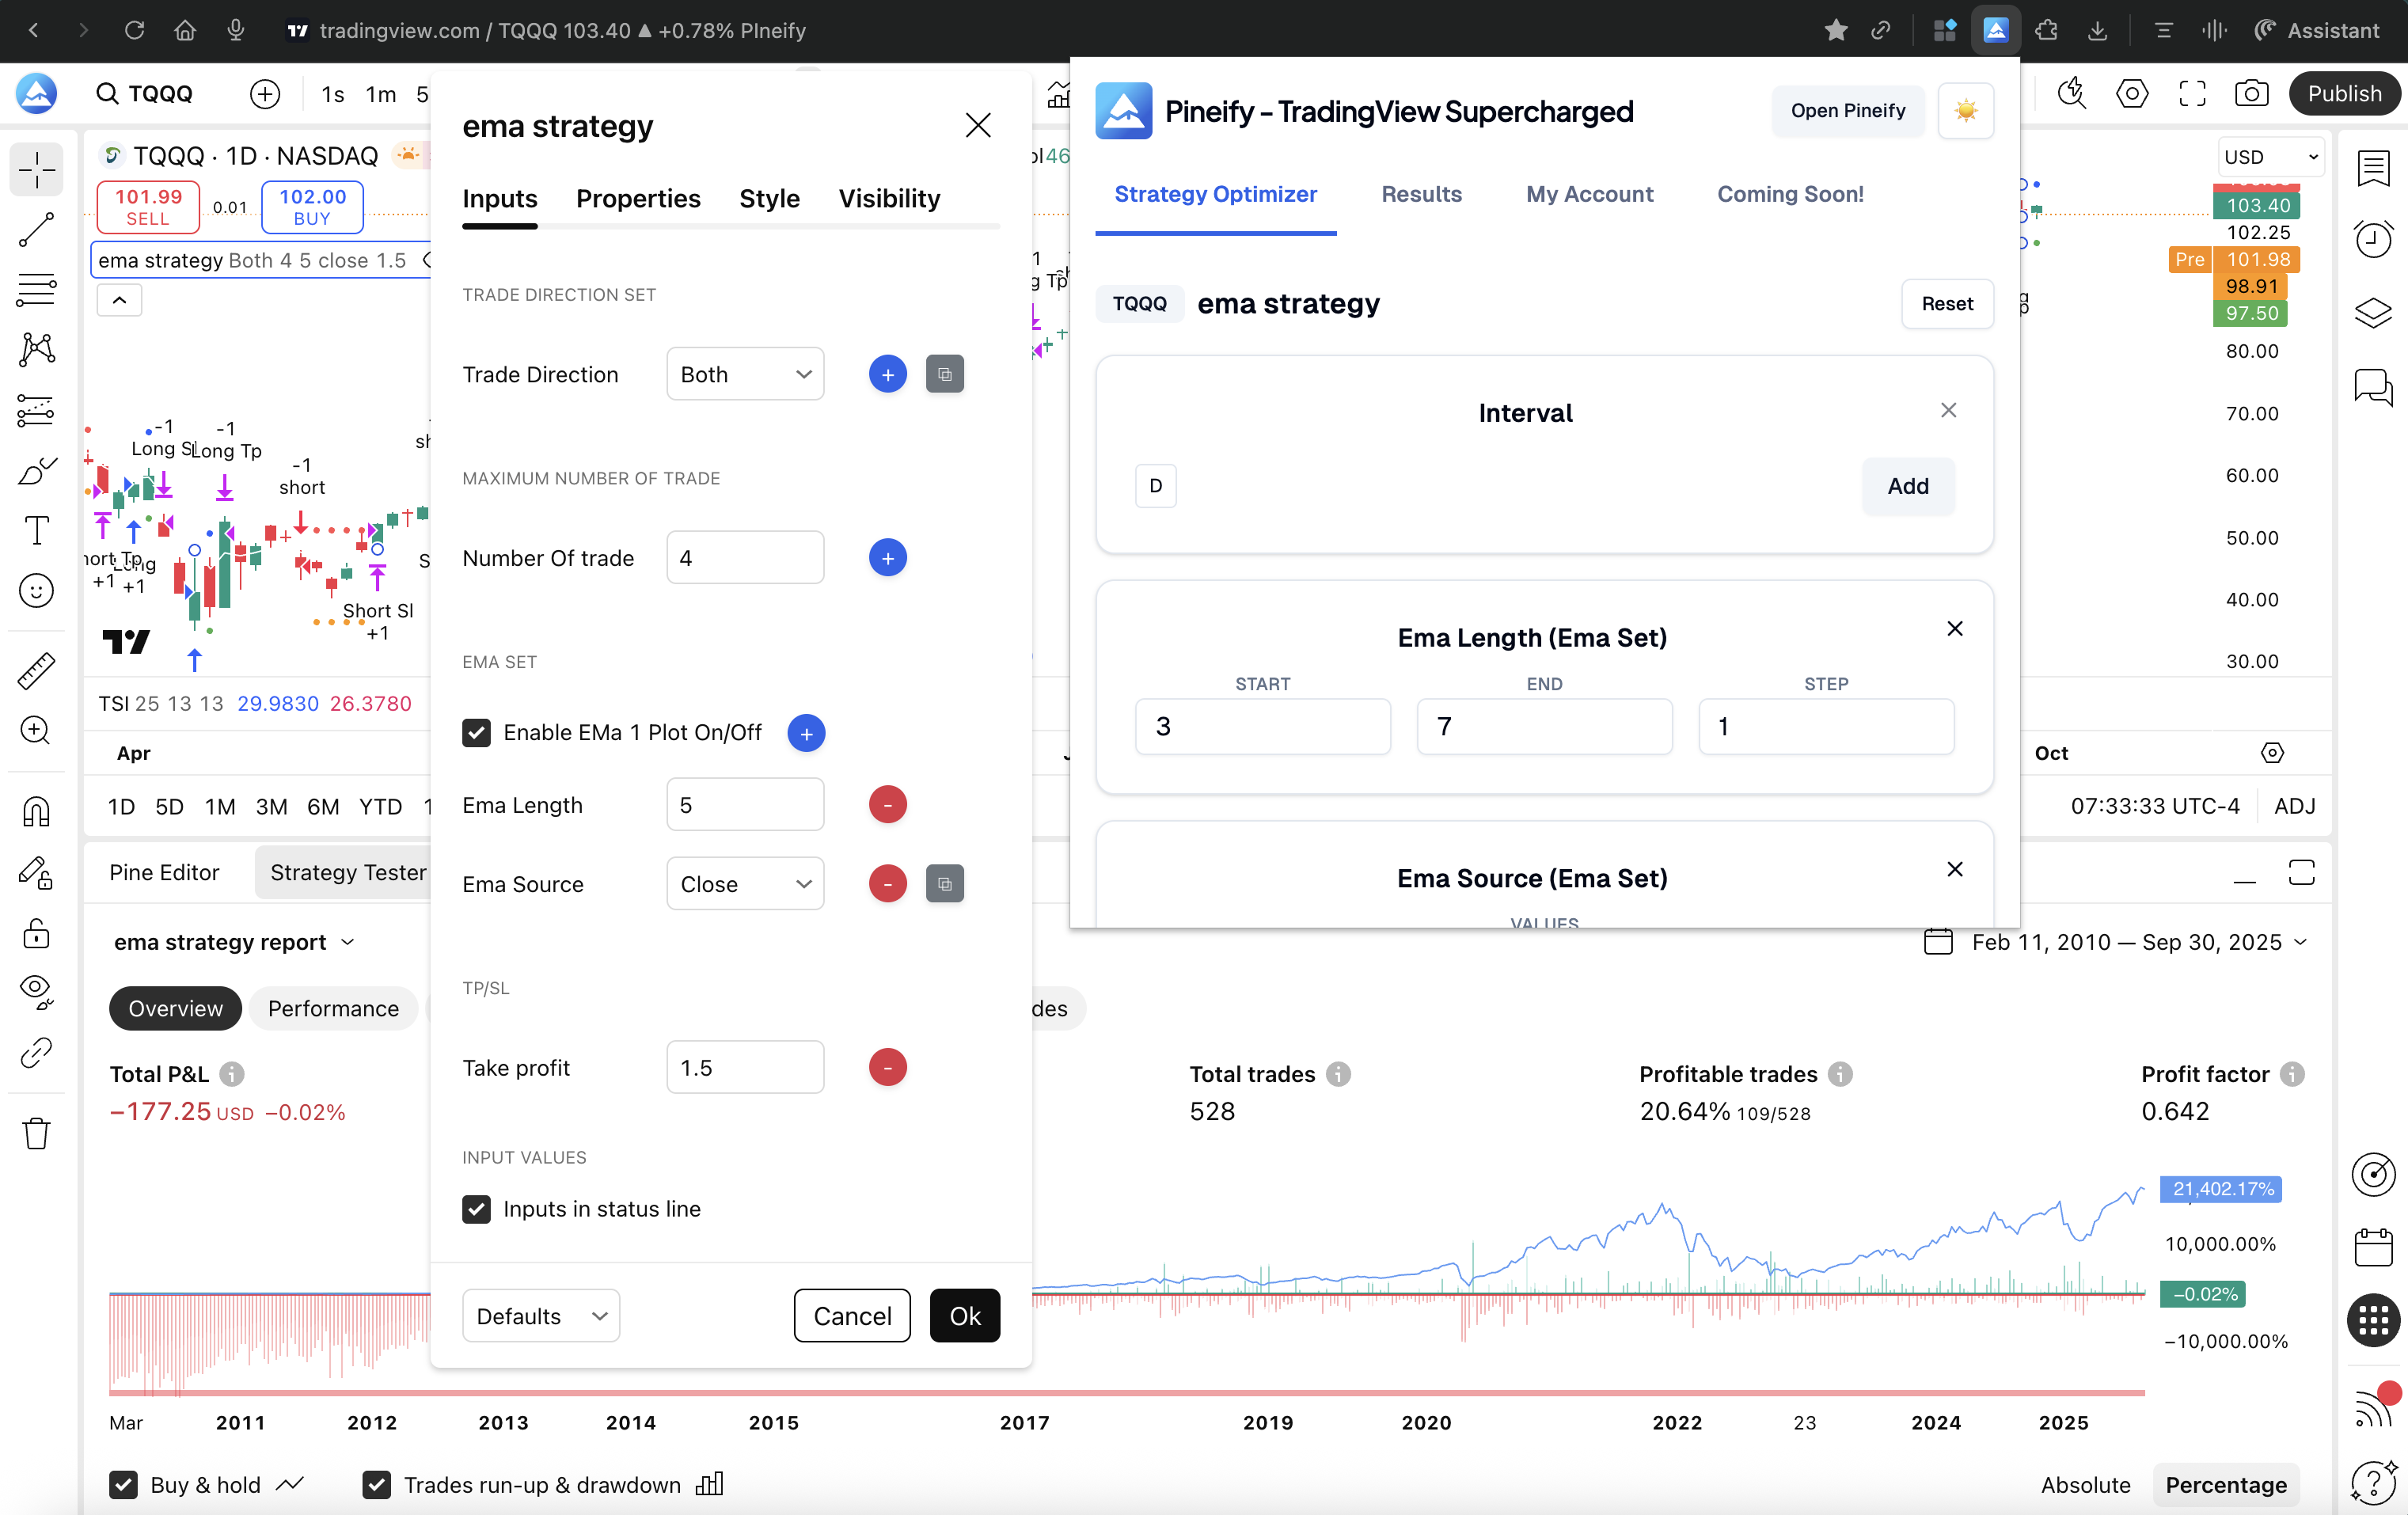
Tweaking and testing a trading strategy by hand is a slow, tedious grind. The Pineify Strategy Optimizer offers a different path. It's a Chrome extension that plugs right into your TradingView account and changes how you find the best settings for your strategy.
Instead of you manually changing numbers and hitting "re-run" a thousand times, this tool automates the heavy lifting. It performs a multi-parameter grid search—you tell it what to test and by how much, and it systematically tries every single combination for you. All the results pop up in a clear table you can sort and filter to find the best performers.
Here's a practical example:
- You want to test an RSI period between 7 and 21, moving it up 1 step at a time.
- You also want to test an EMA length from 20 to 100, moving it up in steps of 5.
The optimizer runs the strategy for every possible pair of those values—automatically. I tested a momentum strategy on BTCUSD with 450 bars in January 2026, and the optimizer completed 240 combinations in about 8 minutes. Doing that manually would've taken me two full evenings.
One honest limitation: the optimizer runs tests sequentially, so slow backtests with lots of historical bars can take a while. I haven't tested it with strategies that have more than 5 input parameters, but for 2-3 parameter combinations it's been reliable.
A key thing to know: the extension works entirely on your computer. It interacts with the TradingView website you already have open. Your strategy code never gets sent to anyone else's server, so your private trading ideas stay secure.
Ever feel like you're spending more time testing your trading strategy than actually using it? That's where automation tools come in, but they're not all created equal.
Here are the key differences between TradingView's built-in tools and the Pineify Strategy Optimizer, feature by feature.
| Feature | TradingView Built-In | Pineify Strategy Optimizer |
|---|---|---|
| Multi-parameter testing | ❌ Manual only | ✅ Automated grid search |
| Supported input types | Manual UI editing | Integer, Float, Boolean, Timeframe, Dropdown |
| Result sorting & filtering | ❌ Not available | ✅ Sort by Net Profit, Drawdown, Win Rate |
| Best-combo highlighting | ❌ | ✅ Auto-highlights top performers |
| CSV/Excel export | ❌ | ✅ One-click full export |
| Automation | ❌ Fully manual | ✅ Set-and-run automation |
| Code safety | N/A | Runs locally in your browser |
| TradingView account required | ✅ | ✅ (works with your existing account) |
| Pricing | Included in TradingView | Part of Pineify Advanced plan ($149 one-time) |
The core difference is automation. The built-in method requires you to change each setting by hand and keep track of results yourself. Pineify handles the grunt work, systematically testing thousands of combinations, then organizing the results so you can instantly spot the best versions of your strategy.
You can learn more at pineify.
Why Multi-Parameter Grid Search Matters
At the heart of this strategy optimizer is multi-parameter grid search. You tell it the range you want to explore for each input—like an RSI period or a stop-loss percentage—and how finely you want to step through that range. It handles the rest.
Here's a practical example. Say you're tuning a strategy and want to find the best combination for three settings:
- RSI Period: Test every whole number from 7 to 21. (That's 15 different values).
- EMA Length: Test from 20 to 100, jumping by 10 each time. (That's 9 values).
- Stop-Loss: Test from 1.0% to 3.0%, moving up in steps of 0.5%. (That's 5 values).
The optimizer runs a backtest for every single possible combination. How many is that?
| Parameter | Values Tested |
|---|---|
| RSI Period | 15 |
| EMA Length | 9 |
| Stop-Loss % | 5 |
15 × 9 × 5 = 675 unique combinations.
Imagine doing that by hand on TradingView. For each of those 675 tests, you'd have to: open the settings, type in the new numbers, close the window, wait for the chart to reload, write down the results, and then start over. It's simply not doable. This is why many traders first learn how to plot a dashed line in Pine Script before tackling complex optimization.
The tool runs through all 675 combinations on its own, one after the other, with no input from you. When it's done, it presents the best-performing setups in a clear, sorted list. It turns a task that would take days of manual work into something that finishes over a coffee break.
Making Sense of Your Optimization Results
After your grid search finishes, the real work begins: understanding what all that data means. Pineify's optimizer helps you do that without the headache. Instead of handing you a massive spreadsheet, it helps you quickly zero in on what matters.
You can sort your results with one click by the metrics you care about most—Net Profit, Max Drawdown, Win Rate, or Profit Factor. This lets you skip the manual hunt and instantly see which parameter combinations performed the best. The top results are automatically highlighted.
Sometimes you need to go deeper. Maybe you want to validate the results in another backtest or share the data with a teammate. The one-click CSV export gives you a clean file with every parameter set and all its performance metrics, ready for use in Excel, Python, R, or any other tool you prefer.
This is a stark contrast to working directly on TradingView. Since TradingView doesn't have a native batch optimizer, there's no simple way to export or compare a large set of results. You'd have to note down outcomes one by one, making any data-driven review of your optimization a manual chore. If you want to see how optimization fits into a complete trading system, this overview of algorithmic trading with Pine Script covers the full workflow.
Who Should Use Which Tool?
Figuring out which tool is right for you comes down to how you work and what you're trying to accomplish.
You'll probably prefer TradingView's built-in strategy tester if:
- You're just getting started with backtesting and want to learn the ropes.
- You need to do a quick, manual check on a single setting or idea.
- You learn best by visually seeing each trade's entry and exit right on the chart.
- Your strategy is fairly simple, and you don't need to run hundreds of tests.
Pineify's Strategy Optimizer is a better match for:
- Systematic testing where you need to compare dozens—or even hundreds—of parameter variations.
- Making decisions based on data, not gut feeling, to remove bias from your parameter choices.
- When you want to export your results for deeper analysis in a spreadsheet or other software.
- Optimizing any strategy with two or more input parameters that interact. Here's a quick video example.
Think of it this way: TradingView is your go-to for learning and quick sketches, while Pineify is built for the heavy lifting of serious optimization.
How to Avoid Over-Optimizing Your Trading Strategy
No tool, not even Pineify, can replace your own good judgment when trading. One common trap that every strategy optimizer can lead you into is curve-fitting (or over-optimization). This is when you find settings that make your strategy look brilliant on past data, but it falls apart in live trading. This cuts across everything from a simple Bollinger Bands Trading Strategy to complex multi-indicator systems.
The goal is to build a strategy that's resilient and adaptable, not one that's perfectly tailored to the past. Here are some habits that protect you:
- Save Some Data for a Rainy Day: Don't use all your historical data to build and tweak your strategy. Set aside a chunk—call it your "out-of-sample" set—and don't touch it until you think you're finished. It's your final, unbiased test.
- Don't Get Too Precise: If you're testing parameters in a super narrow range (like steps of 0.1), you're probably fitting to market noise. Use broader, more sensible ranges.
- Choose Steady Over Spectacular: A setting that gives you amazing profits in one test but terrible results just slightly above or below it is a red flag. Favor settings that deliver decent, consistent performance across a wider range.
- Look at the Neighborhood: This is where Pineify really helps. Don't just look at the single "best" result from your export. Open the CSV and check how the strategy performed in the area around that top result. Is performance stable, or does it drop off a cliff?
Pineify is designed to help with all of this. Instead of running a few manual backtests and picking the winner, you get a full visual map of performance. You can instantly see if that amazing result is a lone peak or part of a solid plateau of good performance.
Pricing and Accessibility
TradingView's basic strategy tester comes with every account, even the free one. If you're just starting out, you can begin backtesting right away without spending a dime. Their paid plans (Premium and Ultimate) give you faster data loading and access to more historical bars, which can make a difference in test speed and quality.
For traders ready to take things further, Pineify's Strategy Optimizer is part of its Advanced plan—a one-time payment of $149 (on sale from $219) for lifetime access. No monthly subscription. That plan includes the optimizer plus Pineify's full suite: the AI Pine Script code generator, a visual strategy builder, a trading journal, and detailed backtest reports. It's essentially a full workstation for developing and refining strategies.
When you think about cost, consider the time it saves. Manually tweaking and testing a strategy can eat up weeks. Automating that process condenses it to minutes. For regular optimizers, that efficiency alone makes the fee worthwhile.
Got Questions?
Does the Pineify Strategy Optimizer work with any TradingView strategy? Yes. If your Pine Script strategy uses standard input types—numbers, true/false toggles, dropdown menus, or timeframe selections—the optimizer handles it fine.
Do I need a paid TradingView account? Nope. The extension works with whatever plan you already have. That said, a higher-tier subscription can run backtests faster and give you access to more historical data.
Is my Pine Script strategy code kept private? Absolutely. The extension runs in your browser and talks directly to TradingView. Your code never leaves your computer.
Can I analyze the results outside of TradingView? Yes, with a one-click CSV export. Open it in Excel, Google Sheets, Python, or any tool you prefer. Here's a quick video showing how.
What's the difference between Pineify's optimizer and TradingView's built-in tool? TradingView is manual—you test one parameter set at a time. Pineify automates everything with a multi-parameter grid search, testing hundreds of combinations, then gives you a sortable table to compare results.
What to Do Next
If you're still testing strategy settings by hand on TradingView, you're probably wasting time and missing better results. Here's how to start optimizing smarter:
-
Check out the Pineify Strategy Optimizer at pineify.app/strategy-optimizer to see how it works.

-
Install the Chrome Extension from the Chrome Web Store.
-
Run your first automated test: Open a TradingView strategy, set the optimizer ranges, and let it run a grid search.
-
Review your results: Export the CSV and look for parameter combinations with stable, reliable performance. For deeper analysis, use Pineify's Backtest Deep Report v2.0 for Sharpe ratio, rolling window analysis, and Monte Carlo simulations.
-
Join the community: Share findings or ask questions in the Pineify Discord.
Whether you're adding structure to your trading or building a full quant pipeline, this optimizer saves hours and helps you find stronger strategies than TradingView's basic tools can. The real question is how much longer you want to do things the slow way when Pineify's Visual Editor and AI Coding Agent can help build and refine strategies 10x faster.