Optimize TradingView Strategies With a Trading Journal
A trading journal is a record-keeping system where you log every trade you take — entry, exit, rationale, emotions, and results. When you pair one with TradingView, raw chart analysis turns into measurable performance data. Without it, you're flying blind on your own decision-making. I've been trading for about four years, and I can tell you: the gap between "I think this strategy works" and "I know it works" is exactly what a journal fills.
What TradingView Misses About Your Performance
TradingView is built for market analysis. Its charts are fast, Pine Script is flexible, and the indicator library is massive. But it doesn't track your personal performance in any meaningful depth.
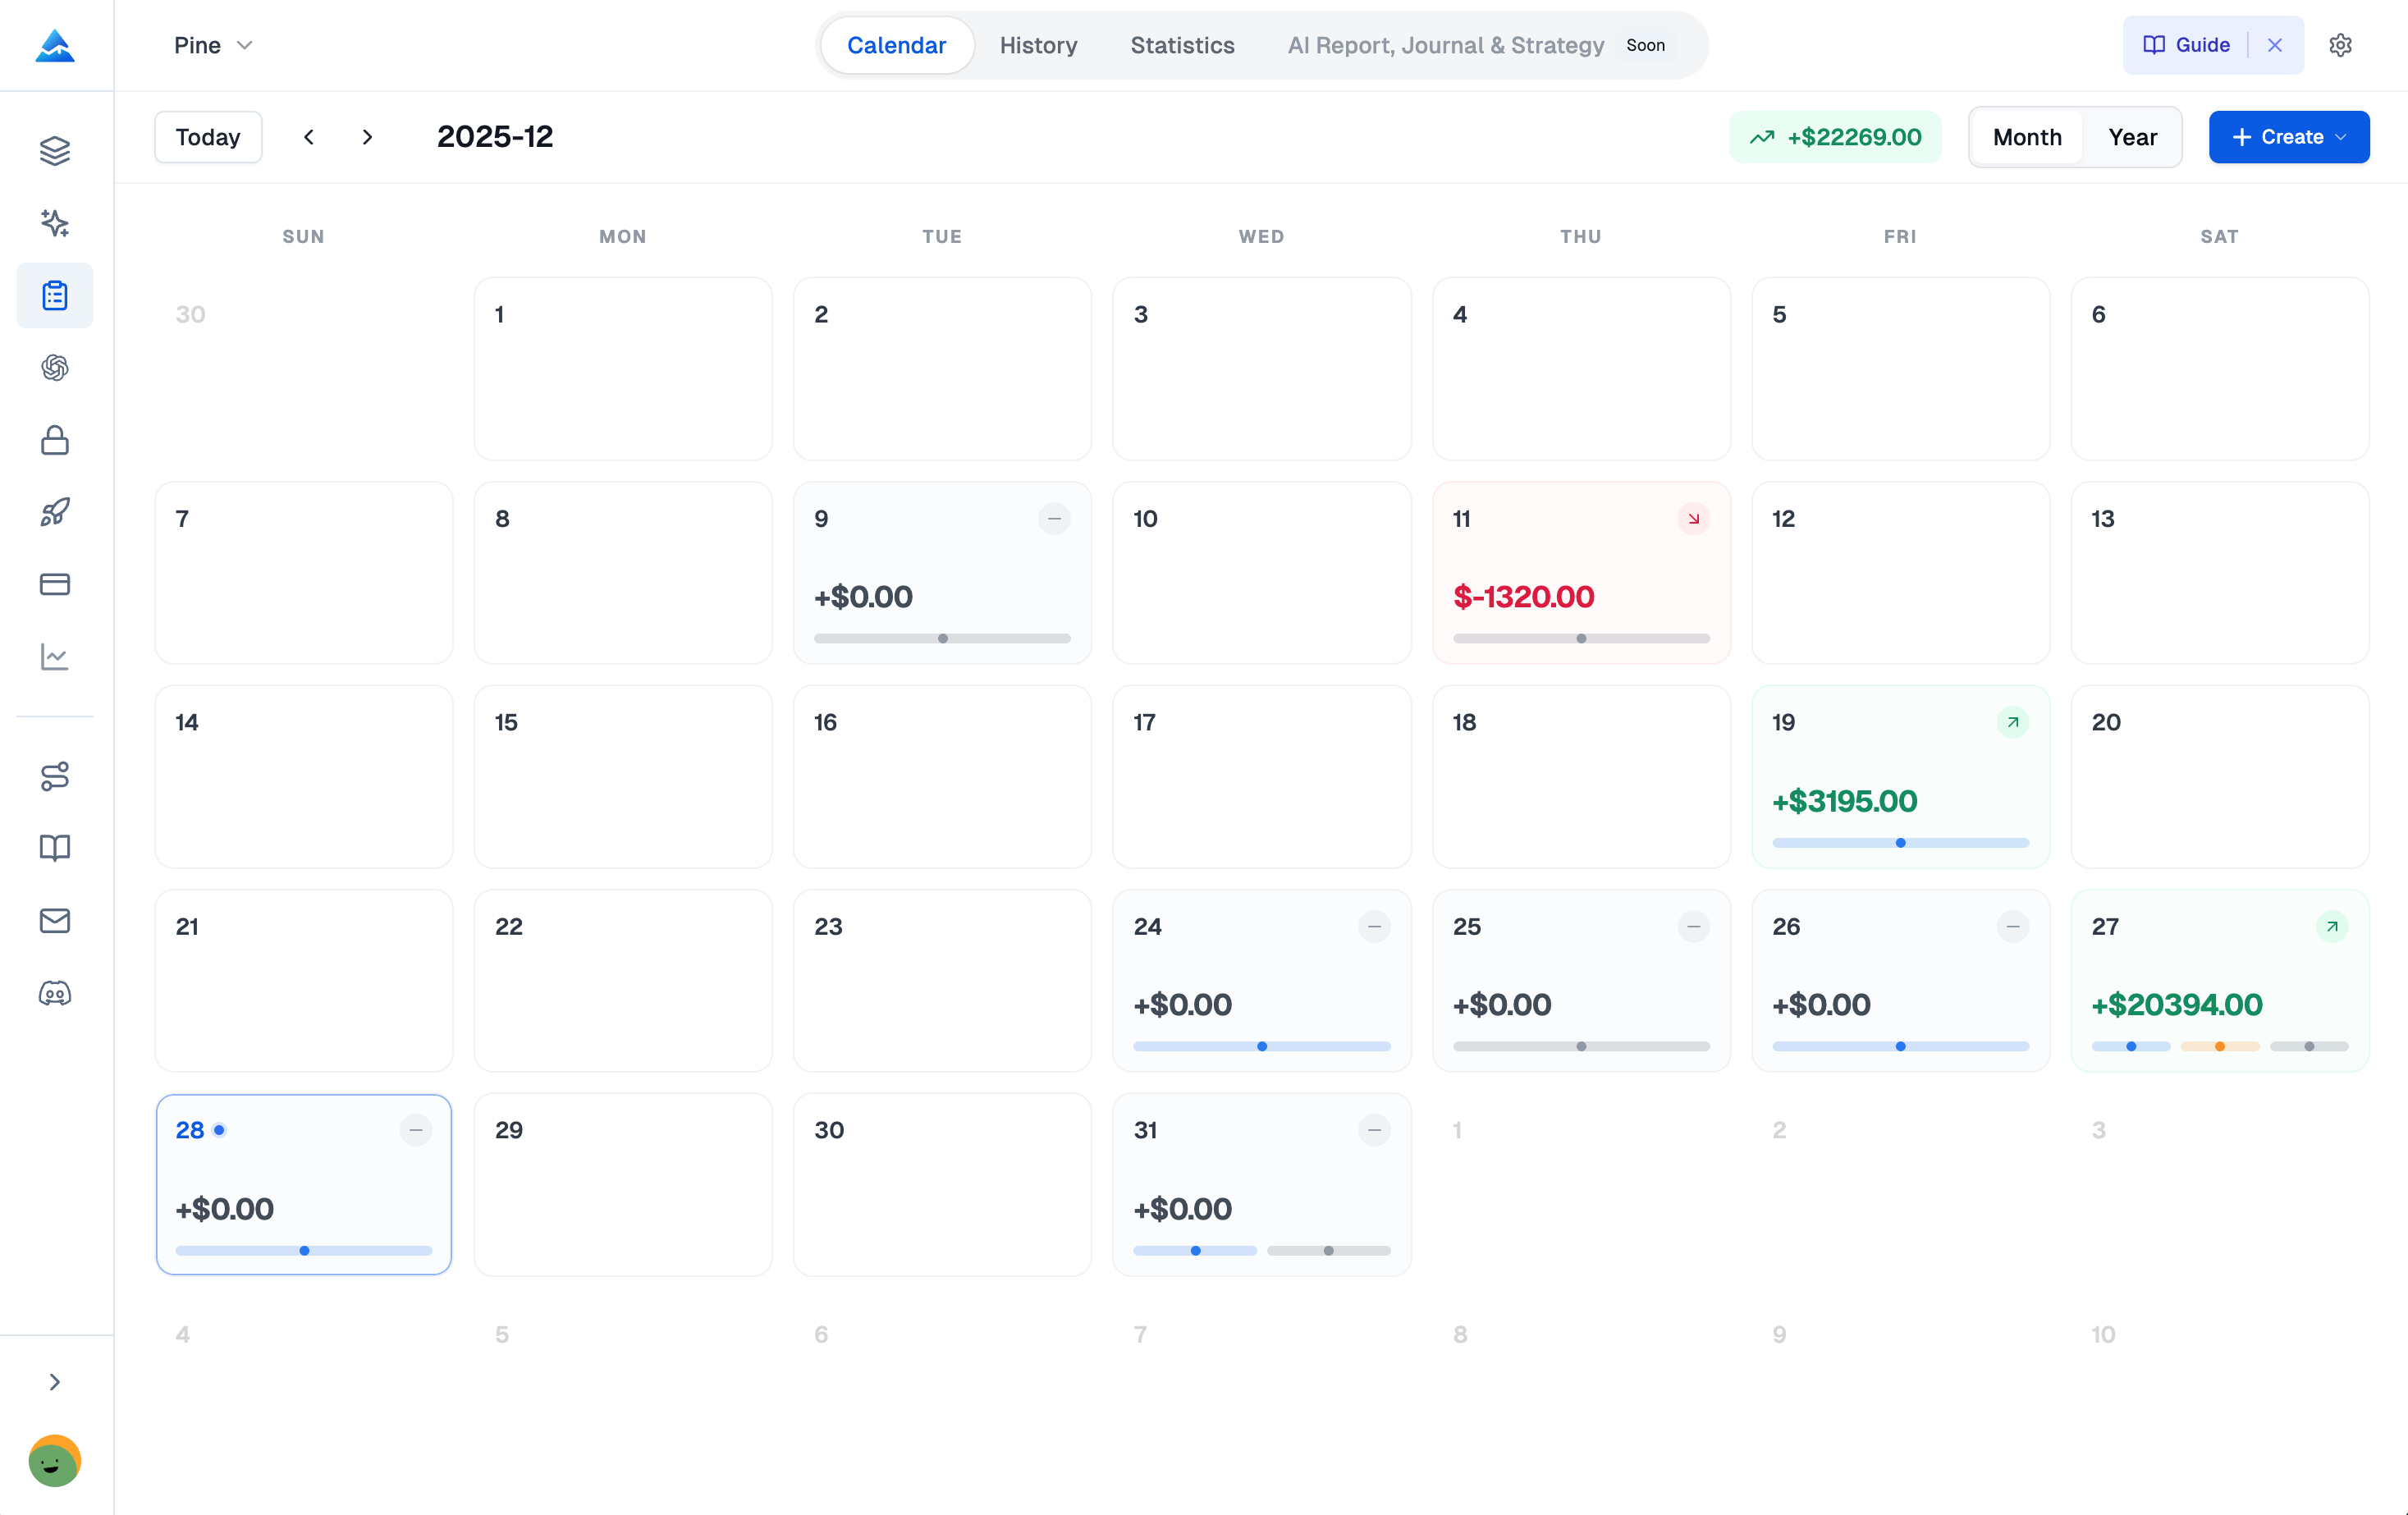
The built-in journal inside the Trading Panel works for quick notes. That's about it. Try answering "What's my Profit Factor on mean reversion setups this month?" or "Which day of the week do I lose the most?" — you won't find those answers in TradingView alone. I checked back in March 2025 when I started logging my SPY trades, and the vanilla journal couldn't even show me a capital curve.
To actually improve, you need a feedback loop: plan, execute, record, review, adjust. A dedicated journal closes that loop. It calculates your Profit Factor, Sharpe Ratio, R-Multiple distribution, and win/loss patterns — numbers TradingView's basic tools don't touch. If you're still deciding which plan fits your usage, check out this pricing breakdown on how much TradingView costs.
What a Trading Journal Actually Does for You
Logging trades does more than store data. Over time, three things happen:
- Patterns emerge. After 50 trades, you stop guessing. You see which setups produce consistent wins and which ones drain your account. My own logs showed that my GBP/JPY breakout entries had a 1.8 Profit Factor while my EUR/USD reversal plays barely hit 0.9. I wouldn't have known without the numbers.
- Emotional triggers become visible. Writing down how you felt before each trade — confident, anxious, impatient — surfaces patterns you'd miss watching a chart. I noticed I took 40% more trades after a loss, trying to "get even." That alone probably saved me thousands.
- Risk discipline gets concrete. Recording stop-loss placement and position size for every trade forces honesty. You'll see exactly when you started gambling instead of trading.
I prefer tracking R-Multiple over simple PnL because it normalizes results across different position sizes. A $200 win on a $100 risk trade (2R) tells you more than the dollar amount alone. I haven't tested every journaling method, but R-based tracking has worked best for me.
What Pineify's Journal Does Differently
This isn't another spreadsheet template. Pineify's Trading Journal is built for people who use TradingView daily and don't want to manage trade logs in Google Sheets.
You fill in the basics — symbol, side, entry, exit — and it calculates Position Size, P&L, ROI, and R-Multiple automatically. You can tag trades by strategy, attach chart screenshots, and rate your mindset. The stats dashboard shows Profit Factor, Sharpe Ratio, Sortino Ratio, Max Drawdown, and a capital curve that TradingView's built-in journal won't show.
One limitation worth mentioning: Pineify's journal doesn't auto-import trades from your broker. Manual entry is the only option. That's a deliberate trade-off to keep you engaged with each trade, but if you're executing 50+ trades a day, it gets tedious. For most retail traders doing 5–20 trades per week, it works well.
If you want a deeper look at how specific indicators can fit into your strategy, the Donchian Channel strategy guide covers breakout trading with clear entry and exit rules.
Multiple Journals, One Account
You can create separate journals for different strategies, broker accounts, or prop firm challenges. Each one keeps its own trade history, starting balance, and stats. I run one for my Alpaca swing trades and another for my prop firm scalping account. The data stays clean, and I can compare performance without cross-contamination.
Stats That Answer Real Questions
| Metric | What It Tells You |
|---|---|
| Net PnL & Win Rate | Overall profitability and consistency |
| Profit Factor | How much you earn per dollar lost |
| Sharpe & Sortino Ratios | Risk-adjusted return quality |
| Max Drawdown | Worst equity decline from peak |
| R-Multiple Distribution | Whether you cut winners short or let losers run |
| Weekday Analysis | Which days produce your best results |
| Tag Performance | Which setups (breakout, pullback, gap fill) perform best |
The Capital Curve chart alone is worth the switch. It plots your equity over time and gives you an honest snapshot of your trading journey.
Defined Strategies With Checklists
You can formalize each strategy with entry rules, exit conditions, and a pre-trade checklist. Every logged trade links to a strategy, so you see the exact win rate, profit factor, and PnL for that approach. I've dropped two strategies I thought were working after the numbers showed otherwise.
Diary and Session Tracking
The Diary lets you log daily thoughts, rate your mindset, and attach TradingView screenshots. Sessions group trades by time windows — London Open, New York session — and show PnL per window. I found out my best trades happen between 9:30 AM and 11:00 AM EST. Everything after lunch is break-even at best.
For another lens on trend direction, the least squares moving average indicator provides a clean trend-filtering signal that pairs well with session-based journal analysis.
Automated Reports
Weekly and monthly reports generate automatically. They highlight best and worst trades, Profit Factor trends, and breakdowns by symbol and strategy. I look at the weekly report every Sunday. It takes five minutes, and I've caught developing bad habits before they cost me.
How I Integrate It With My TradingView Routine
Here's what my actual workflow looks like:
- Journals set up. I created three journals: one for Alpaca swing trades, one for my prop firm scalps, and one for testing new strategies. They don't share data.
- Strategies defined beforehand. In Pineify's Strategies section, I wrote entry and exit rules for each setup I run on TradingView — breakout entries, moving average pulls, and mean reversion on RSI divergences. Each one has a checklist.
- Trade logged at fill. The moment my order fills, I open Pineify and enter: symbol, side, entry price, size. Then I tag it (e.g., "NVDA breakout"), note my risk amount, and write one sentence on why I took it. I also paste a link to my chart screenshot.
- Calendar check at day end. Five minutes in the Calendar view gives me a color-coded P&L snapshot. I see which trades are open and how the day went.
- Stats review on Sunday. I look at Win Rate, Profit Factor, and R-Multiple distribution for each strategy. I compare tag performance. If a setup has underperformed for three weeks, I stop trading it until I figure out why.
- Diary entry. Two sentences on how I felt and whether I followed my plan. I made this a habit after reading trading psychology research showing plan adherence is the single strongest predictor of profitability.
- Monthly report review. The auto-generated report tells the full story. I use it to adjust position sizing or drop a strategy entirely.
Why Consistency Compounds
The value of journaling grows over time. Month one gives you basic data. Month six shows you clear patterns. By month twelve, you know your exact edge for each setup across different market conditions.
Most traders I've talked to who stick with it discover the same thing: two or three strategies drive almost all their profits. The rest is noise. Once you know which ones work, you can stop wasting time and capital on the others.
With Pineify, you're not guessing anymore. You see the real numbers — Win Rate, Profit Factor, average R-Multiple — calculated from your actual trade history. That data lets you make decisions based on evidence, not feelings.
▶Does TradingView have a built-in trading journal?
Yes. TradingView includes a basic journal inside the Trading Panel for quick notes and simple trade filters. However, it lacks advanced analytics like Profit Factor, Sharpe Ratio, R-Multiple distribution, and capital curve tracking. Most serious traders use a dedicated tool like Pineify for deeper strategy review.
▶What metrics should I track to improve my trading strategy?
Focus on Profit Factor (aim above 1.5), Win Rate paired with average win/loss size, R-Multiple distribution to gauge consistency, and Max Drawdown to understand the worst equity decline. These numbers together reveal whether your strategy has a real edge rather than just lucky streaks.
▶Can I track multiple TradingView strategies separately in a journal?
Yes. Pineify lets you create completely isolated journals—one per strategy, broker account, or capital pool. Each journal maintains its own trade history, tags, and performance stats, so you can compare strategies without data mixing between them.
▶How does tracking trading psychology improve performance?
Logging your mood, confidence level, and plan adherence alongside trade data reveals behavioral patterns—like taking impulsive trades when frustrated. Over months, this self-review helps you identify and break emotional triggers that quietly erode profitability.
▶How do I attach TradingView chart screenshots to my trade notes?
In Pineify's Diary feature, you can attach screenshots directly to each trade log or journal entry. This gives you visual context so you can revisit exactly what the chart looked like and why you entered—useful weeks or months after the trade.
▶Is the Pineify Trading Journal free to use?
The full-featured Trading Journal is available on Pineify's Advanced Plan. Pineify offers a one-time lifetime payment option, making it a cost-effective alternative to recurring monthly subscriptions for traders who want professional-grade analytics tools.
▶How often should I review my trading journal for best results?
Review the Calendar view daily (two minutes), dig into Stats weekly to assess Win Rate and Profit Factor, and generate a monthly report to identify performance trends. This layered review cycle ensures you catch issues early and continuously refine your approach.
Start Building Your Edge Today
The difference between traders who plateau and those who keep improving comes down to one habit: reviewing your own execution. Pair a journal with TradingView, and every trade becomes a lesson.
- I'd start with one account and one strategy. Track it for thirty days before adding more.
- You do not need twenty metrics. Focus on Profit Factor, Win Rate, and R-Multiple.
- Set a calendar reminder to review stats weekly. Skip a week and the habit dies.
Your charts show you the market. A journal shows you what you're doing in response. That second view is where real improvement happens.