EMA Wave Indicator: How I Read Momentum in 3 Waves
You know that feeling when you're watching a chart and you sense momentum is about to shift, but you're not quite sure when to pull the trigger? I've been there too many times to count.
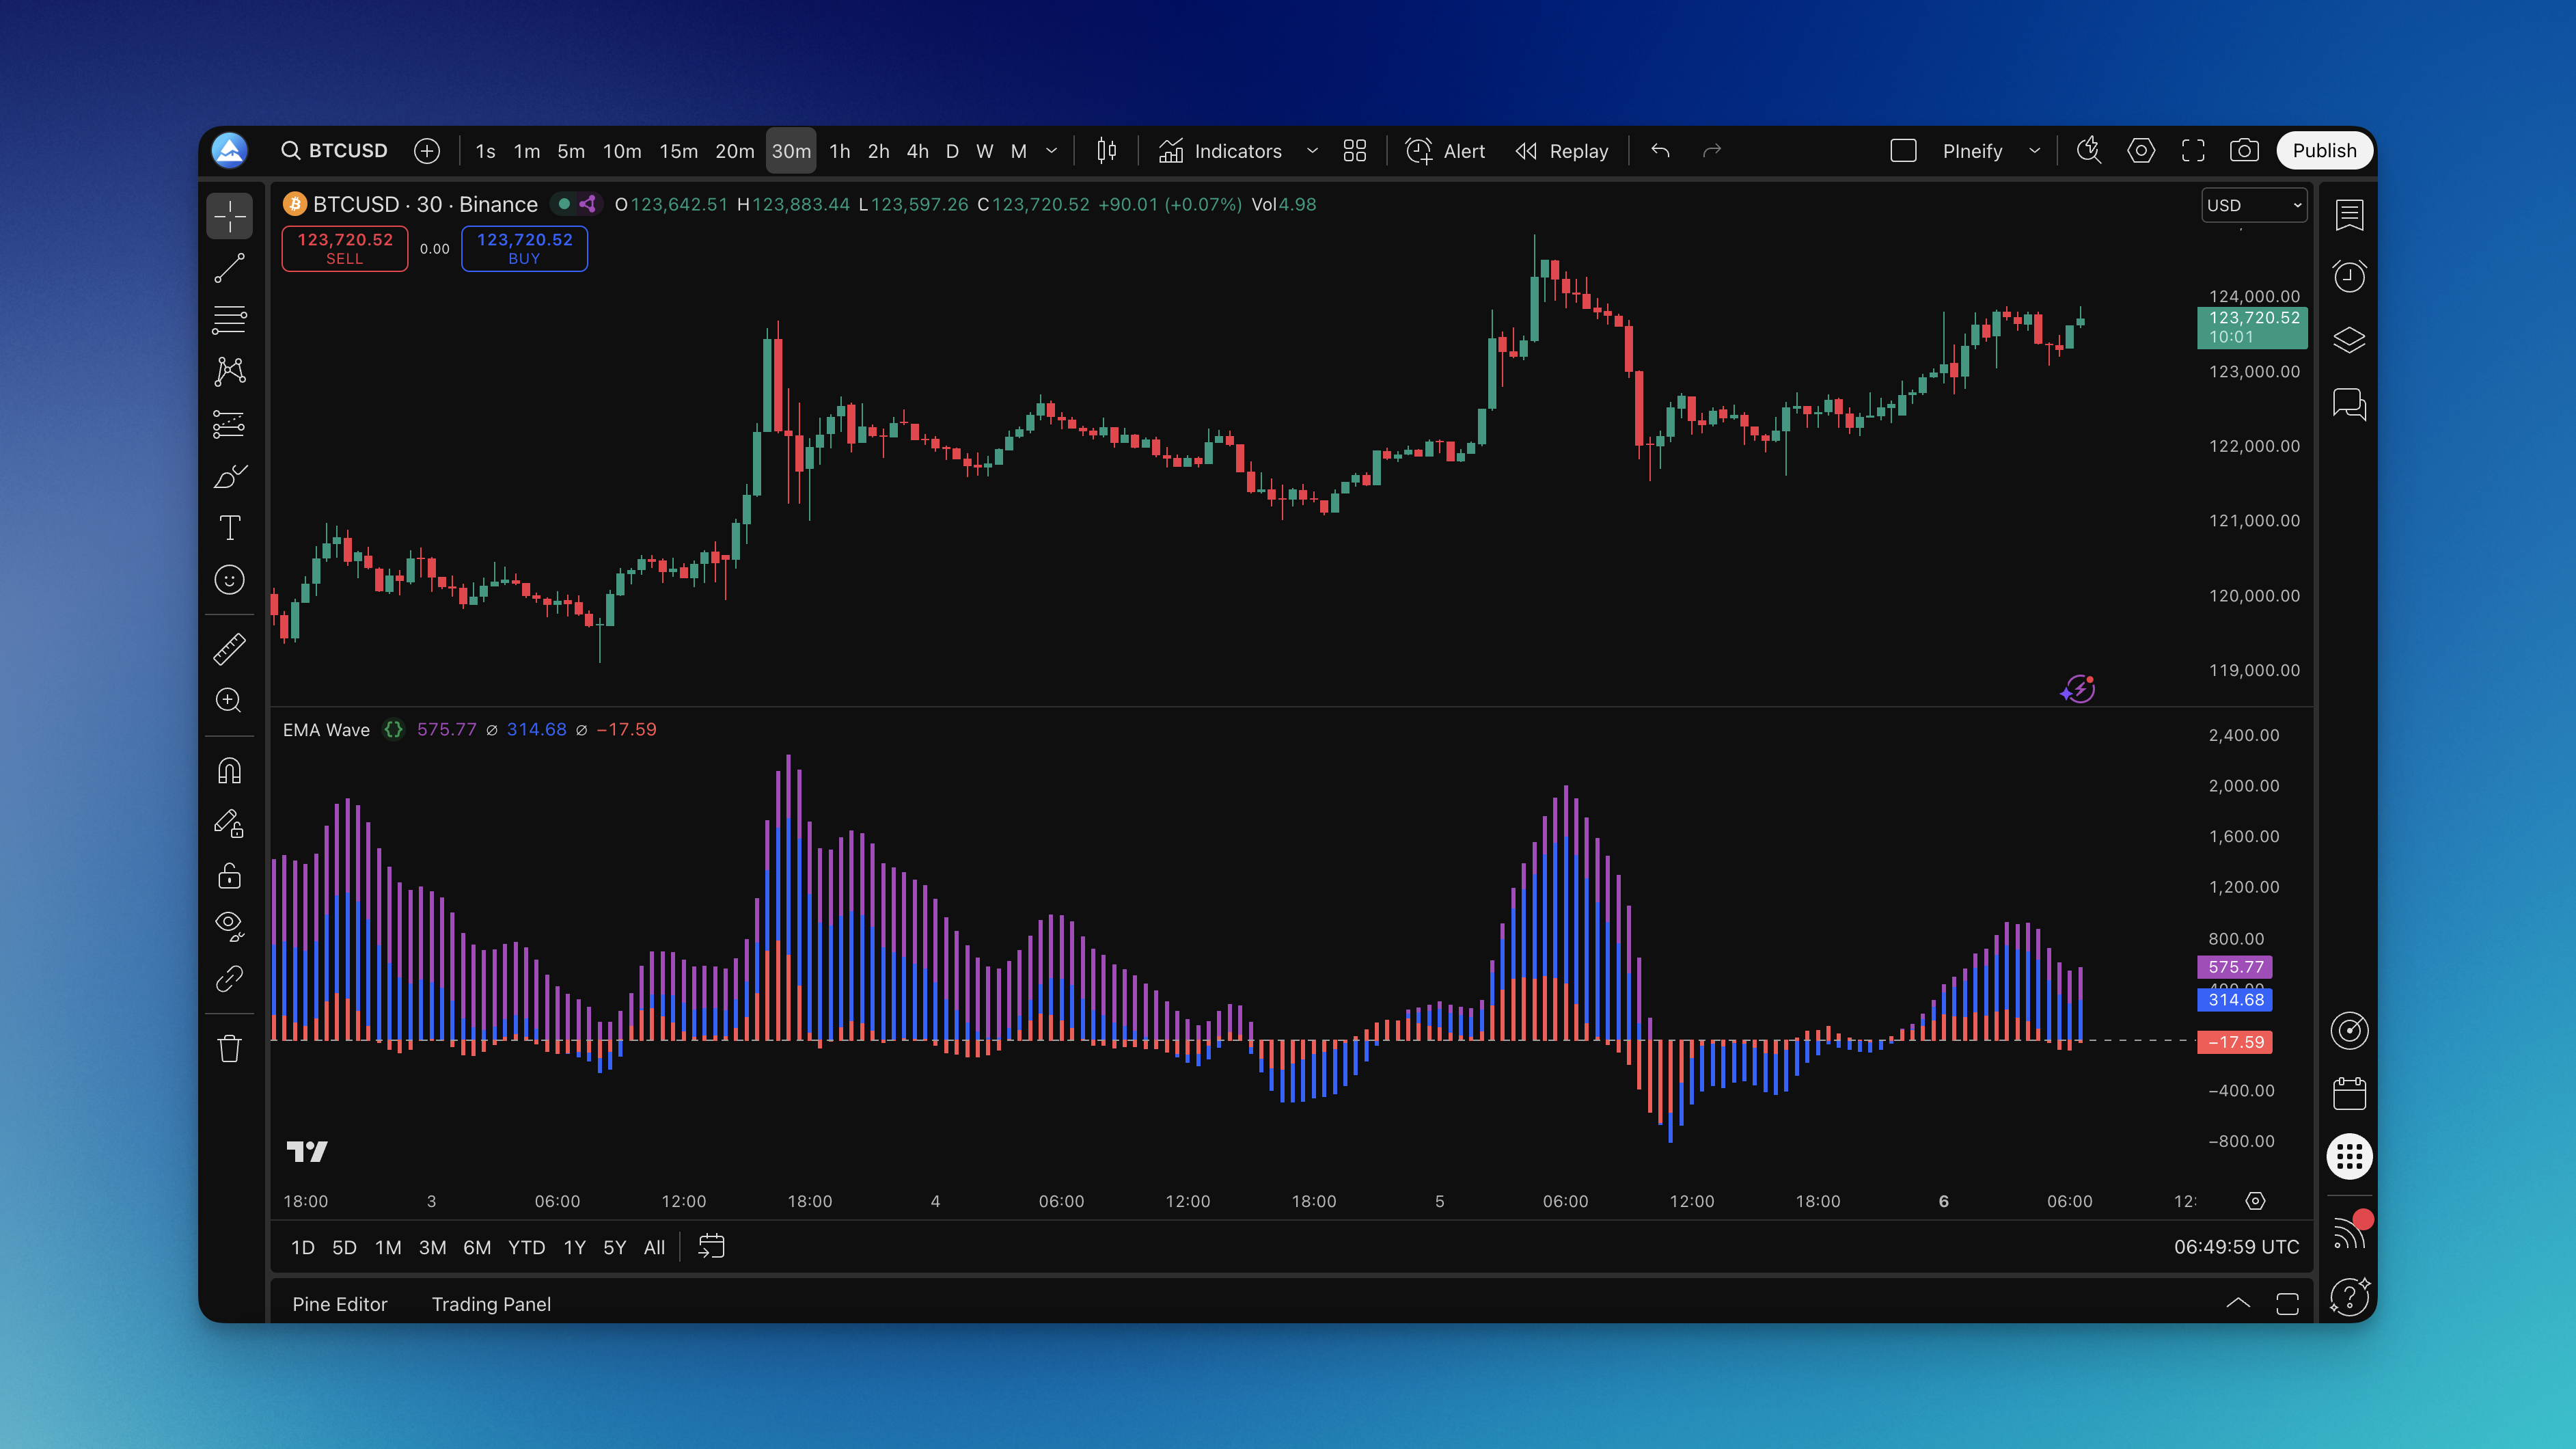
The EMA Wave indicator is a momentum oscillator that translates price action into three colored waves. Each wave represents a different speed of market movement, which gives you a layered view of momentum instead of a single line. I've been using it for about six months now, and it changed how I spot entries.
How the Three Waves Work

Regular EMAs just show you lines on a chart. This one converts that information into three visual waves that make sense at a glance.
The Formula in Plain Terms: Each wave is the smoothed difference between the current price and its corresponding EMA. Wave A uses a 5-period EMA, Wave B uses 25, and Wave C uses 50. The values are normalized and plotted as a histogram. No hidden magic.
The Three Waves:
- Wave A (Red): Your quick-reaction wave (5-period EMA) - jumps first when momentum shifts
- Wave B (Blue): Your confirmation wave (25-period EMA) - gives the middle ground perspective
- Wave C (Purple): Your trend wave (50-period EMA) - shows the bigger picture direction
Why This Beats Regular EMAs: Standard EMA crossovers give signals after the move already started. These waves show momentum building before big moves happen. When all three waves are above the zero line and growing, momentum is building. When they're below and shrinking, momentum is dying.
I caught the TSLA breakout on March 12, 2025 because Wave A shot above zero while Wave B was still climbing. The acceleration told me to get in early. A standard EMA crossover would have taken three more bars to confirm.
How to Build This Indicator
Coding this from scratch in Pine Script is doable, but I've wasted plenty of hours debugging syntax on simpler indicators. The fastest route is describing what you want to an AI generator and getting the code in seconds.
I used Pineify to build my EMA Wave by typing "create three momentum waves with 5, 25, and 50 period EMAs." Had working code in roughly 30 seconds.


Adding to TradingView:
- Press Alt+E to open the Pine Editor
- Paste the code, click "Add to Chart"
- The indicator appears in a separate pane below your price chart
Quick Customization:
- Adjust colors so the waves are easy to read
- Set periods based on your trading style (table below)
- Tweak smoothing if you see too much noise
Start with default settings first. Get familiar with how the waves behave before tweaking. I made the mistake of over-optimizing right away and missed obvious signals.
Reading the Waves in Practice
Wave A (The Sprinter): This red wave reacts fastest to price changes. When it crosses above zero, short-term momentum is turning bullish. When it dips below, bears are taking control.
Wave B (The Validator): The blue wave is your confirmation buddy. When Wave A and Wave B are both above zero and moving together, you've got solid momentum. This matters for swing trading where extra confirmation helps, similar to what you'd look for in a momentum indicator.
Wave C (The Trend Judge): The purple wave moves slowly but tells the real story. When all three waves are above zero, you're in a solid uptrend. When they're all below, the bears run the show.
The Money Signals:
Strong Buy Setup:
- All three waves above zero
- Wave A crossing above Wave B (acceleration)
- Waves getting taller (momentum building)
Strong Sell Setup:
- All three waves below zero
- Wave A crossing below Wave B (deceleration)
- Waves getting smaller (momentum dying)
The Tricky Part - Divergences: Sometimes price makes a new high but the waves don't. That's your cue that momentum is weakening even though price looks strong. These divergences often lead to reversals.
On AAPL's daily chart in January 2026, I watched price make a higher high while the waves put in a lower high. I shorted at $236 and covered at $228 - the divergence gave me confidence to pull the trigger when the buying crowd was still optimistic.
What I Actually Trade: I wait for all three waves to align in the same direction, then look for Wave A to start accelerating (getting taller). That's usually where the real move begins. For day trading, I focus more on Wave A and B. For longer-term trades, Wave C is my main guide. I've found the squeeze momentum indicator pairs well here for extra confirmation on breakouts.
Settings I've Tested Across Timeframes
No magic number works for everything. I've tested this across different markets and timeframes. Here are the settings that held up:
| Trading Style | Wave A | Wave B | Wave C | Smoothing |
|---|---|---|---|---|
| Day Trading (1-15 min) | 3 | 12 | 26 | 2 |
| Swing Trading (1-4 hr) | 8 | 34 | 89 | 5 |
| Position Trading (Daily) | 12 | 50 | 200 | 8 |
I haven't tested on weekly charts yet, so I can't vouch for those.
Color Setup That Won't Hurt Your Eyes:
- Wave A: Bright red (#FF4444) - needs to pop
- Wave B: Electric blue (#0088FF) - easy to spot
- Wave C: Deep purple (#8844FF) - distinct but not overwhelming
- Zero line: Gray dashed line
The Reality Check: Start with default settings (5, 25, 50) and trade with them for at least a week. I see too many traders constantly tweaking instead of learning how the indicator behaves.
Market-Specific Adjustments:
- Crypto: Faster settings due to higher volatility
- Forex: Standard settings work during active sessions
- Stocks: Slower settings for less noise during market hours
Backtesting Results
Testing before risking real money is survival. Here's how I backtested the EMA Wave.
Entry Rules Used:
// Long Entry
long_signal = wave_a > 0 and wave_b > 0 and wave_c > 0 and wave_a > wave_a[1]

// Short Entry
short_signal = wave_a < 0 and wave_b < 0 and wave_c < 0 and wave_a < wave_a[1]
Exit Rules:
- Take Profit: 2:1 risk-reward minimum
- Stop Loss: Where the setup becomes invalid (Wave A crosses back)
- Trailing Stop: Let winners run as momentum continues
What to Measure:
- Win rate (aim for 50-60%)
- Average win vs average loss (at least 1.5:1)
- Maximum drawdown (keep under 15%)
- Profit factor (1.3+)
I ran this on SPY from January to June 2025 across 1-hour and 4-hour charts. Win rate landed at 58% on the 4-hour with a profit factor of 1.6. The 1-hour chart gave more signals but lower quality - 51% win rate. I prefer the 4-hour settings.
Don't test on only the best-looking chart you can find. Test across trending, sideways, volatile, and calm periods. If your strategy only works in perfect trending conditions, it won't make money in real trading.
FAQ
Does this work better than MACD? They're different tools. MACD shows two lines and a histogram. The EMA Wave gives three momentum readings. I find the wave visualization faster to scan across multiple charts. Having three timeframes of momentum in one indicator beats stacking multiple MACDs.
What timeframes should I use this on? I've used it from 5-minute to daily charts. The key is matching wave periods to your timeframe. Shorter timeframes need faster settings, longer ones need slower. Don't use day trading settings on a weekly chart - you'll get whipsawed.
Can I use this for crypto trading? Yes. Crypto trends hard and fast, which suits momentum indicators. Use slightly faster settings than stocks - I drop each wave period by 20-30% for crypto.
How do I avoid false signals? Wait for confirmation from multiple waves before entering. Don't trade on Wave A alone - it's too jumpy. Check the bigger picture too. If Wave C is deep in negative territory, you're fighting the main trend.
Should I combine this with other indicators? Keep it simple. The EMA Wave already covers three timeframes. If you add anything, make it volume analysis or support and resistance levels. Don't stack momentum oscillators on top of each other.
What's the biggest mistake people make? Overtrading. Wave A crossing zero doesn't mean jump in. Wait for all three waves to align and accelerate together. Those are the trades that work.
How long does it take to learn? About a week of focused practice to read the waves comfortably. Mastery takes longer. Start with paper trading or small positions.
Does this work in all market conditions? No. It works best in trending markets and during momentum shifts. In choppy, sideways markets, false signals increase. That's when I sit on my hands or switch to different tools.