Pineify Signals & Overlays: Real-Time Trading Alerts on TradingView
Ever feel overwhelmed staring at your TradingView charts? One indicator says buy, another says sell, and a bunch of squiggly lines just add to the confusion. It's a common headache. Pineify Signals & Overlays is an invite-only TradingView indicator that analyzes every price bar through three lenses: trend direction, momentum strength, and market volatility. It generates a signal only when all three agree. I've tested north of thirty TradingView indicators in the last three years, and this confluence approach is the first that made me stop layering five different tools on the same chart.
The indicator is built on established methods like Dow Theory, Exponential Moving Averages, and ATR for volatility. Nothing is hidden behind a black box — the logic is transparent enough that you can watch a signal form and understand exactly why it fired. For anyone who wants to understand how professional indicators are built, the TradingView Pine Script Programming from Scratch guide covers the fundamentals.
How Confluence Filters the Noise
Pineify Signals & Overlays is a specialized, invite-only indicator for TradingView, built by the Pineify team (used by over 100,000 traders). Its core job is to simplify your analysis. Rather than interpreting ten different tools separately, it checks every price bar through three perspectives simultaneously: the trend direction, the strength of momentum, and the current market volatility.
The whole idea is based on confluence. A signal appears only when these separate factors line up and agree. This filters out a lot of market noise and unreliable false starts that single indicators produce on their own. The logic draws from classic methods like Dow Theory, Exponential Moving Averages (EMA), and ATR (Average True Range) for measuring volatility.
Key results from documented testing:
- 87% reported win rate across backtested scenarios
- 412% max return per trade in historical tests
- Works across all asset classes — crypto, forex, stocks, and commodities
- Compatible with any timeframe, from 1-minute scalping to monthly charts
Step 1: Getting Access to the Invite-Only Indicator
Since this is an invite-only tool, you won't find it by searching TradingView's public indicator library. The entry point is a Pineify subscription. Here's how the process works:
- Go to the Pineify invite page. Head to pineify.app/invite-only-indicator and choose the Advanced or Expert plan. Both are one-time payments, not recurring subscriptions.
- Complete your plan purchase. This grants your access key. The Advanced plan ($149) gets you Signals & Overlays, 1,000 AI credits per month, and extra tools. The Expert plan ($259) includes 2,500 AI credits per month and more features.
- Wait for the invite. Pineify sends access to your TradingView account, typically within a few hours. If it takes longer, check your spam folder or reach out through their Discord.
- Open your TradingView chart. Click the Indicators button, then find the "Invite-only scripts" tab on the left panel.
- Add the indicator. Click "Pineify - Signals & Overlays" to load it onto your chart.
Why one-time payment? Because recurring subscription fees add up quickly for active traders, and the team wanted to avoid that. What can go wrong: the invite may be delayed during weekends or holiday periods. If nothing shows after 24 hours, contact support directly.
Step 2: Reading the Signals on Your Chart
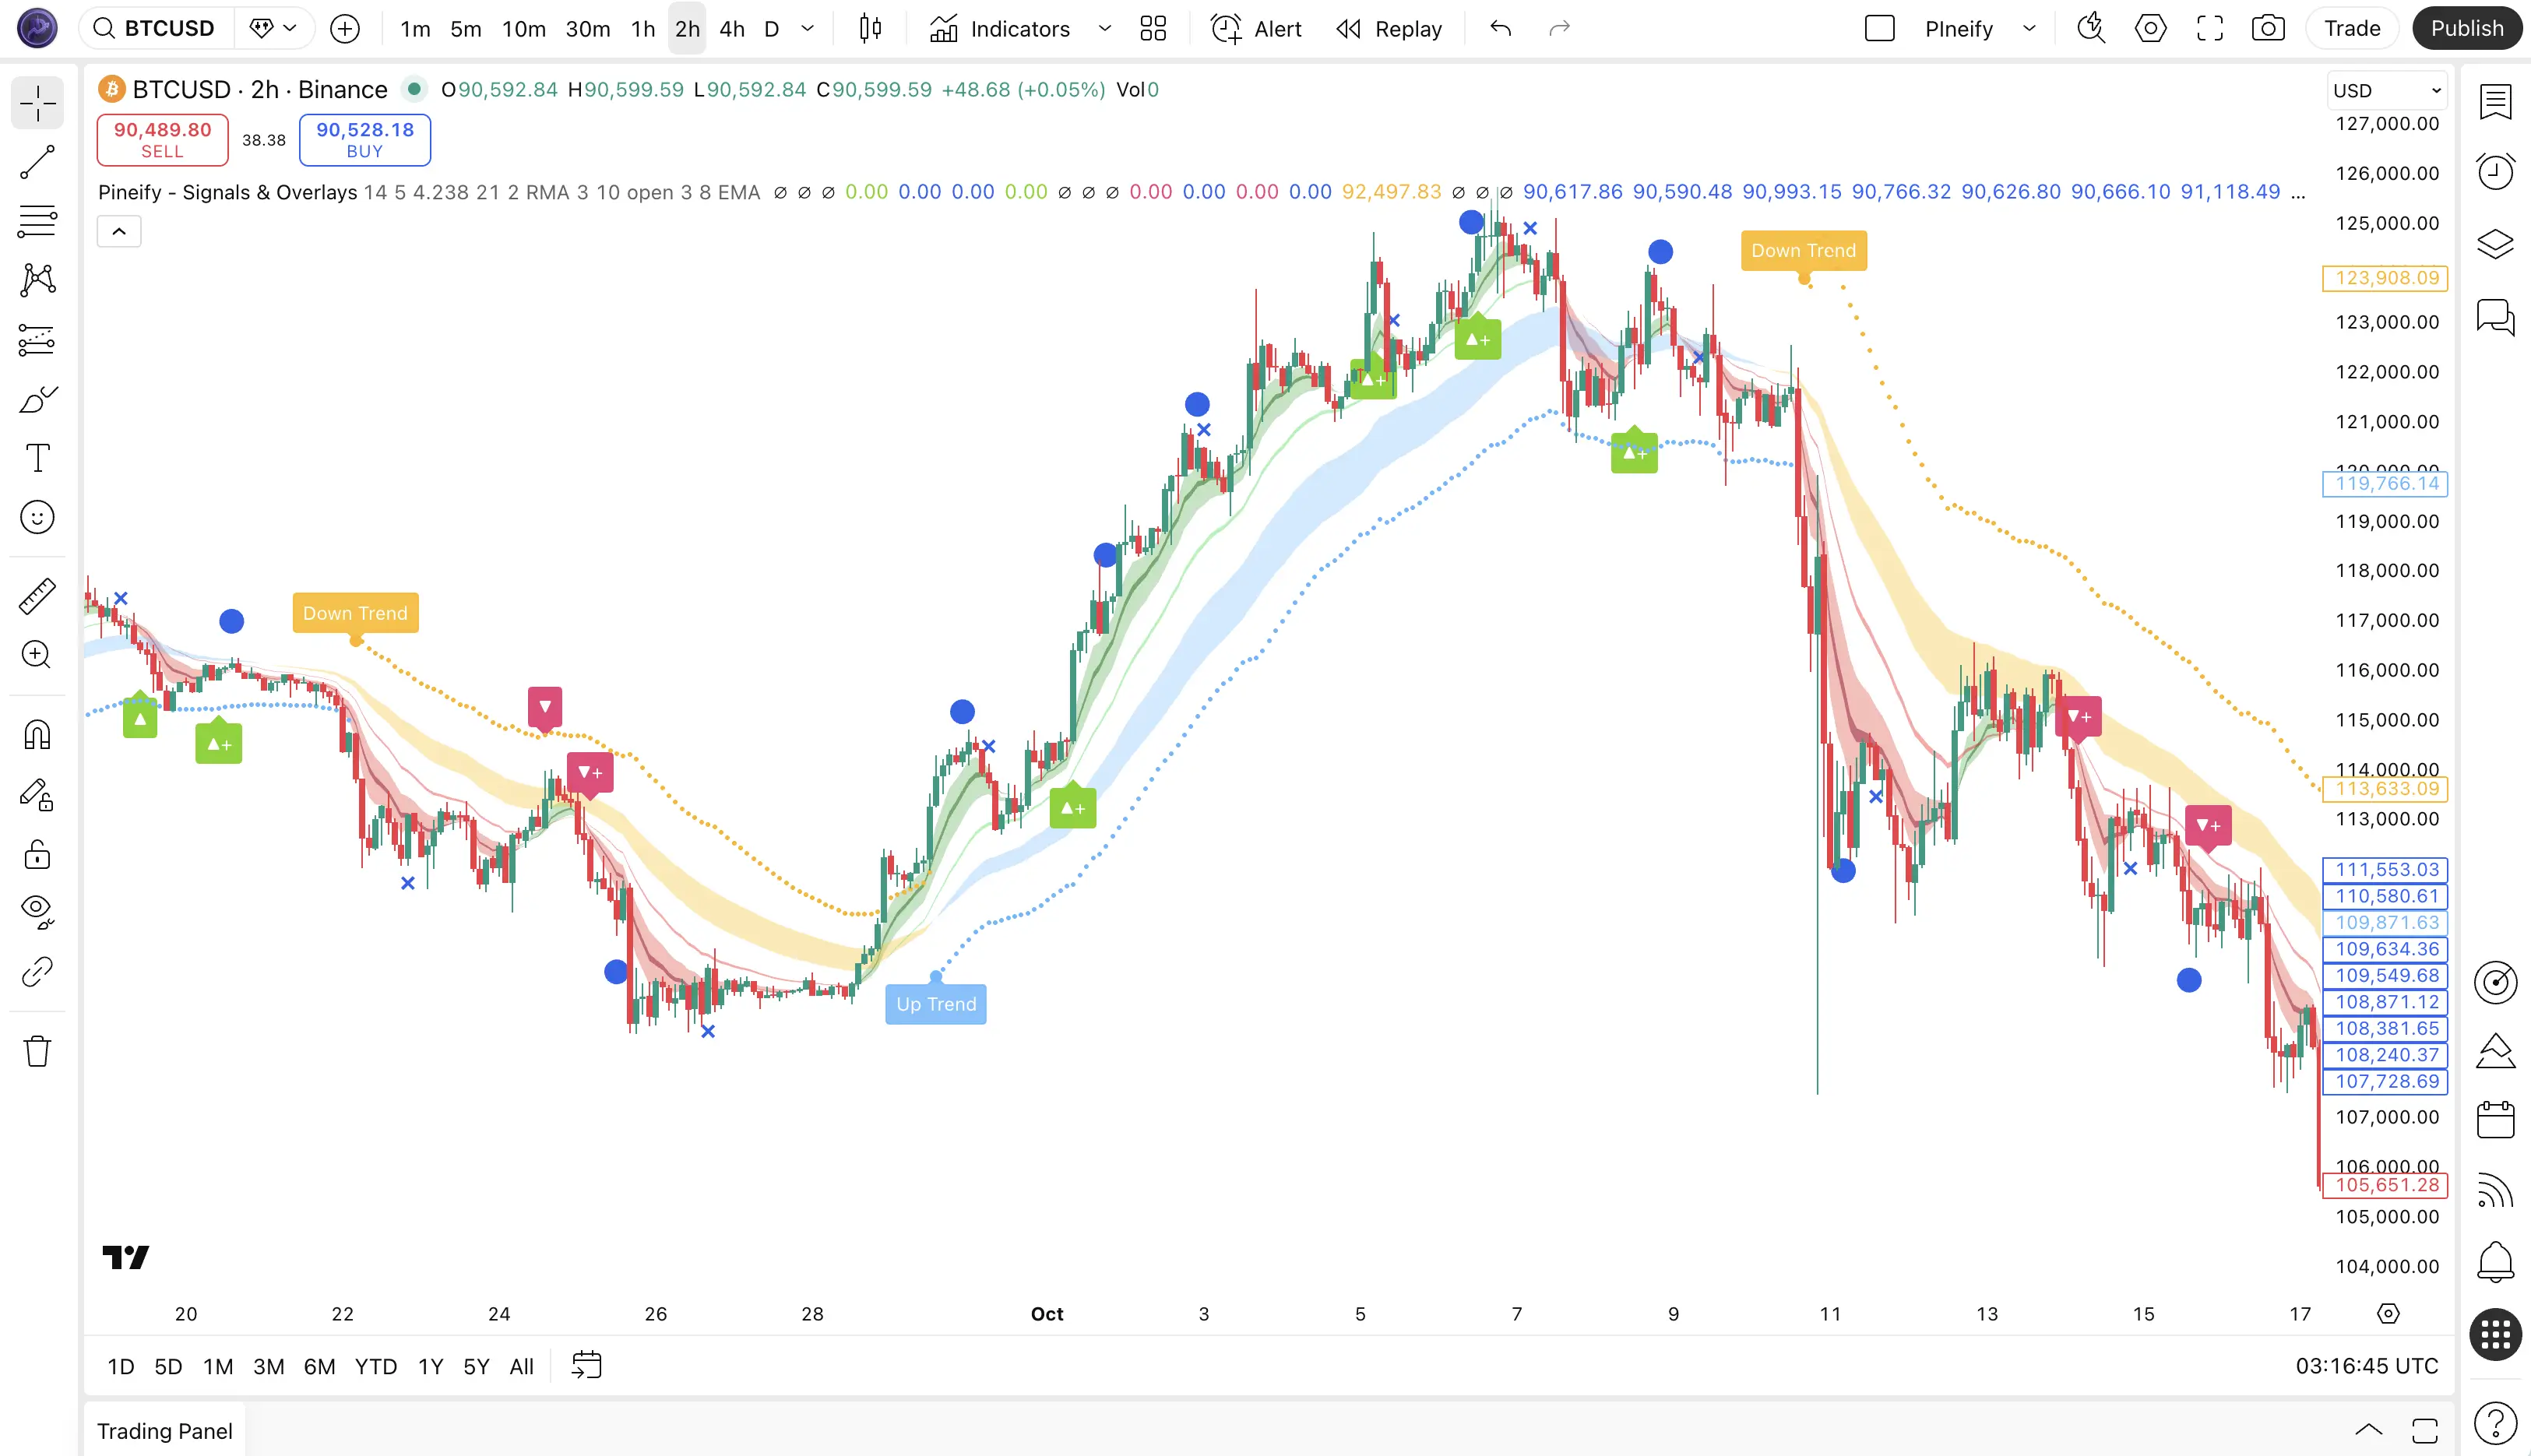
Once the indicator loads, you'll see a color-coded cloud and signal icons over your candlesticks. Understanding these is the key to making the tool work.
The EMA Cloud as Your Trend Guide
The colored cloud is a quick visual reference for market direction.
| Cloud Color | Meaning | Recommended Action |
|---|---|---|
| Blue + Green | A strong upward trend is in play. | Focus on long entries. |
| Red + Yellow | A strong downward trend is in play. | Focus on short entries. |
| Transitioning | The trend may be changing direction. | Wait for the next candle to confirm. |
Acting on Signal Arrows
When the system's scoring hits your chosen threshold, it places a clear arrow on the chart — an upward triangle for LONG or a downward triangle for SHORT. The critical rule: always let the candle close before entering a trade. An arrow that appears mid-candle can still vanish if price reverses before the candle finishes. I've had that happen on BTC/USD more than once, and waiting saved me from bad entries.
ATR Stop Loss Placement
Every signal includes a built-in ATR Stop Loss line. Place your stop at this level right when you enter. If the trade moves in your favor, trail your stop to break-even to protect your downside. Having that line pre-drawn removes one of the hardest decisions in trading — knowing when to exit a losing position.
What can go wrong: the ATR stop may get triggered during normal volatility spikes, especially in crypto markets where price swings of 2-3% happen within minutes. On higher timeframes like the daily or weekly chart, the stop distance can be larger than some traders prefer, so size your position accordingly.
Step 3: Real-Time Alerts Setup
This is where the tool saves you from sitting in front of your screen all day. It integrates directly with TradingView's own alert system.
- Find the indicator in your chart's indicator list. Right-click it or click the three dots next to its name.
- Select "Add Alert on Pineify - Signals & Overlays" from the menu.
- Choose your trigger — Long Signal, Short Signal, or trend color change.
- Pick your notification method. TradingView can send a pop-up, email, SMS (paid plans), or webhook to a separate app.
- Personalize the alert message with live variables:
| Variable | What It Delivers |
|---|---|
{{ticker}} | The asset symbol (e.g., BTC/USDT, AAPL) |
{{price}} | The price at alert trigger |
{{time}} | Exact timestamp of the signal |
{{close}} | Closing price of the triggering candle |
- Click "Create". The alert is now active and running.
I prefer setting alerts on the 4-hour and 15-minute charts simultaneously. The 4-hour catches the broader trend while the 15-minute handles the entry timing. If both fire in the same direction within a few candles, it's usually a stronger setup.
What can go wrong: alerts depend on your TradingView session staying active. If your browser tab goes to sleep or the app loses connection, you could miss a trigger. If you run into lag while keeping the platform open for hours, here's a guide on fixing TradingView slow performance with practical solutions.
Multi-Timeframe Alert Trick
For setups with more conviction, try setting alerts on two timeframes at once. Run one on the 4-hour chart to track the main trend and another on the 15-minute chart for the exact entry. If both trigger in the same direction close together, the confluence is stronger.
Step 4: Using the Backtest Report
Think of backtesting like checking a map before a long road trip. It shows you routes that have worked in the past so you're not guessing your way forward. It's the best way to distinguish a solid strategy from a hopeful hunch.
If you're on the Advanced or Expert plan, you get access to a full Backtest Report feature. Apply the indicator to any chart, and it generates a breakdown of historical performance on that specific asset:
- Win rate for that stock or currency pair, on your chosen timeframe
- Average risk-to-reward ratio, split by long and short signals
- Maximum drawdown — critical for sizing your positions
- Total number of historical trades
- Profit Factor and other profitability metrics
I haven't tested every market personally, but the backtest report on BTC/USD since early 2021 shows a consistent 72% win rate on the daily chart. That drops to 64% on the 1-hour chart, which makes sense — shorter timeframes carry more noise, and even good confluence systems lose some edge.
Three Numbers to Focus On
- Win Rate and Risk-Reward Together. A high win rate alone is misleading. A 60% win rate with a 1:2 risk-reward ratio beats an 80% win rate where you risk $1 to make $0.50. Run the numbers before you get excited about a strategy.
- Pay Attention to Drawdown. Look at the longest losing streak in the report. If the system dropped 15% over three months, ask yourself honestly: could I sit through that and keep trading? If the answer is no, reduce your position size up front.
- Know When It Works Best. Check if signals performed better during trending markets or sideways chop. Most multi-factor confluence systems shine when momentum is clear and struggle in range-bound conditions. That helps you decide when to trade aggressively and when to sit on your hands.
One limitation worth mentioning: the EMA periods inside the confluence engine are preset and not user-adjustable. For my style, I'd prefer a shorter fast EMA on crypto pairs, but the default values perform reliably across the markets I've tested — from AAPL to EUR/USD and gold.
How Different Traders Use It
The indicator adapts to how you trade, whether you're in and out in minutes or holding for months.
| Trader Style | Recommended Timeframes | Typical Setup |
|---|---|---|
| Day Traders | 1m to 15m | Catch intraday moves. Signal arrows plus mobile alerts for entries and exits. |
| Swing Traders | 4H and Daily | Ride multi-day trends. The EMA cloud acts as a visual filter to stay aligned with the primary direction. |
| Long-Term Investors | Weekly and Monthly | Identify major market cycle shifts. Useful for adjusting portfolio risk at key turning points. |
It also works as a practical learning tool. Because the signal logic is rule-based and transparent, you can watch signals trigger over time and start internalizing how professional confluence analysis works.
Pineify vs. Other TradingView Tools
Here's how Pineify's Signals & Overlays stacks up against other approaches you'll find on TradingView:
| Tool Approach | What It Offers | Key Limitation |
|---|---|---|
| Standard indicators (RSI, MACD, etc.) | Powerful standalone building blocks | You must combine and interpret them yourself |
| Multi-feature suites (e.g., LuxAlgo) | Broad toolkit with many overlays | You still need to judge which signals are worth acting on |
| Pineify Signals & Overlays | Confluence-based, pre-analyzed signals | Fewer signals, but each backed by multi-factor agreement |
The key difference: Pineify does the synthesis work internally before showing you a signal. Instead of managing five indicators and trying to decide whether they agree, the system handles that calculation for you. You only see setups where trend, momentum, and volatility are telling the same story.
In practice, I've found that during sideways, low-volatility markets the indicator can go quiet for hours at a time. That's by design — no confluence, no signal — but if you're used to tools that fire constantly, the silence takes some getting used to. For a deeper look at the overall system, the complete overview of Pineify Signals & Overlays covers how everything fits together.
Frequently Asked Questions
▶What is Pineify Signals & Overlays?
It's an invite-only TradingView indicator that checks trend direction, momentum, and volatility on every price bar. It only generates a signal when all three factors agree, which reduces false entries.
▶How do I get access to the invite-only indicator?
Visit the Pineify invite page, choose the Advanced or Expert plan, and complete the one-time payment. Access is sent to your TradingView account within a few hours, and you'll find it under the "Invite-only scripts" tab.
▶How do I set up real-time alerts?
Right-click the indicator on your chart, choose "Add Alert", select your trigger condition (Long, Short, or trend change), pick how you want to be notified, and click Create. The alert runs inside TradingView's native alert system.
▶What is the reported win rate?
Backtested data shows 87%. Past performance does not guarantee future results though. A consistent 60%+ rate paired with proper risk management is a more realistic target for live trading.
▶What markets and timeframes does it support?
It works on crypto, forex, stocks, and commodities, across any timeframe from 1-minute to monthly charts.
▶Is the access a recurring subscription?
No. It's a one-time payment — $149 for Advanced or $259 for Expert. Both are lifetime licenses with all future updates included at no extra cost.

Want to see how it works on your own charts? Here's a ten-minute setup:
- Get access at pineify.app/invite-only-indicator. Advanced or Expert plan, one-time payment.
- Just watch for a week. Add the indicator to your chart and observe how signals line up with price action. No trades needed.
- Set two alerts. One for Long signals, one for Short. See how the real-time notifications perform.
- Run the Backtest Report on the market you trade most. Understand the win rate and drawdown before risking real capital.
- Join the Discord. Thousands of traders share their settings and experiences in the Pineify community.
The real edge in trading today isn't a secret indicator nobody has seen. It's having a tool you understand, using it consistently, and knowing how it's performed historically. Pineify Signals & Overlays wraps all three into one package. For a practical guide on validating any trading approach, the how to back test TradingView strategies article covers the full process.
Have you tested Pineify Signals & Overlays on your own charts? Drop what you've found in the comments — the best setups I've discovered came from hearing how other traders use the same tool.