Momentum Indicator Guide: How to Identify Powerful Trading Signals
The Momentum indicator is a straightforward yet powerful technical analysis tool that measures the velocity of price changes. By comparing current prices to past prices, it helps traders identify the strength or weakness of market trends. When the indicator shows positive values, prices are rising; negative values signal falling prices. The steeper the momentum line's slope, the faster prices are changing.
Understanding the Momentum Indicator
The Momentum indicator is one of the oldest and most fundamental technical analysis tools available. It calculates the rate of change in price by comparing the current price with the price from a specified number of periods ago, typically 10 periods.
The formula is remarkably simple:
Momentum = Current Price - Price n periods ago
Where n represents your chosen lookback period.
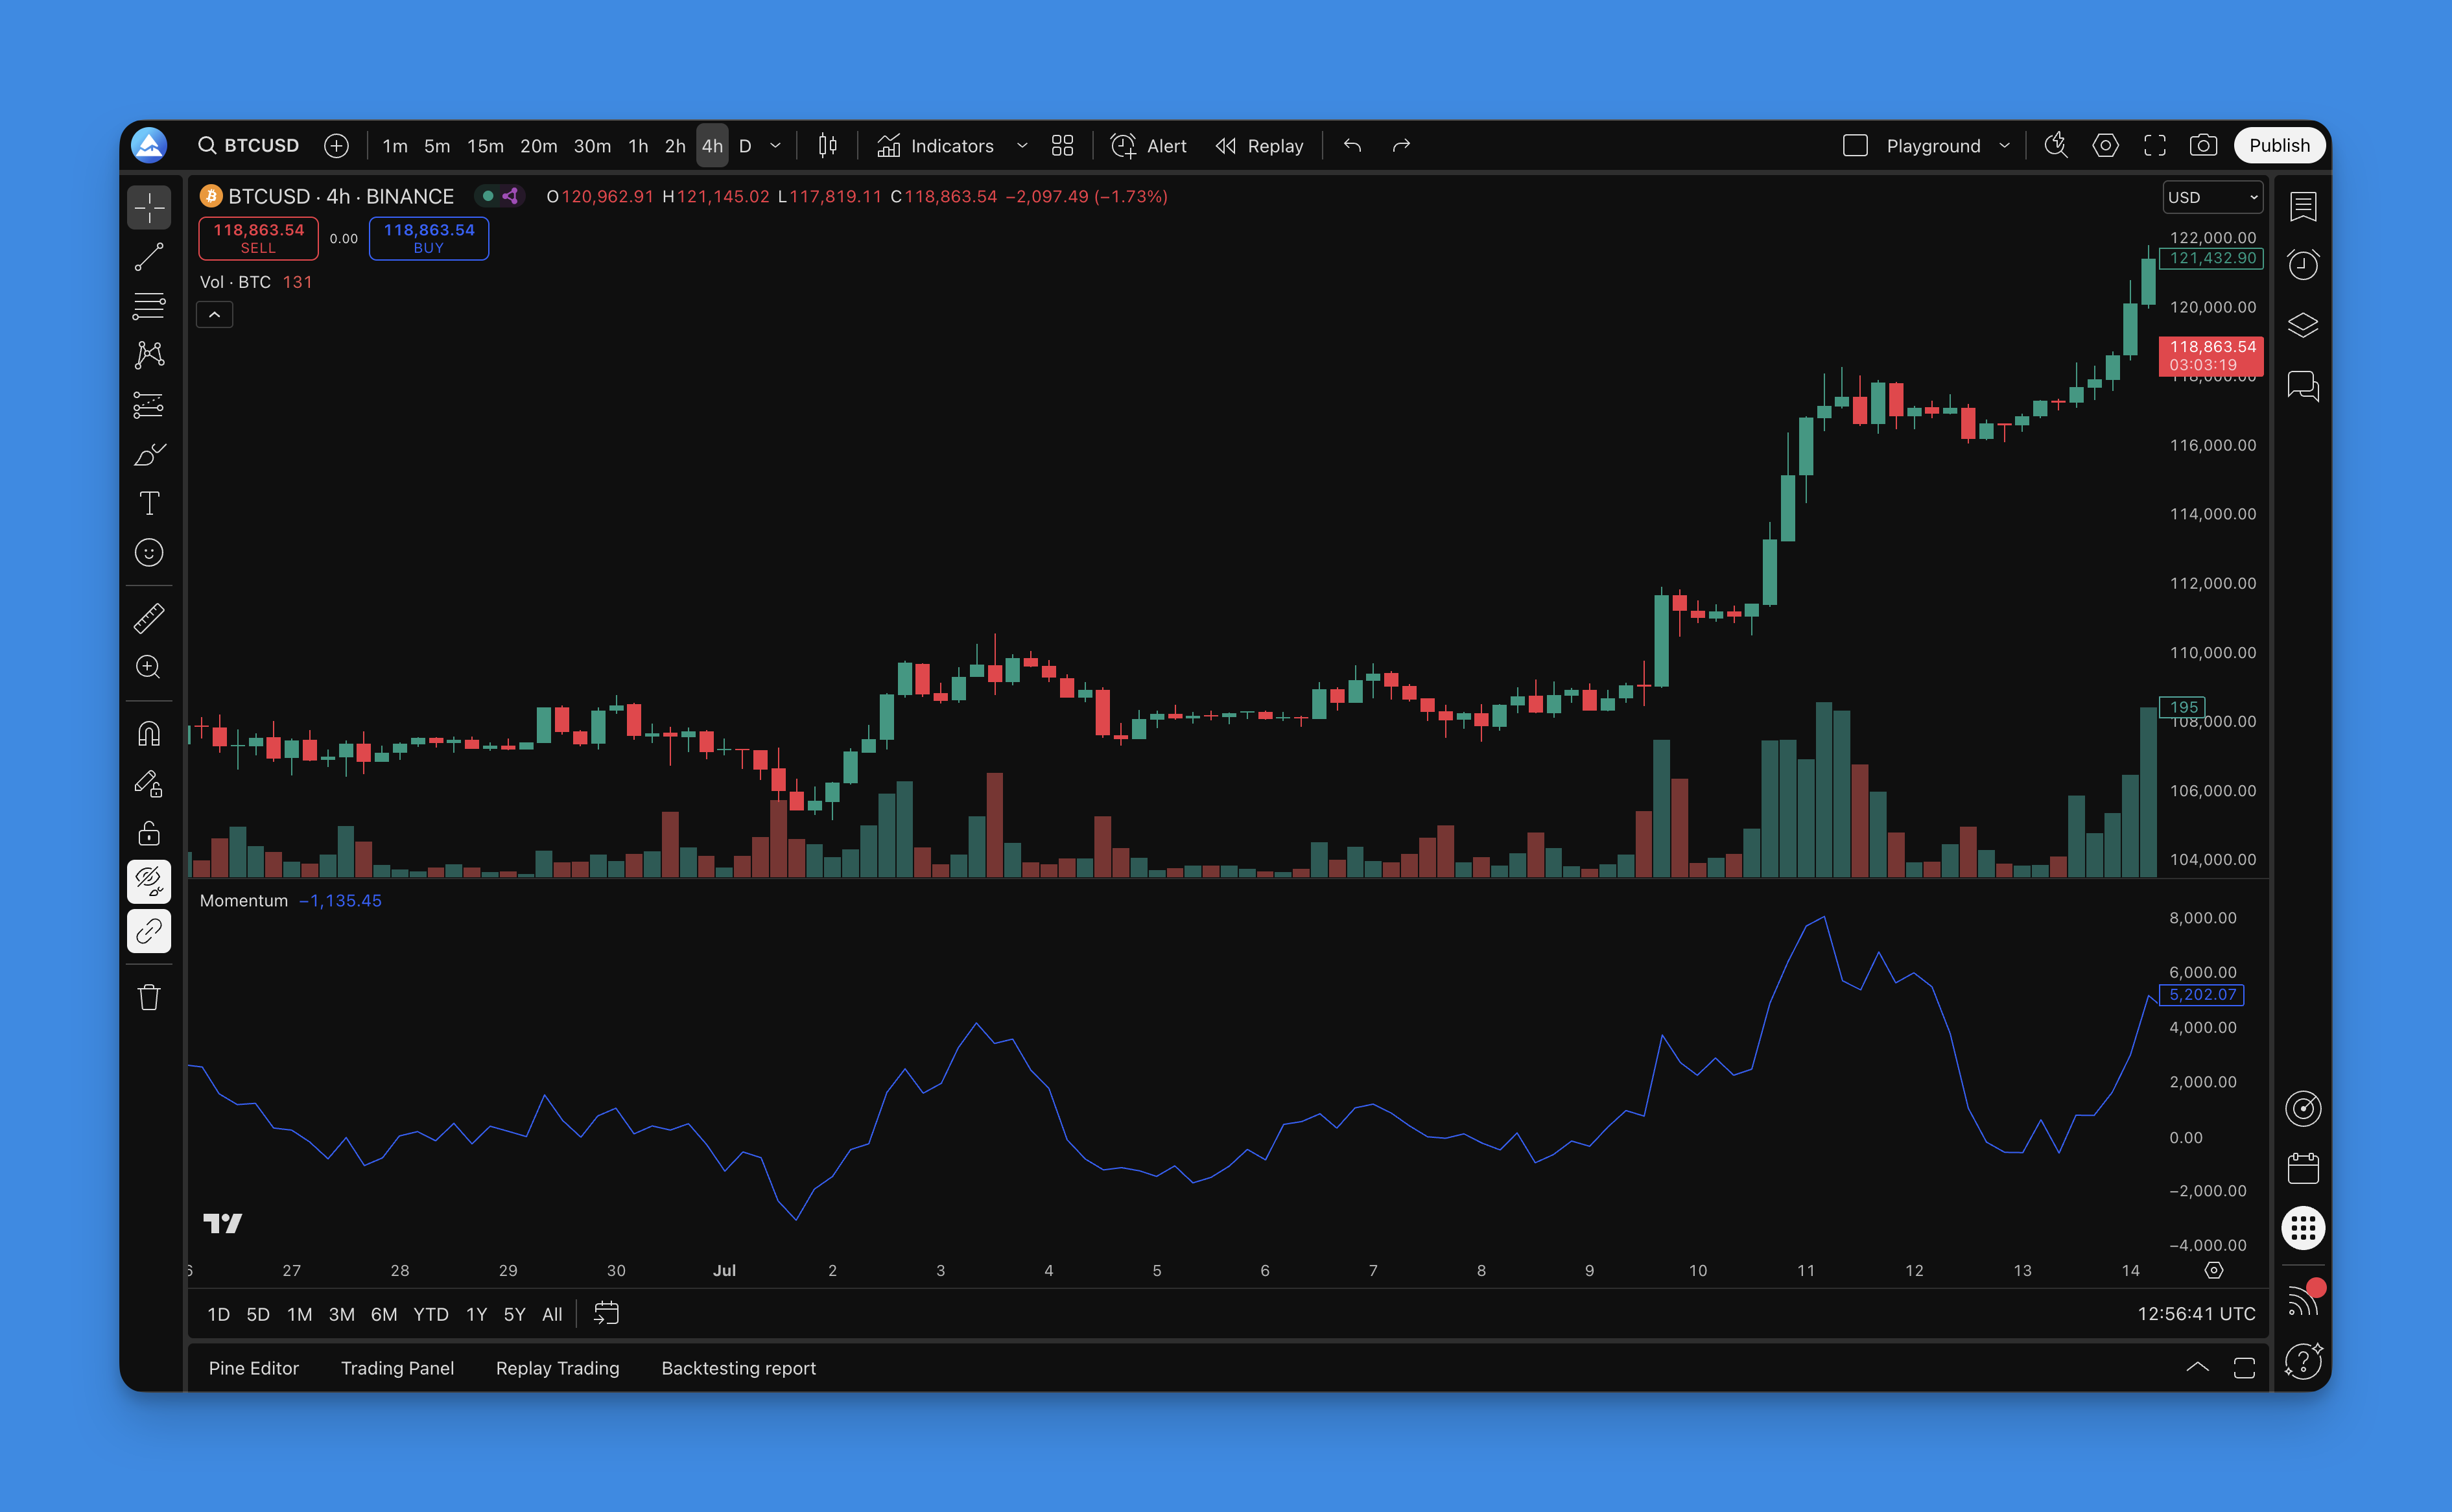
This oscillator moves above and below a zero line. When the indicator reads above zero, it indicates bullish momentum in the market. Conversely, readings below zero suggest bearish momentum. The distance from the zero line directly reflects the strength of the current trend.

What is Pineify?

Pineify is a user-friendly platform designed for TradingView users who want to create custom indicators and strategies without coding knowledge. The platform offers a visual editor where you can combine various technical indicators, including Momentum, to build sophisticated trading systems.
With Pineify, you can quickly test your ideas, optimize parameters, and implement advanced trading strategies through an intuitive interface. The platform also provides access to a library of pre-built indicators to accelerate your trading development process.
Adding the Momentum Indicator to TradingView

Adding the Momentum indicator to your TradingView charts through Pineify is simple:
- Log in to your Pineify account and open the editor
- Click the "Add Indicator" button in the toolbar
- Search for "Momentum" in the indicator search box
- Select the Momentum indicator from the results
- Click "Add" to include it in your chart
The Momentum indicator will appear in a separate panel below your price chart. You can customize its settings by clicking the gear icon next to the indicator name.
The default setting uses a 10-period lookback, which works well for most timeframes. However, you can adjust this value based on your trading style and the timeframe you're analyzing.
Effective Ways to Use the Momentum Indicator
Zero Line Crossovers
One of the most reliable ways to use the Momentum indicator is to watch for crossovers of the zero line:
- When the indicator crosses above zero, it signals a potential bullish trend beginning, suggesting a buying opportunity
- When it crosses below zero, it signals a potential bearish trend, suggesting a selling opportunity
Divergence Signals
Divergence occurs when price moves in the opposite direction of the indicator:
- Bullish divergence: When price makes a lower low, but the Momentum indicator makes a higher low, suggesting a potential upward reversal
- Bearish divergence: When price makes a higher high, but the Momentum indicator makes a lower high, suggesting a potential downward reversal
Similar to how RSI divergence patterns work, these momentum divergences can provide powerful trading signals.
Extreme Readings
The Momentum indicator can signal overbought or oversold conditions when it reaches unusual values:
- Unusually high values may indicate an overbought market, suggesting a potential downside reversal
- Unusually low values may indicate an oversold market, suggesting a potential upside reversal
Trend Confirmation
Use the Momentum indicator to confirm the strength of existing trends:
- In an uptrend, the Momentum indicator should remain positive and make higher highs
- In a downtrend, the Momentum indicator should remain negative and make lower lows
Optimal Momentum Indicator Settings
The best settings depend on your trading style and timeframe:
Short-term Trading (Day Trading)
- Period: 5-10
- More responsive to recent price changes
- Helps identify short-term trading opportunities
Medium-term Trading (Swing Trading)
- Period: 10-20
- Balances responsiveness with filtering out market noise
- Ideal for multi-day positions
Long-term Trading (Position Trading)
- Period: 20-50
- Identifies major trend changes while filtering short-term fluctuations
- Better for weekly or monthly chart analysis
Enhancing Momentum Indicator Performance
To improve the effectiveness of your Momentum indicator:
- Apply a moving average to the Momentum line: This smooths out the indicator and reduces false signals
- Use multiple timeframes: Analyze the Momentum indicator on different timeframes to confirm signals
- Combine with other indicators: Use alongside tools like Moving Average Ribbons or Bollinger Bands for confirmation
Backtesting a Momentum-Based Strategy
Testing a trading strategy based on the Momentum indicator is crucial before using it with real money. Pineify makes this process straightforward:
- Create a new strategy or open an existing one in the Pineify editor
- Add the Momentum indicator to your strategy
- Define entry and exit conditions based on Momentum signals
- Set up risk management parameters (stop-loss, take-profit, position sizing)
- Run the backtest to evaluate historical performance
A simple Momentum strategy might include:
- Entry rules: Enter long when Momentum crosses above zero; enter short when it crosses below zero
- Exit rules: Exit long when Momentum crosses below zero; exit short when it crosses above zero
- Risk management: Set stop-loss at recent support/resistance levels
By analyzing backtest results (win rate, profit factor, maximum drawdown), you can refine your strategy parameters for better performance.
Conclusion
The Momentum indicator offers traders a straightforward way to measure price velocity and identify potential trading opportunities. While simple to understand, it's most effective when used with other technical analysis tools and proper risk management.
Using Pineify's platform, you can easily implement and test Momentum-based strategies without writing code. The visual editor lets you combine the Momentum indicator with other technical tools to create comprehensive trading systems tailored to your needs.
For more advanced analysis, consider pairing Momentum with other oscillators like the True Strength Index or Chande Momentum Oscillator, which can provide additional confirmation signals.
Remember that no indicator is perfect on its own. Always use the Momentum indicator as part of a complete trading system that includes multiple confirmation signals and sound risk management principles.