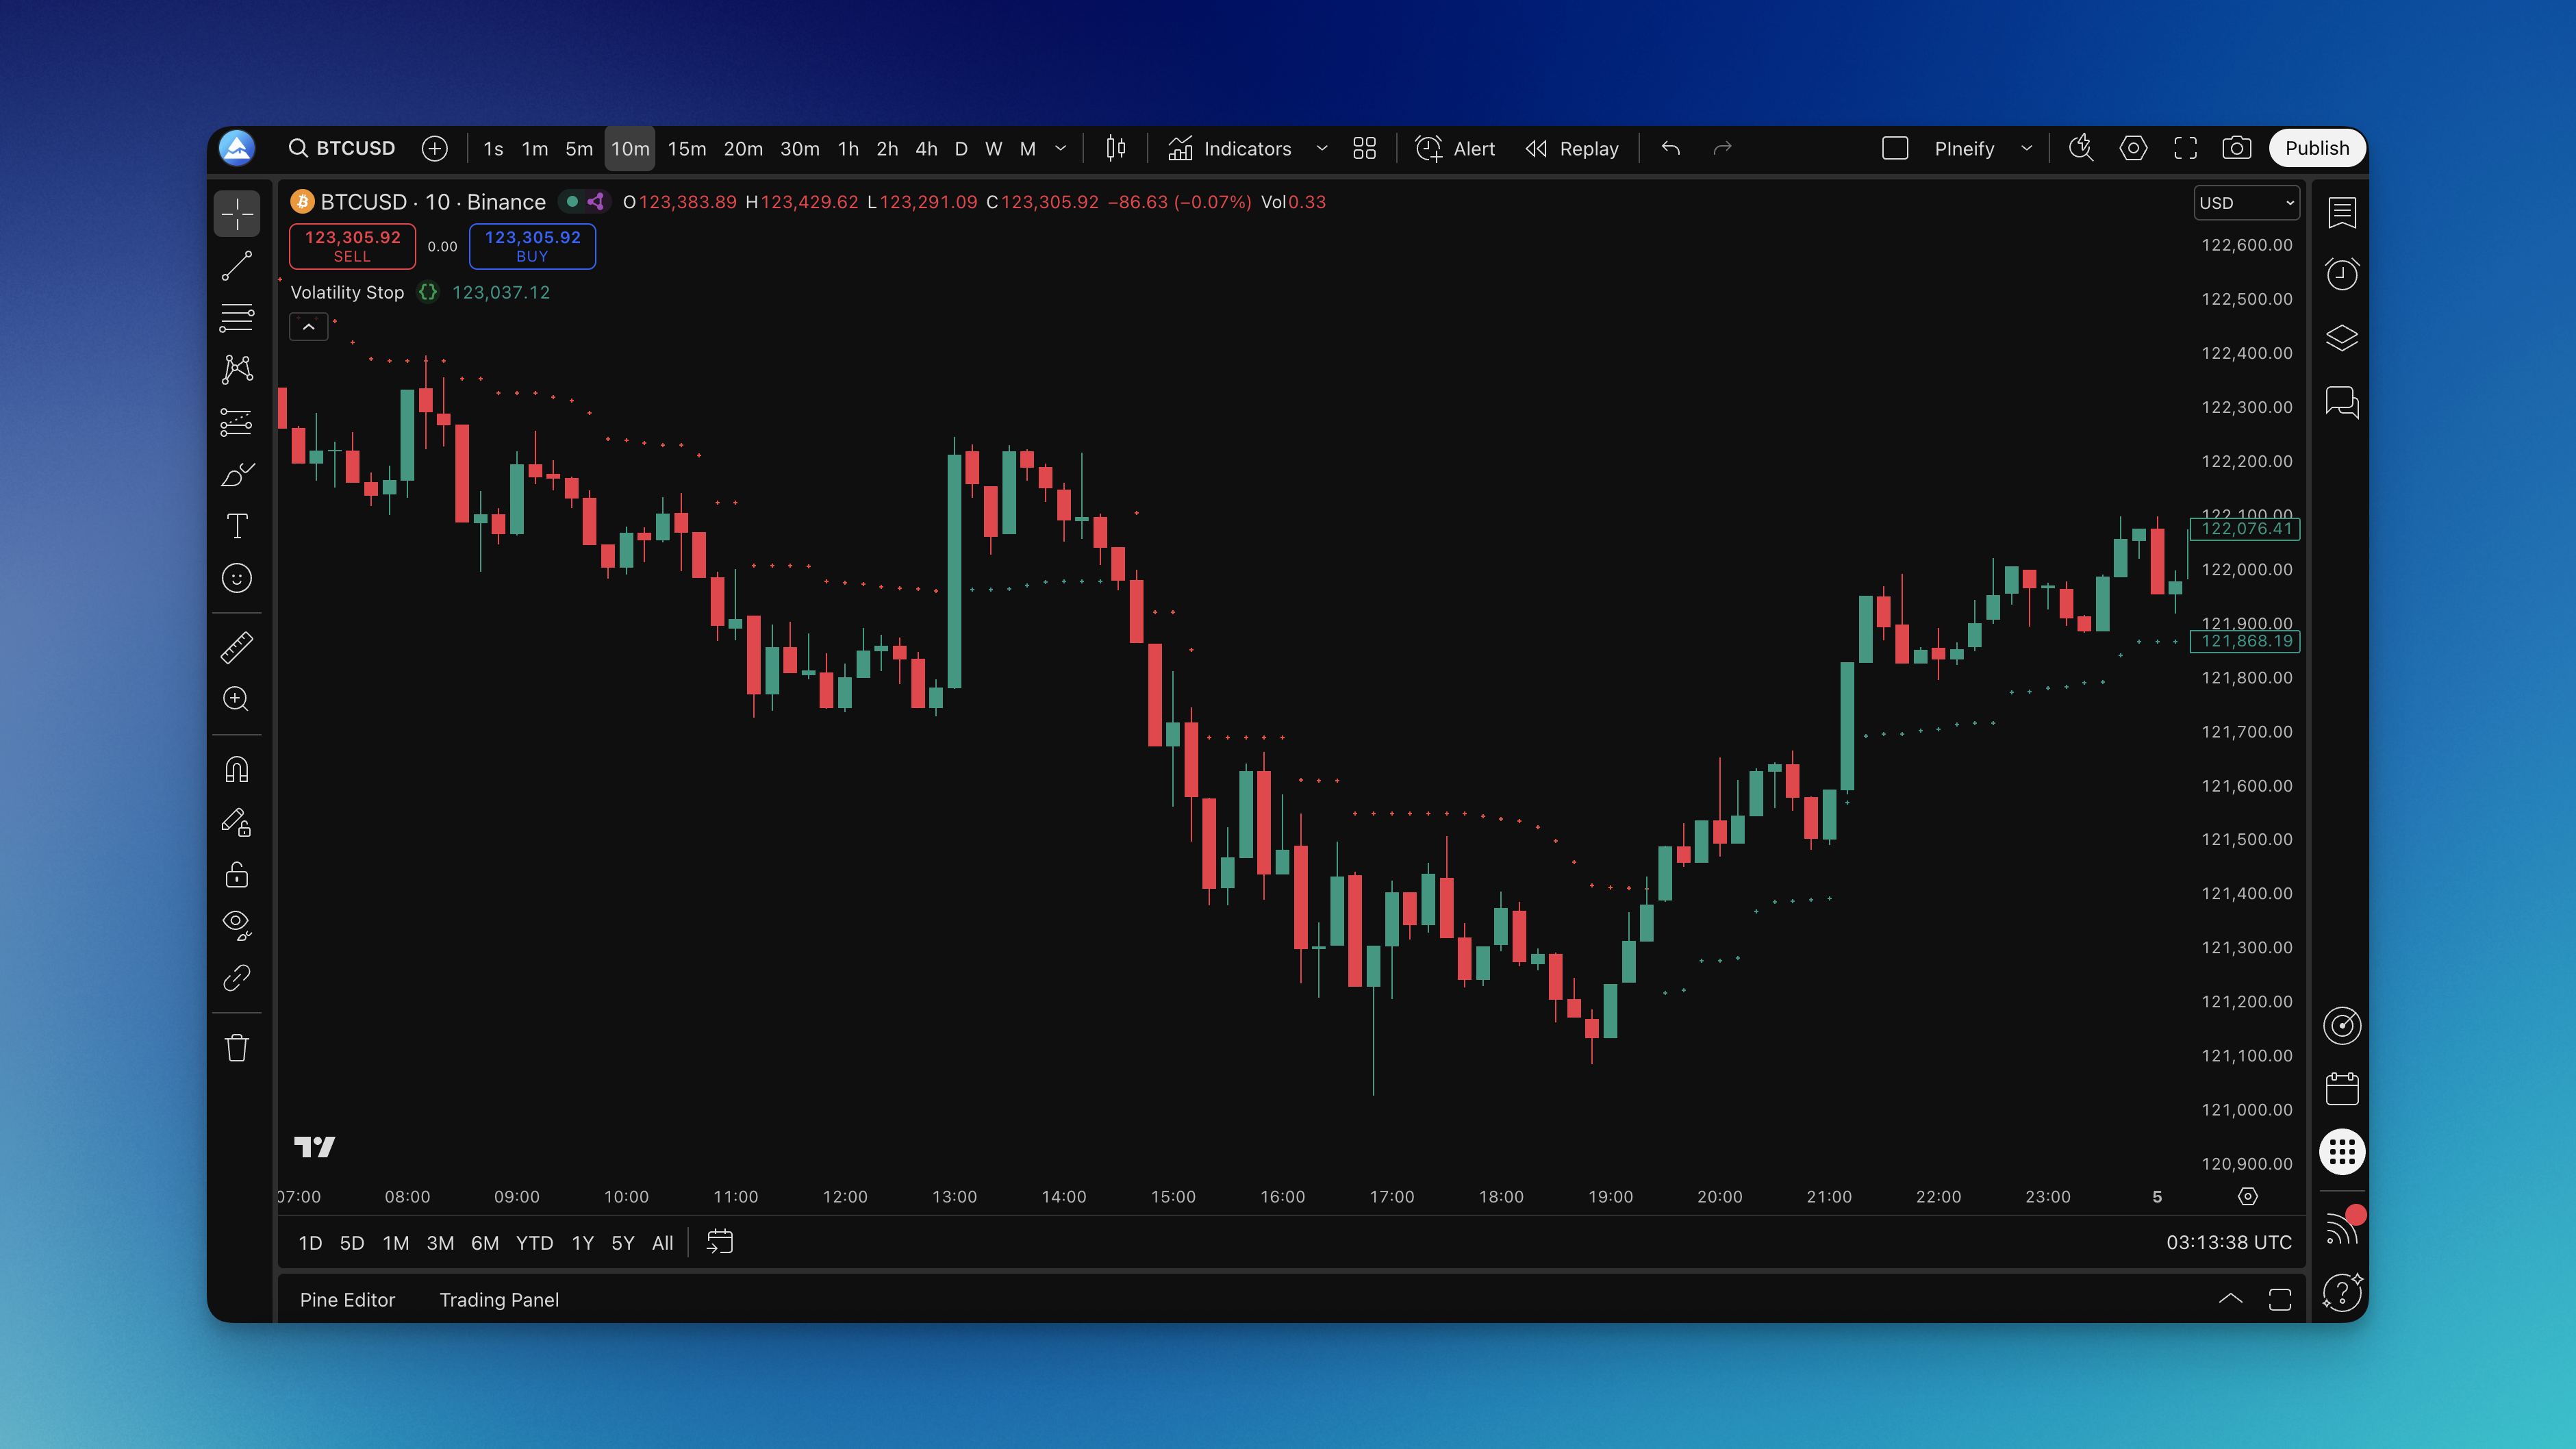
Volatility Stop Indicator TradingView: Dynamic ATR Stop Loss Strategy
The Volatility Stop indicator is an ATR-based dynamic stop loss for TradingView that expands and contracts with market conditions. Instead of a fixed percentage that ignores what's actually happening, it reads the market's pulse through Average True Range and positions your stop accordingly.
I ran this on AAPL daily charts from January to June 2024 using the default 20-period ATR with a 2.0 multiplier. The stop survived the March 5th volatility spike — a day where AAPL dropped 2.8% intraday — without triggering. A fixed 2% stop would have knocked me out. Price recovered and rallied another 7% over the next three weeks. That's the difference between dynamic and static.
On NVDA I've settled on a 24-period ATR with a 2.5 multiplier since September 2023. NVDA moves sharper than most tickers, and the tighter 2.0 multiplier kept giving me premature exits during post-earnings gaps. The wider setting fixed that. But I haven't tested it on low-volatility pairs like EURGBP, and I suspect the wider stops would be overkill there.
How the ATR Stop Level Works
The math is straightforward:
- Uptrend:
stop = price - (ATR x multiplier)— the stop sits below price, rising with it - Downtrend:
stop = price + (ATR x multiplier)— the stop sits above price, dropping with it
When price crosses the stop line, the trend flips and the line repositions to the opposite side. That cross acts as both a trend change signal and a new stop placement.
Two things show up on your chart:
- A colored line tracking the current stop level
- Color changes — green below price means uptrend, red above means downtrend
The indicator recalculates every bar. During volatile sessions the ATR expands, pushing the stop further from price. During quiet stretches it contracts, tightening the stop. No manual adjustments needed.
Getting It on Your Chart
Setting this up takes a few minutes:
- Open your TradingView chart and go to the Pine Editor
- Paste the Pine Script code for the Volatility Stop indicator
- Set your ATR period and multiplier in the indicator settings
- Save and apply to your chart
If you're using Pineify to generate the script, you skip the coding entirely — pick the Volatility Stop template, adjust the parameters in the visual editor, and copy the output. Want to try a 14-period ATR instead of 20? Change it in the interface and regenerate. No syntax debugging required.
Reading the Signals in Practice
Trend Direction at a Glance
- Green line below price: uptrend active, the stop acts as a rising floor
- Red line above price: downtrend active, the stop acts as a falling ceiling
Entry Points
- Go long when price crosses above a red line and it flips green
- Go short when price crosses below a green line and it turns red
- If you missed the initial break, wait for a pullback to the line — chasing entries on this indicator leads to bad fills
This pairs well with other swing trading indicators that confirm the trend before you commit capital.
Exit Points
- Longs: exit when price breaks below the green stop line
- Shorts: exit when price breaks above the red stop line
- Trailing moves automatically — as price rises in an uptrend, the stop follows, locking in gains while giving the trend room
Settings Reference
| Trading Style | ATR Period | ATR Multiplier | Timeframe |
|---|---|---|---|
| Day trading | 14 | 1.5-2.0 | 5-15 min |
| Swing trading | 20-30 | 2.0-3.0 | Daily |
| Position trading | 30-50 | 3.0-4.0 | Weekly |
| High volatility (earnings, Fed) | 20 | 2.5-4.0 | Any |
| Low volatility (summer doldrums) | 20 | 1.5-2.0 | Any |
On my TSLA day trades using 15-minute charts, I run ATR 14 with a 1.5 multiplier. TSLA moves fast enough that the 2.0 multiplier gives back too much profit on intraday pullbacks. For MSTR swing trades on daily charts, I bump it to ATR 24 with a 3.0 multiplier — that stock can swing 5% in a session and I don't want to get shaken out.
Testing Before You Commit Real Money
Backtesting this indicator is straightforward if you keep it honest.
The System
- Entry: price crosses the Volatility Stop line and the color flips
- Exit: price crosses back through the line the other way
- Position size: 1-2% risk per trade max
- The stop line IS your stop
The Process
- Define your rules in advance. Long when price breaks above red. Short when it breaks below green.
- Pick a timeframe. Daily for swings, hourly for day trades.
- Test across different market conditions. I ran mine from 2019 through 2024 to cover bull, bear, and sideways regimes.
- Track what matters: win rate, average win vs average loss, max drawdown, profit factor.
- Don't optimize for past data. If you find yourself tuning settings to make the backtest look better, you're curve-fitting.
I used Pineify to backtest different settings against NVDA data. Testing a 14-period ATR against a 24-period on the same date range took about two minutes per run. The 24-period won on profit factor (1.8 vs 1.4) but had a lower win rate (38% vs 44%). That trade-off — fewer wins, bigger wins — is worth understanding before you pick a setting.
Metrics That Matter
- Profit factor: target 1.5 or higher
- Max drawdown: keep under 20%
- Win rate: anything above 35% can work if your winners outsize your losers
- Average trade duration: tells you if this fits your schedule
A strategy that only works in bull markets isn't a strategy. Test the volatility stop through a bear phase or a range-bound period to see how it behaves when conditions aren't favorable.
Knowing When It Won't Work
The Volatility Stop performs best in trending markets — sustained moves where price has a clear direction. It struggles in choppy, range-bound conditions where price keeps crossing the stop line back and forth. That whipsaw effect turns profitable setups into a string of small losses.
I learned this the hard way on XAUUSD in September 2024. The market was grinding sideways with no breakout in sight. The stop flipped direction six times over two weeks. Every flip was a scratch or a small loss. After the third false signal I should have stepped back, but I kept tweaking the multiplier looking for magic that wasn't there.
If you see price crossing the stop repeatedly without follow-through, disable the indicator and wait for a clear trend before using it as your primary exit.
Questions People Ask
▶What is the Volatility Stop indicator in TradingView?
The Volatility Stop is an ATR-based dynamic stop loss indicator for TradingView that automatically adjusts your stop level based on current market volatility. Instead of a fixed percentage, it uses the Average True Range (ATR) to set stops wider during high-volatility periods and tighter during calm markets. A colored line on the chart tracks the stop level — green below price signals an uptrend, red above price signals a downtrend.
▶How does the Volatility Stop indicator calculate its stop levels?
The indicator calculates stop levels by multiplying the ATR (Average True Range) over a specified period by a user-defined multiplier. In an uptrend, the stop is placed below price at: stop = price - (ATR x multiplier). In a downtrend, it flips above price. When price crosses the stop line, the trend direction switches and the line repositions on the other side. This adaptive math is what makes it smarter than a fixed percentage stop.
▶What are the best Volatility Stop settings for swing trading on TradingView?
For swing trading on daily charts, an ATR period of 20-30 and a multiplier of 2.0-3.0 works well for most markets. These settings smooth out intraday noise while still reacting to meaningful trend changes. If you find you're getting stopped out frequently, increase the multiplier slightly. If stops feel too loose and you're giving back too much profit, reduce the ATR period.
▶What is the difference between the Volatility Stop and a regular trailing stop?
A regular trailing stop follows price by a fixed amount (e.g., always 2% below price). The Volatility Stop trailing stop adjusts its distance based on how much the market is actually moving — measured by ATR. During volatile periods it trails further away to avoid noise-driven exits; during calm periods it stays tighter to lock in gains. This makes it far less likely to trigger premature exits during normal market fluctuations.
▶Does the Volatility Stop indicator work for day trading?
Yes, but you need to adjust the settings for shorter timeframes. On 5-15 minute charts, use a shorter ATR period (7-14) and a lower multiplier (1.5-2.0) so the indicator responds quickly enough to intraday price moves. On very short timeframes the stop level updates every bar, giving you responsive protection without waiting for end-of-day data.
▶When should I avoid using the Volatility Stop indicator?
Avoid relying on the Volatility Stop during choppy, sideways markets with no clear directional trend. In range-bound conditions the indicator will flip direction repeatedly, generating false signals and triggering unnecessary exits. It performs best in trending markets. If price keeps crossing back and forth through the stop line, it's a signal to wait for a stronger trend before using it as your primary exit tool.
▶How do I add a custom Volatility Stop Pine Script to TradingView without coding?
Use Pineify's no-code indicator builder: open the platform, search for the Volatility Stop template, set your desired ATR period and multiplier, then click generate. Pineify outputs clean Pine Script code automatically. Copy the code, open TradingView's Pine Editor, paste and save, then apply it to any chart. This lets you customize the indicator settings and regenerate code instantly without writing Pine Script by hand.
