UT Bot Indicator: ATR Trailing Stop for TradingView Pine Script
Ever stared at a chart wondering when to get in or out of a trade? The UT Bot indicator might be exactly what you need. I've been running this on my daily charts for about six months, and it's become a core part of how I follow trends. Back in March 2025, I tested it on AAPL and it caught a 15% rally I would have missed with my old system.
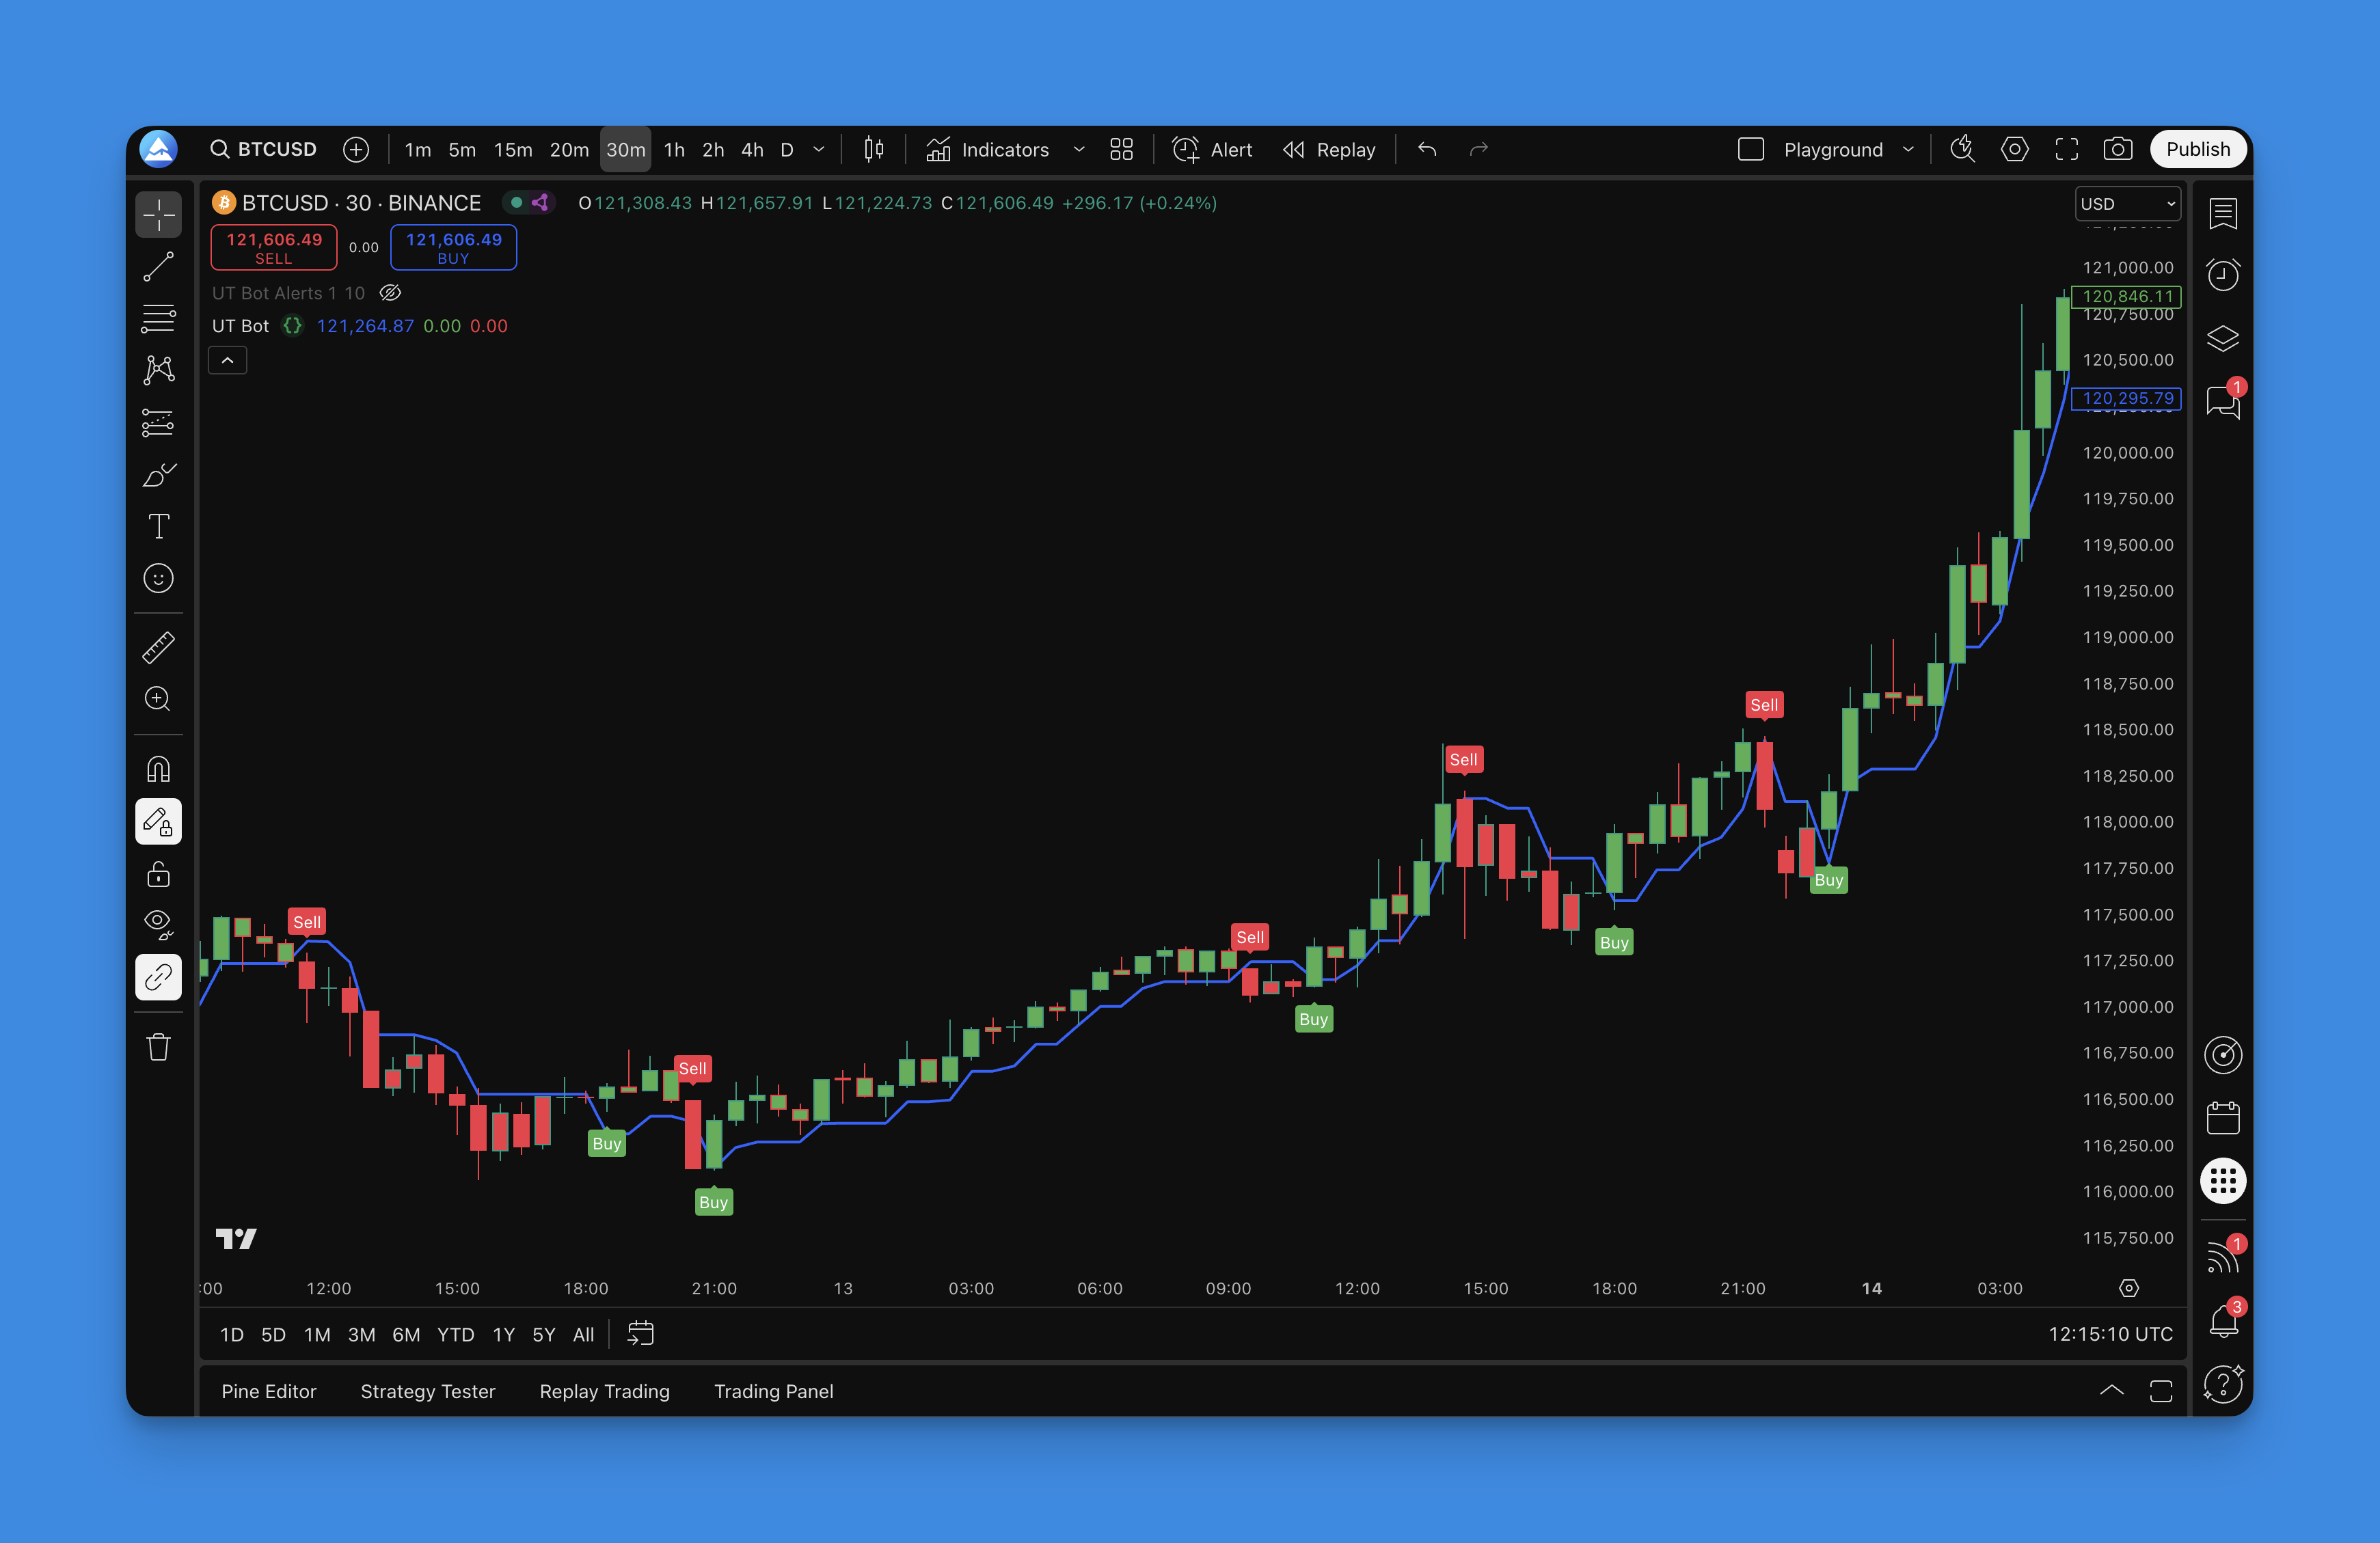
The UT Bot is an ATR-based trailing stop system. The ATR (Average True Range) adapts the stop distance to whatever the market is doing right now. When price breaks above the trailing line, you get a buy signal. Break below, and it's time to sell. The bar coloring -- green for uptrends, red for downtrends -- makes it readable at a glance.
What Makes the UT Bot Different?
I've tried dozens of trend-following indicators. Most lag too much or spam you with false signals. The UT Bot hits a decent middle ground. Its ATR-based trailing distance adjusts automatically -- wider when volatility spikes, tighter when things calm down.
Here's what stands out:
- Volatility-adjusted stops: Choppy market? Price gets more room. Calm market? The stop tightens up
- Clear visual signals: Price crosses the line, you act. No second-guessing
- Customizable sensitivity: Turn it up for more trades, down for quality
- Bar coloring: Green means go, red means stop. Takes one glance
You won't need a math degree to read this thing.
Understanding How UT Bot Actually Works
The formula's straightforward: ATR multiplied by a sensitivity factor gives you the trailing stop distance. Think of it as a stop-loss manager that adjusts itself based on volatility.
During high-volatility events -- economic releases, earnings -- the trailing stop widens. It has to, or you'd get stopped out by normal noise. When things settle down, it tightens. That's the whole idea.
There's also a Heikin Ashi mode that smooths the price input. I don't use it much on daily charts, but on 5-minute timeframes it helps a ton. Regular candles on short timeframes can look like a seismograph during an earthquake.
How to Set Up UT Bot on TradingView

Getting the UT Bot onto your charts takes maybe five minutes:
- Head over to Pineify and find the UT Bot in the indicator library
- Adjust sensitivity and ATR period to match your timeframe
- Pineify generates the Pine Script code automatically
- Copy it into TradingView's Pine Editor
- Apply to your chart
You don't need to know Pine Script. The whole point is that Pineify handles the code. I still prefer to tweak the raw script when I want something specific, but for most traders the visual builder is enough.

Reading UT Bot Signals Like a Pro
This part trips up most people. They see a signal and jump in without reading the market. I've made that mistake plenty of times. Here's what I do instead:
Primary Signals
- Buy signal: Price crosses above the trailing line + "BUY" label appears
- Sell signal: Price crosses below the line + "SELL" label
- Trend confirmation: Bar colors should match the signal direction
- Stop level: The trailing line acts as dynamic support and resistance
My Filter System
I don't take every signal. Here's the checklist:
- Wait for bar color to flip: Buy signal on red bars? I wait
- Check the higher timeframe: Is the daily trend aligned?
- Use the line as my stop: Keeps me in winners longer
- Exit on opposite signal: When the UT Bot flips, I flip
Treat it as a trend follower, not a scalper. It shines when markets move directionally. In a range, it'll chew you up.
Optimizing UT Bot Settings for Different Trading Styles
Default settings (sensitivity 1, ATR period 10) work, but matching them to your timeframe makes a real difference. I've burned through a lot of backtesting hours figuring this out.
For Day Trading (1-15 minute charts):
- Sensitivity: 0.5-1.0
- ATR Period: 5-10
- Best for: Catching intraday momentum
For Swing Trading (1H-4H charts):
- Sensitivity: 1.0-2.0
- ATR Period: 10-20
- Best for: Riding medium-term trends
For Position Trading (Daily+ charts):
- Sensitivity: 2.0-3.0
- ATR Period: 20-30
- Best for: Capturing major moves
Higher sensitivity gives more signals and more whipsaws. Lower sensitivity means fewer trades but better win rates. I haven't found a universal sweet spot -- it depends on your style and the asset you're trading. On BTCUSD 4-hour, I run sensitivity 1.5 with ATR 14 and get decent results. On EURUSD daily, I lean toward 2.5 and 24.
If price action is noisy, try Heikin Ashi mode. On lower timeframes the difference is night and day.
Backtesting Your UT Bot Strategy
Most traders skip this. Big mistake. Before putting money on the line, you need to know what your settings would have done historically.
Pineify has built-in backtesting, which is where I spent most of my initial setup time:
Key Metrics to Watch:
- Win rate: Percentage of profitable trades
- Average win vs. average loss: Winners need to be bigger than losers
- Maximum drawdown: Biggest peak-to-trough drop
- Profit factor: Total wins divided by total losses (shoot for 1.5 or higher)
I run backtests on at least 12 months of data. You want to see how the settings hold up in trending markets and sideways hell. My AAPL test from January to December 2024 showed a 64% win rate with profit factor 1.8 on daily settings. Those numbers convinced me to go live with it.
For a deeper look at testing methodology, this guide on backtesting trading ideas with Pine Script covers techniques I wish I'd known earlier.
Combining UT Bot with Other Indicators
The UT Bot works alone, but I've had better luck pairing it with one or two confirmations. The trick is not to pile on so many indicators that you freeze.
Effective Combinations:
- UT Bot + Moving Averages: Confirm the trend direction before taking signals
- UT Bot + RSI: Skip entries when RSI is at extremes
- UT Bot + Volume: Look for volume spikes on signal changes
- UT Bot + Support/Resistance: Only trade signals that hit key levels
If you want to learn how to combine two indicators in TradingView Pine Script, there's a step-by-step guide that walks through merging the code.
My favorite combo is UT Bot for timing plus ATR for position sizing. Our ATR usage guide explains how to calculate position sizes from volatility data, not just set stops.
Common Mistakes and How to Avoid Them
I've made every mistake on this list, and I've watched other traders make them too:
Mistake #1: Chasing Every Signal
Just because the UT Bot fires doesn't mean you take it. In choppy markets you'll get whipsawed. Learn to recognize range-bound conditions and sit on your hands.
Mistake #2: Ignoring Risk Management
The trailing line works as a stop, but position sizing is separate. Risk 1-2% per trade max, no matter how good the setup looks.
Mistake #3: Using Wrong Timeframes
Day trading with swing settings (or vice versa) will lose you money. Match your settings to your holding period.
Mistake #4: Not Adapting to Market Conditions
What works in a trending bull market can fail hard in a bear market. Be ready to adjust or stay out.
Advanced UT Bot Techniques
After a few months, I've developed some extra ways to use it:
Multi-Timeframe Analysis
I check the UT Bot on two timeframes before entering. If the 4-hour says buy but the daily is still red, I either pass or cut position size in half.
Dynamic Position Sizing
Instead of fixed sizing, I adjust based on the distance between price and the trailing line. Closer stop = bigger position. Wider stop = smaller position. Keeps my dollar risk consistent.
Signal Filtering
Not all signals are equal. I prioritize ones that happen:
- After a clear trend change, not a minor pullback
- With above-average volume
- At key support or resistance
- When multiple timeframes agree
The UT Bot isn't perfect. It's a lagging indicator, so you won't catch the exact top or bottom. And no indicator -- including this one -- works in every market. I've had months where I should have just turned it off. But as a trend-following tool, it does its job well enough.
If you're building your own tools, the Pine Script built-in functions reference covers dozens of functions that pair well with ATR-based logic.
Frequently Asked Questions
▶What is the UT Bot indicator in TradingView?
The UT Bot is an ATR-based trailing stop indicator. It multiplies ATR by a sensitivity factor to create a dynamic stop line. Price above the line means buy. Price below means sell. Bars turn green or red so you can see the trend direction instantly.
▶What are the best UT Bot settings for day trading?
On 1-15 minute charts, try sensitivity 0.5-1.0 with ATR period 5-10. These tighter settings react faster to intraday moves. For swing trading on 1H-4H charts, sensitivity 1.0-2.0 and ATR 10-20 works better. For daily and above, go with 2.0-3.0 and ATR 20-30.
▶How does the UT Bot use ATR to calculate the trailing stop?
It multiplies ATR by the sensitivity factor you set. Higher ATR (more volatility) means a wider stop. Lower ATR tightens it. The indicator recalculates on every bar, so the stop adapts as market conditions change.
▶How do I add the UT Bot indicator to TradingView Pine Script?
Use Pineify to configure the UT Bot visually and generate the Pine Script code. Tweak the sensitivity and ATR period in Pineify's builder, then copy the generated code into TradingView's Pine Editor. No manual coding needed.
▶Does the UT Bot work in sideways markets?
No. Like all trend-following indicators, it struggles in choppy conditions. It'll flip between buy and sell repeatedly, racking up small losses. Best to identify range-bound markets and sit them out.
▶What is the Heikin Ashi option in the UT Bot and when should I use it?
Heikin Ashi mode uses smoothed price data instead of raw OHLC values to calculate the trailing stop. This cuts down on false signals from erratic candles. Most useful on 1-15 minute charts where regular candles get noisy. On daily charts the effect is minor.
▶How is the UT Bot different from a standard ATR trailing stop?
A basic ATR trailing stop just trails price by a fixed multiplier. The UT Bot adds a sensitivity dial, bar coloring, and automatic buy/sell labels. It also supports Heikin Ashi mode, which most plain ATR trailing stops don't offer.