Heikin Ashi Smoothed: Reduce Noise & Follow Trends
You know how sometimes when you're looking at a price chart, it's just... messy? All those crazy candles jumping up and down, making it super hard to tell if the price is actually going up or down? I've been there too.
Last November I was staring at TSLA daily charts and couldn't tell if the pullback was a reversal or just another fakeout. That's when I finally gave Heikin Ashi Smoothed a real shot.
What Exactly is Heikin Ashi Smoothed and Why Should You Care?

Heikin Ashi is a candlestick modification that calculates each bar from averages of the prior bar's values. HA-Close = (O+H+L+C)/4, HA-Open = (prev HA-Open + prev HA-Close)/2, HA-High = max of the period's highs, HA-Low = min of the period's lows. The "smoothed" version runs those averaged values through a second filter, usually an EMA or SMA.
Think of it like this: if regular candlesticks are like examining a bumpy road up close, Heikin Ashi is like stepping back and seeing the hill's general direction. The smoothed version adds another lens — everything becomes even clearer.
Here's what makes this indicator useful:
Noise Reduction: You can actually see which way the trend is going without getting distracted by every little price wiggle. This is huge for day traders who get whipsawed by false signals.
Trend Clarity: Consecutive green or red candles tell you the trend has real momentum. Less guessing about whether that random spike means anything.
Signal Confirmation: When the colors shift from red to green (or vice versa), it's usually a reliable sign that something significant is happening.
The downside? It's slow to react. Think of your GPS when you take a sudden turn — there's a slight delay before it catches up. But honestly, that lag has saved me from jumping into fake breakouts more times than I can count.
The Problem with Traditional Candlestick Charts
Here's something most trading educators won't tell you: traditional candlesticks can be your worst enemy, especially when you're starting out. Every little market hiccup creates a new pattern that looks "important" but is really just noise.
I remember staring at my charts for hours, seeing what looked like perfect candlestick patterns everywhere, only to watch them fail. The market would reverse right after I entered, leaving me scratching my head.
That's where Heikin Ashi Smoothed becomes invaluable. It filters out the noise that causes most retail traders to overtrade and lose money.
How Pineify Makes This Actually Doable
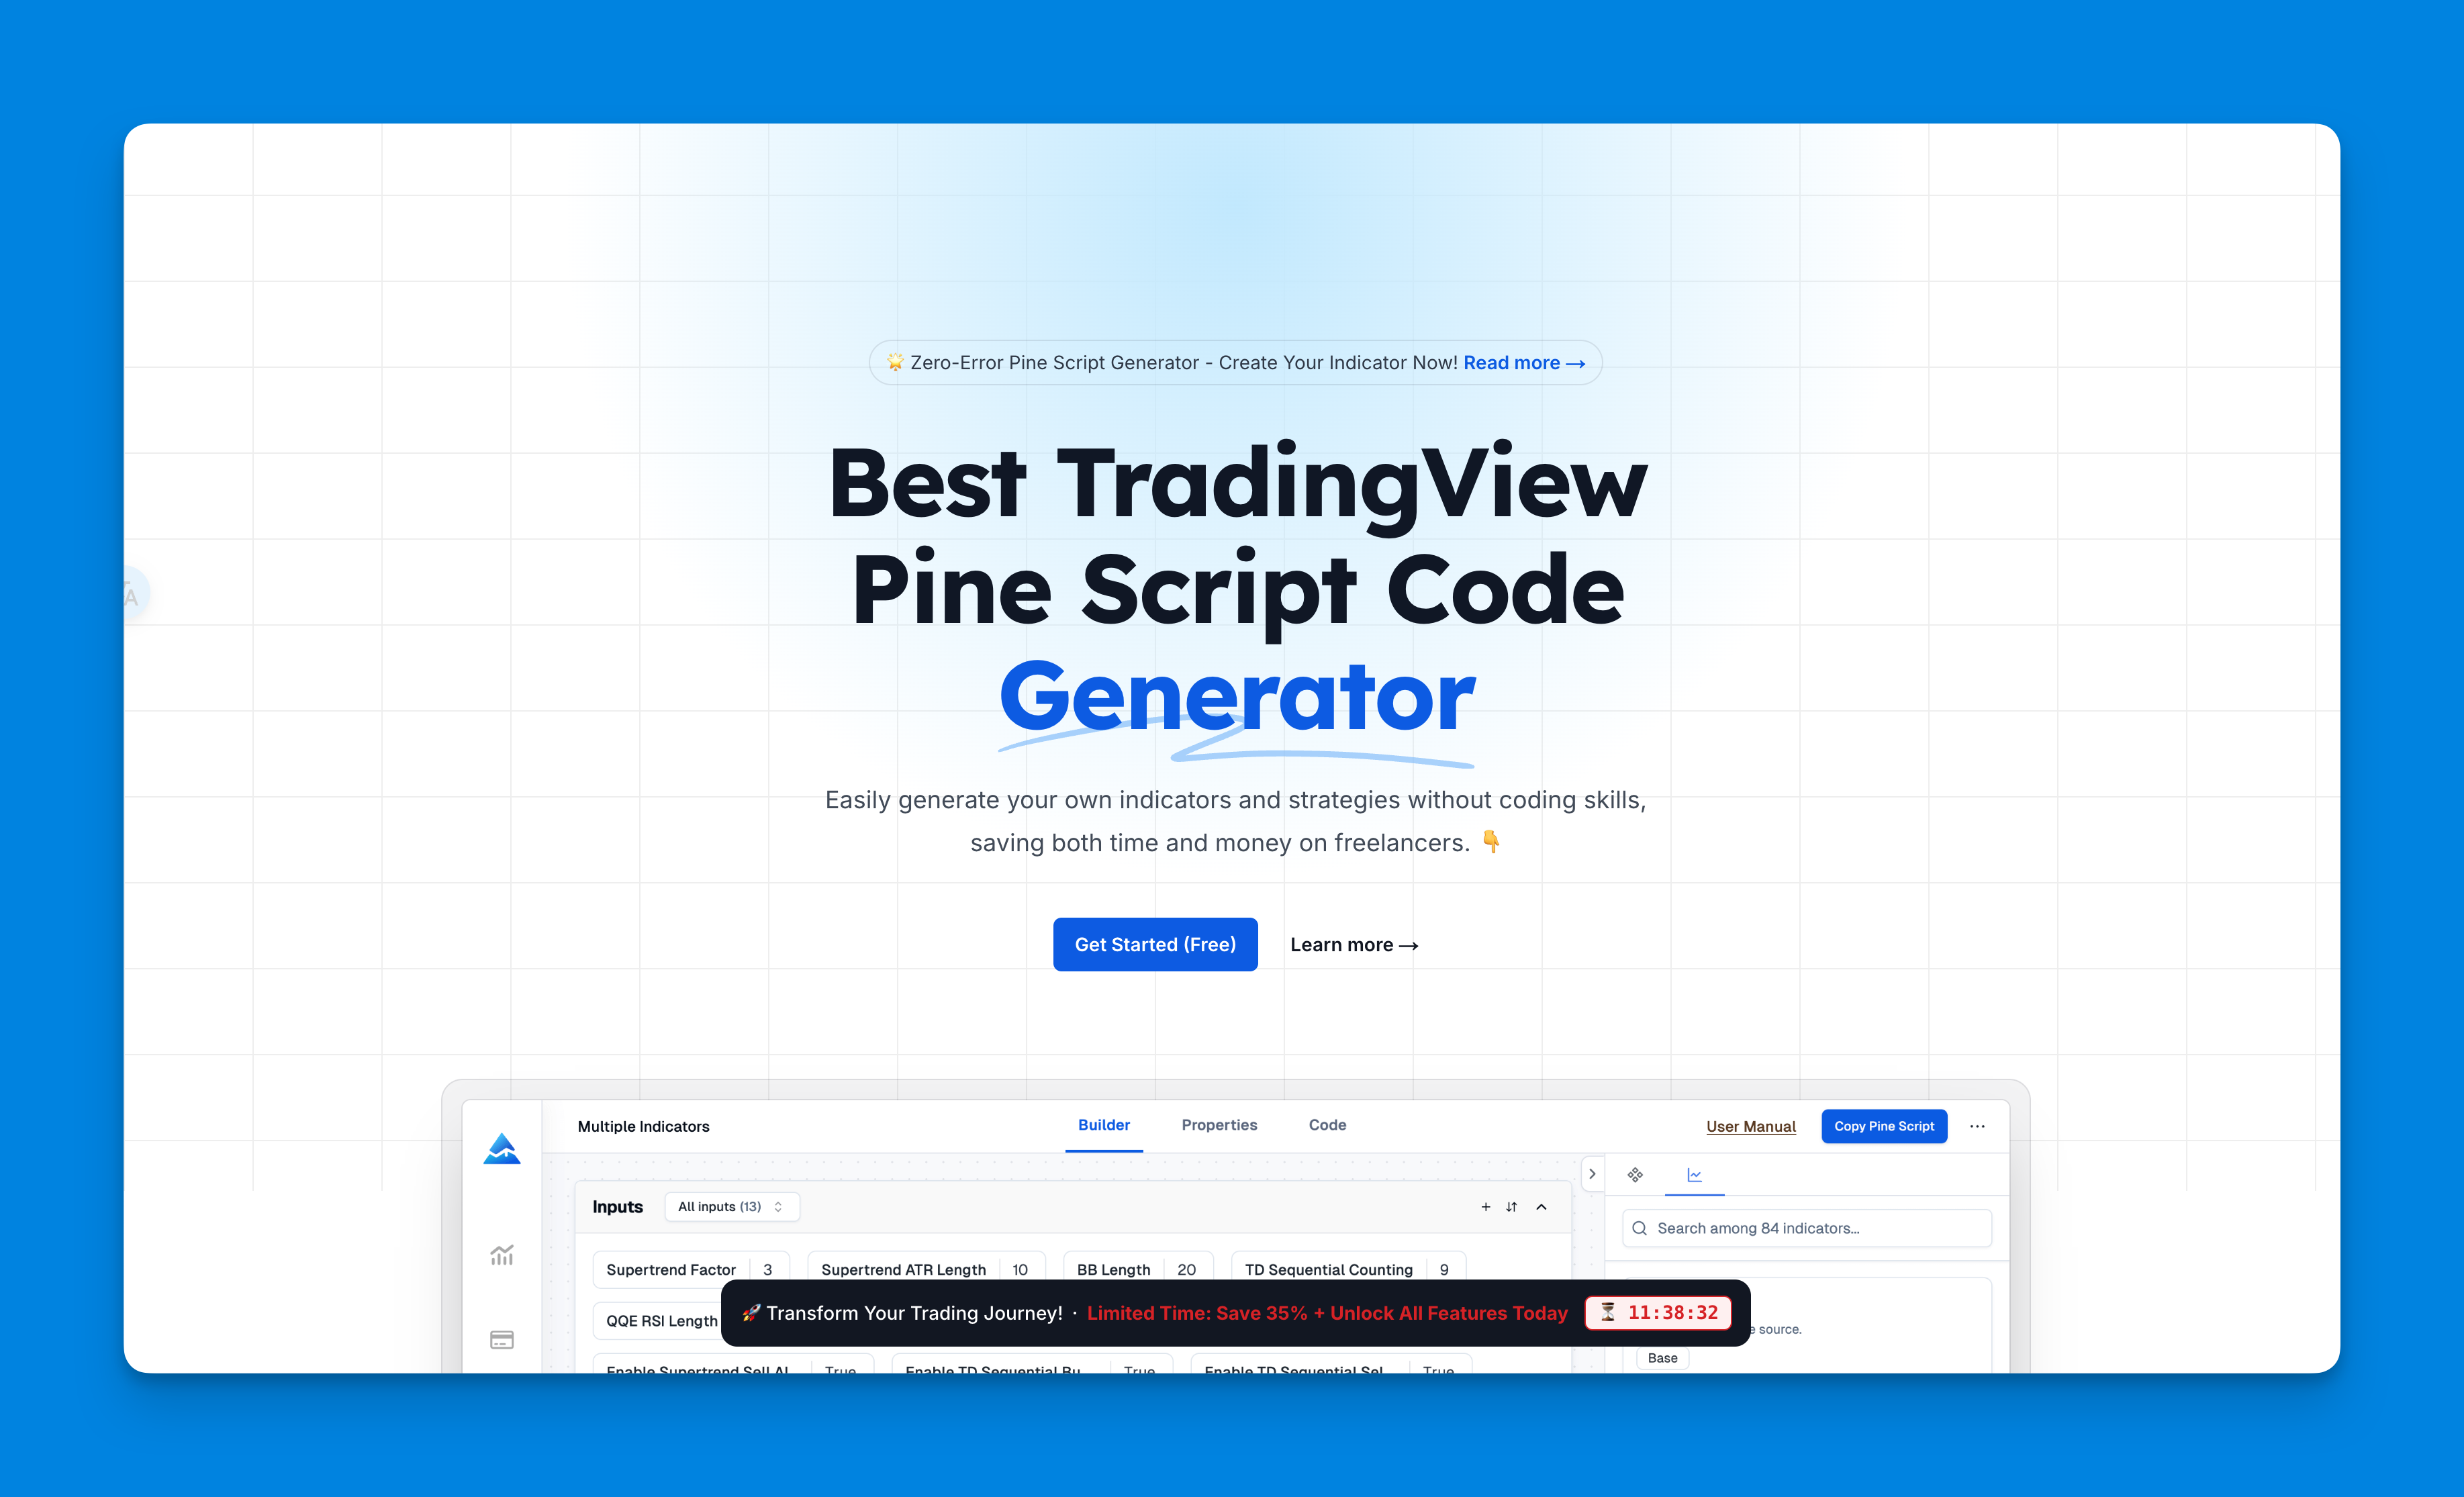
Normally, if you wanted indicators like this on TradingView, you'd either need to know Pine Script (which most of us don't), or you'd be stuck with whatever basic stuff they give you.
Pineify handles the hard part. You point and click to build whatever indicator you want.
What I really like about it:
- Zero coding required: You just edit components. It's like building with digital Lego blocks.
- Unlimited indicators: TradingView caps you at 3 indicators, but Pineify-generated code lets you create as many as you need.
- Backtesting built-in: You can see how your setup would've performed historically before risking real money.
- Professional results: The code it generates is clean and efficient — I haven't found buggy scripts in the output.
If you're serious about creating custom indicators but don't want to spend months learning Pine Script, check out Pine Script v6 examples to see what's possible.
Step-by-Step: Setting Up Your Heikin Ashi Smoothed Indicator
Here's the exact process I use:
Step 1: Access Pineify Head over to Pineify and click "Create." The interface is intuitive — no computer science degree required.
Step 2: Choose Your Foundation Start a new indicator project. You can start from scratch or grab one of their templates. I recommend the template route for beginners — it's faster and less error-prone.
Step 3: Add Heikin Ashi Components Search for "Heikin Ashi" in their component library and add it to your setup.
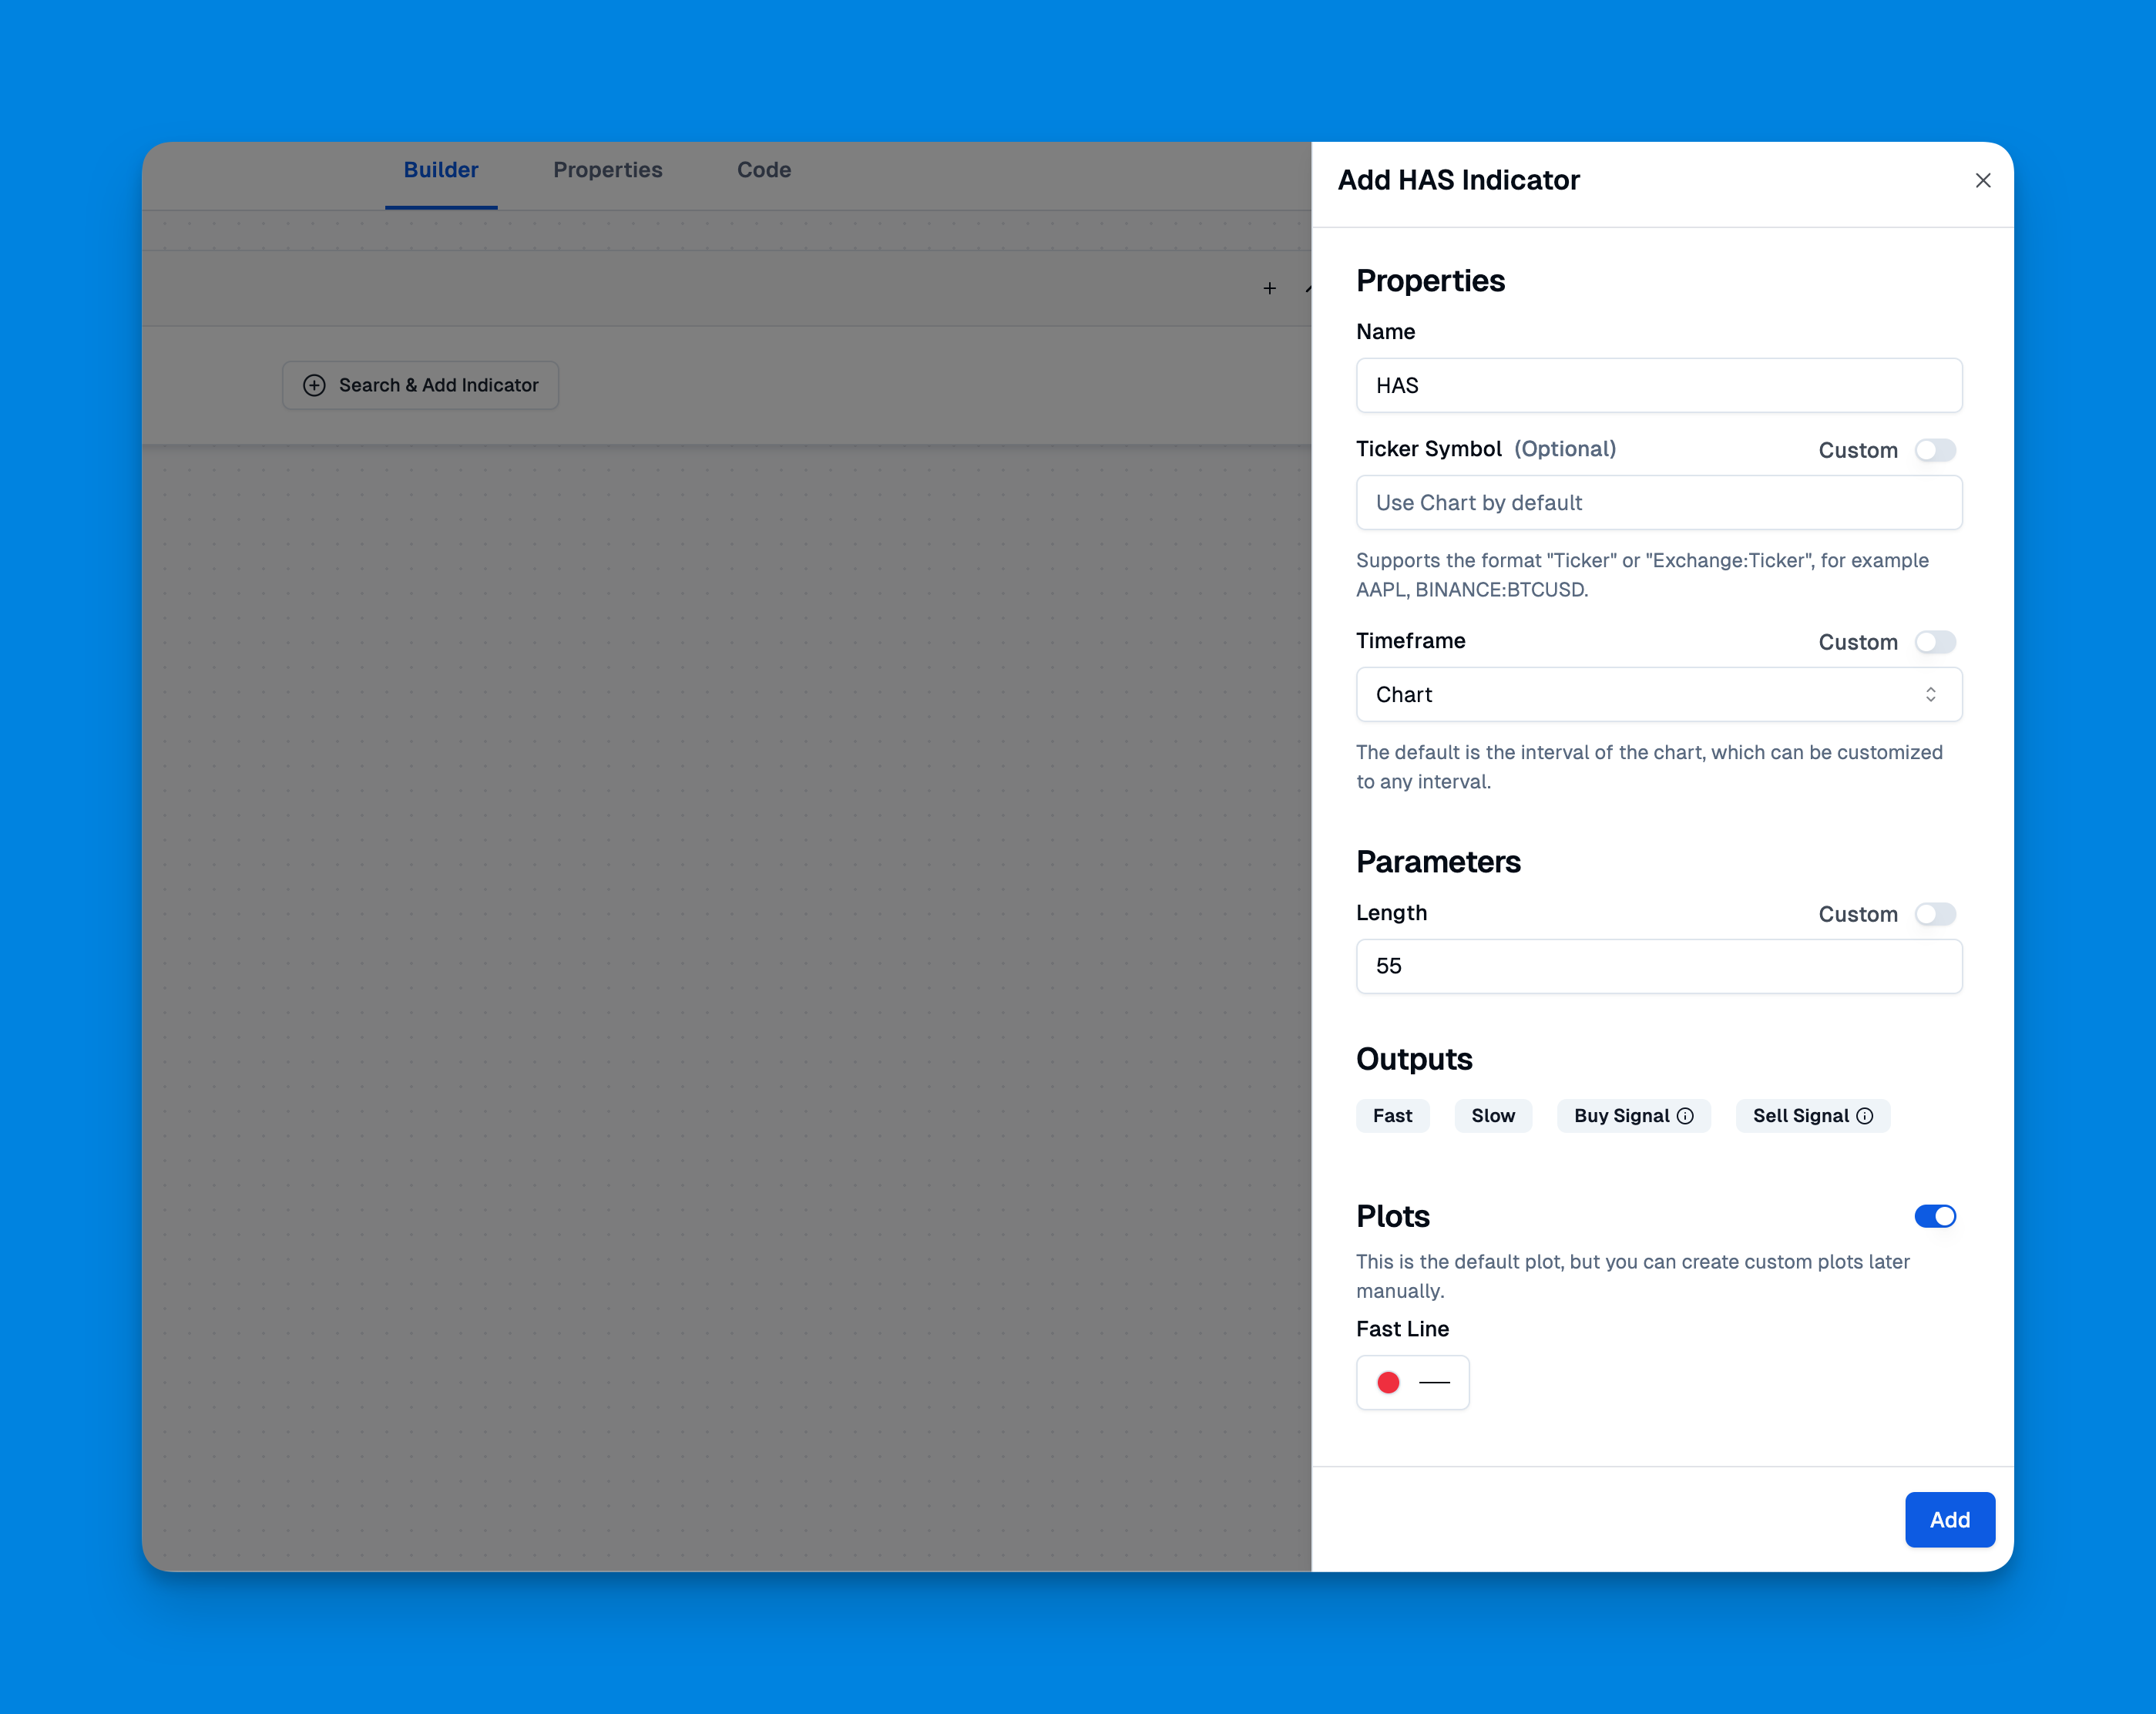
Step 4: Add the Smoothing Layer This is where it gets interesting. Add a moving average component on top of your Heikin Ashi calculation. That creates the "smoothed" effect.
Step 5: Generate and Deploy Hit "Copy Pine Code" and paste it into TradingView's Pine Editor. The code is clean, well-commented, and ready to use.
Want to see all the features Pineify offers? Check out their complete feature guide.
Optimizing Your Settings for Different Trading Styles
The key to making this indicator work is getting the settings right. Here's what I've learned after months of testing:
| Trading Style | Smoothing Period | MA Type | Recommended Timeframe | Why |
|---|---|---|---|---|
| Day Trading | 5-7 bars | EMA | 5min - 1hr | Faster signals for short holds |
| Swing Trading | 14-20 bars | SMA | Daily | Fewer false signals |
| Position Trading | 20-50 bars | SMA or Hull MA | Weekly | Maximum smoothing |
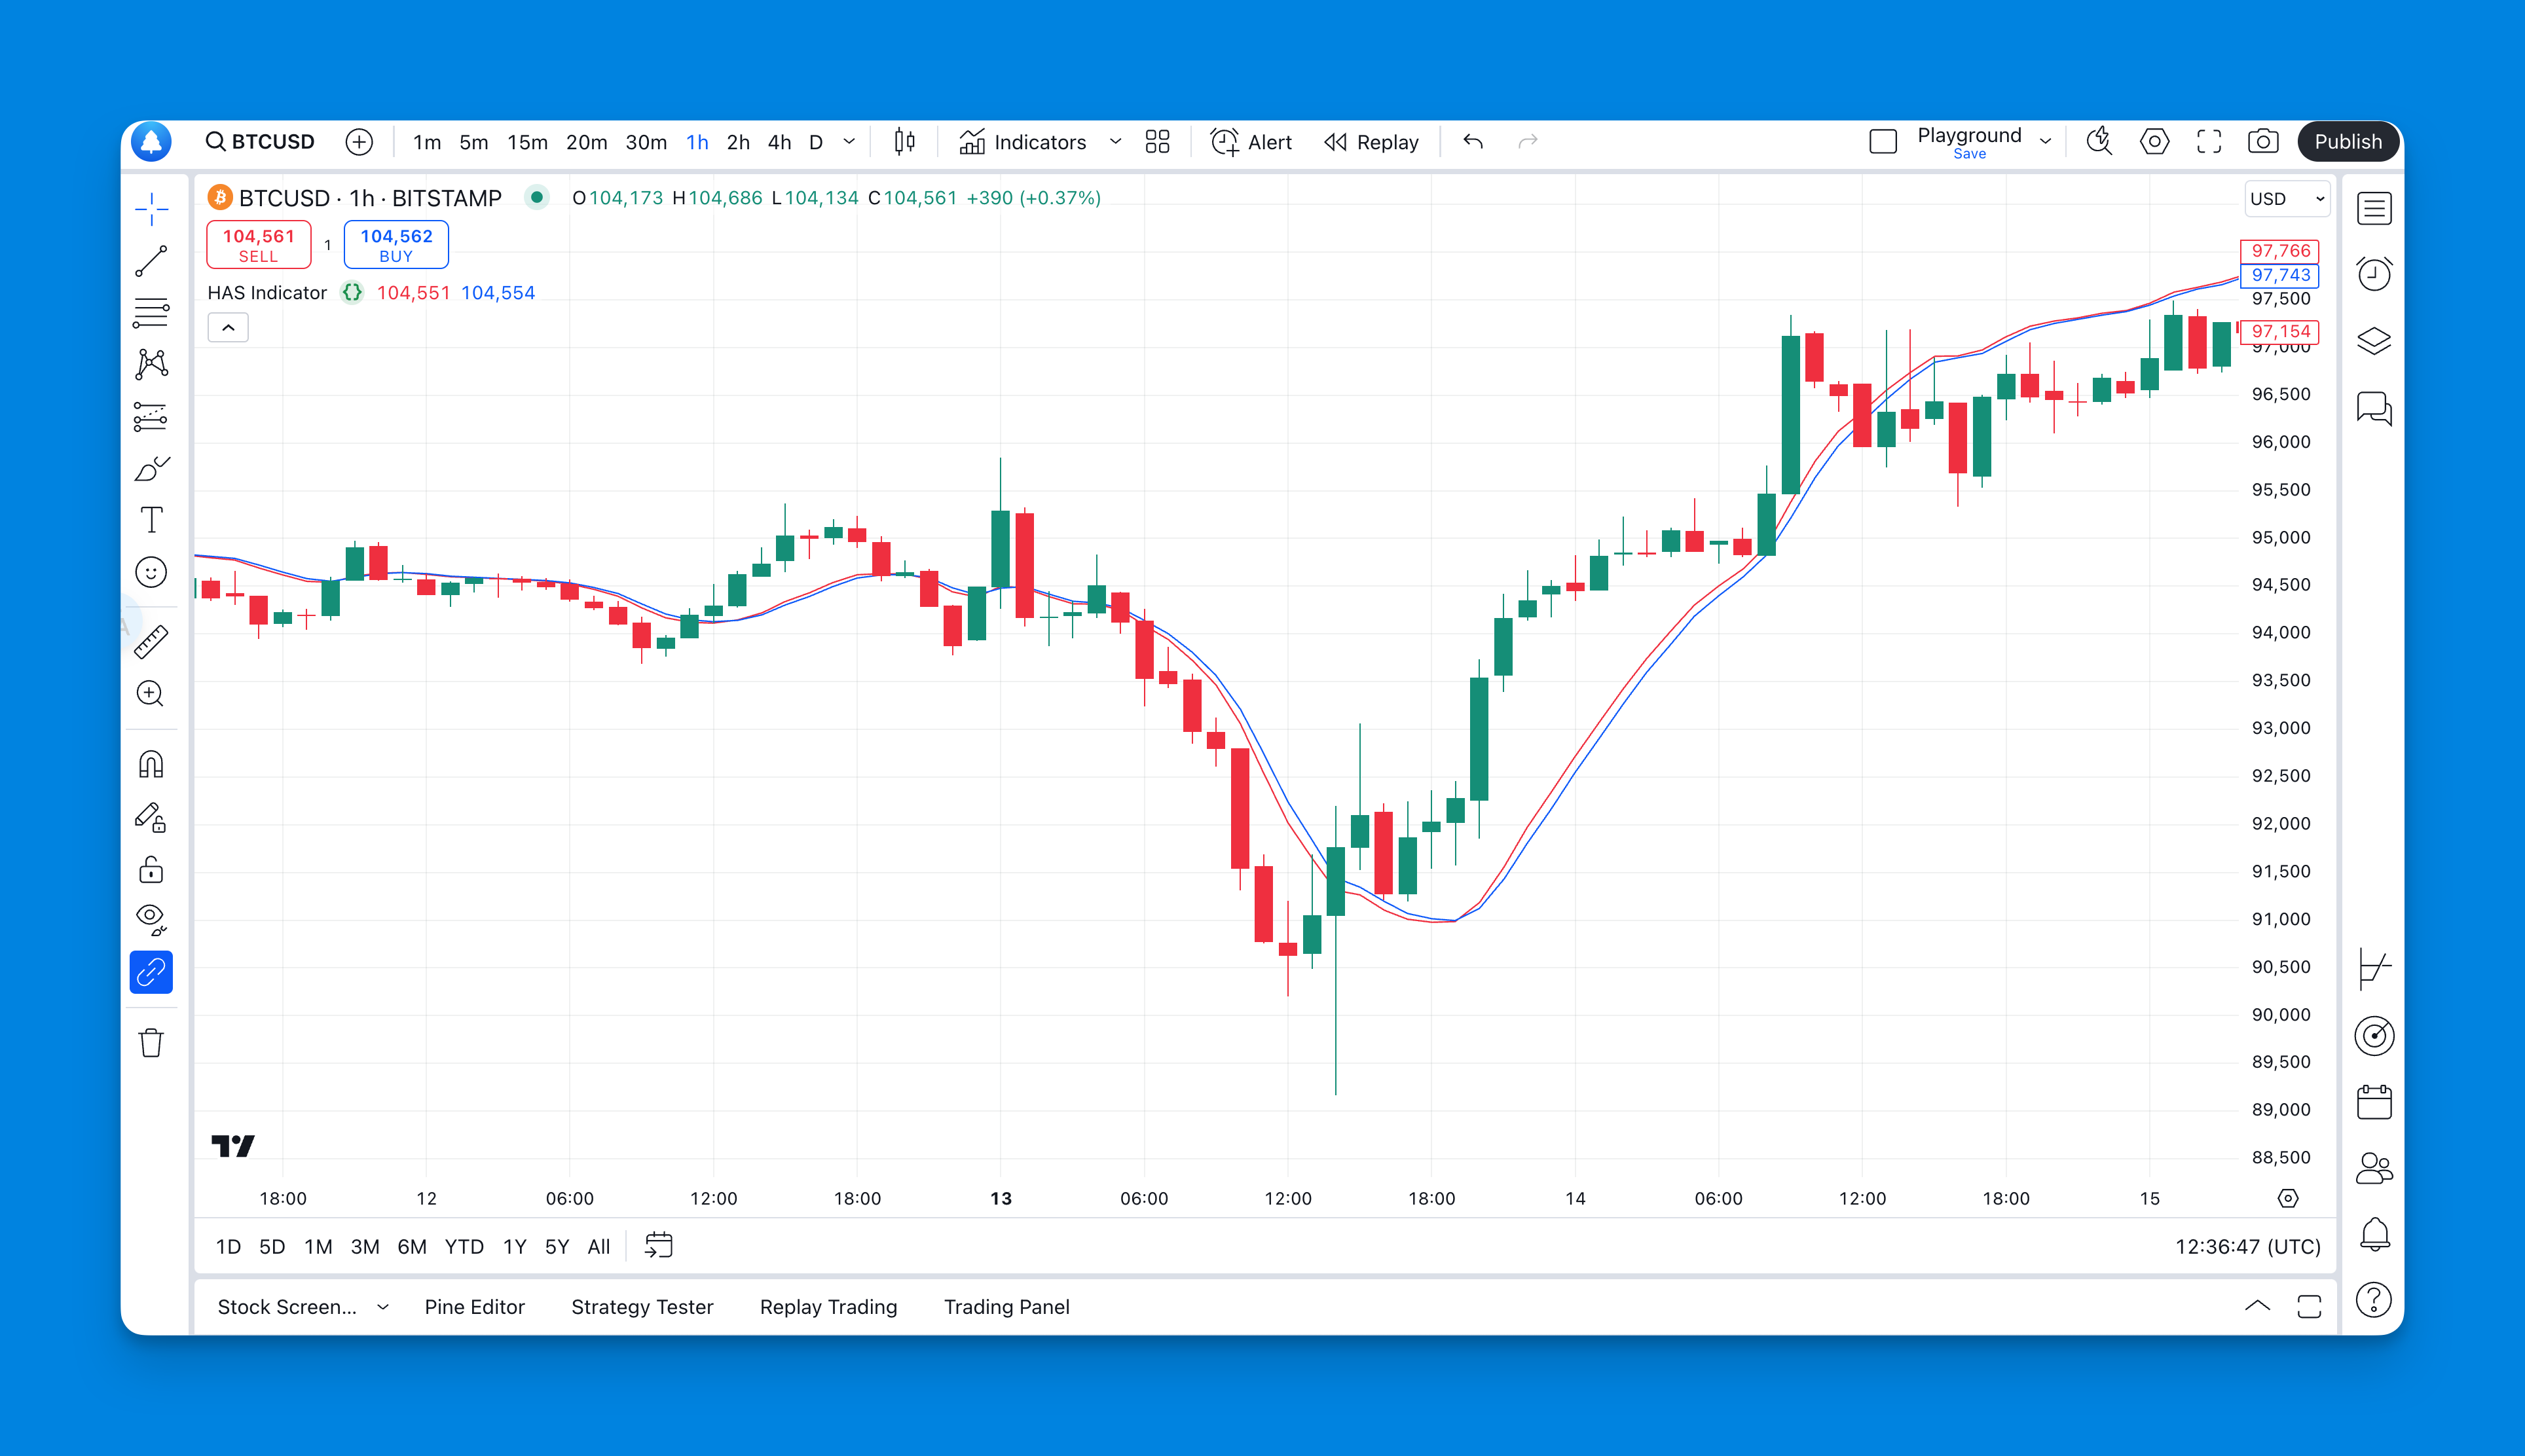
Timeframe Considerations: This indicator works on any timeframe, but I've found it most reliable on daily charts and above. On 1-minute charts, it still gets twitchy despite the smoothing. I tested this on BTC/USD since January and the 1-hour settings caught the February-March rally cleanly, but the 5-minute version kept flipping back and forth.
Real Trading Applications and Entry Strategies
Here's my actual approach (not financial advice — just sharing what has worked for me):
Trend Identification: When you see consecutive green candles, that's usually a reliable uptrend signal. Red candles indicate a downtrend. Heikin Ashi Smoothed rarely gives mixed signals within a trend.
Entry Timing: I wait for the color to flip after it's been the opposite color for several bars. For example, if I see red candles for several days and then green appears, that might be a buy signal. The key is patience — wait for confirmation.
Exit Strategy: I exit when the color flips back to the opposite direction or when I hit my profit target. Don't get greedy. This indicator is great for trend identification, not perfect for timing exact tops and bottoms.
Confirmation with Other Indicators: I never rely solely on Heikin Ashi Smoothed. I combine it with:
- Moving Average ribbons for additional trend confirmation
- RSI to check for overbought or oversold conditions
- Volume analysis to confirm the strength of moves
- Support and resistance levels from price action
Risk Management: Always use stop losses. This indicator is excellent for trend identification, but it's not magic. Set your stops below recent swing lows (for long positions) or above recent swing highs (for short positions).
Advanced Tips and Common Mistakes to Avoid
What Works:
- Combining Heikin Ashi Smoothed with ADX for trend strength
- Using it on higher timeframes for swing trading
- Waiting for multiple consecutive candles of the same color before entering
- Setting alerts for color changes instead of watching charts all day
What Doesn't Work:
- Trying to catch exact tops and bottoms (it's a trend-following tool)
- Using it alone without any confirmation
- Overtrading on every color change
- Ignoring the overall market context
Common Beginner Mistakes:
- Chasing every signal: Not every color change is a good trade. Wait for quality setups.
- Wrong timeframe: Using 1-minute charts and expecting smooth signals.
- No risk management: Thinking the indicator eliminates the need for stops.
- Analysis paralysis: Adding too many indicators and creating conflicting signals.
Why This Actually Works in Real Market Conditions
The reason Heikin Ashi Smoothed is effective isn't some secret formula — it's psychology. Most retail traders get shaken out of good trades by noise. They see a red candle in an uptrend and panic, or they chase every small breakout that turns out to be fake.
This indicator helps you see past the noise and focus on what matters: the underlying trend direction. When institutional money flows into or out of a stock, it shows up clearly on Heikin Ashi Smoothed charts.
I've used this on forex (EUR/USD), crypto (ETH), and stocks (AAPL, MSFT). The principle stays the same: smooth the noise, follow the trend, manage your risk.
Building a Complete Trading System
Heikin Ashi Smoothed works best as part of a broader system. Here's how I structure mine:
1. Market Analysis: Check overall market direction using indices 2. Sector Analysis: Make sure your chosen stocks are in favorable sectors 3. Individual Stock Selection: Use Heikin Ashi Smoothed for trend identification 4. Entry Timing: Wait for EMA crossover signals for precise entry 5. Risk Management: Set stops and position sizes before entering 6. Exit Strategy: Use the indicator for trend changes, but have profit targets too
No indicator is perfect. Heikin Ashi Smoothed handles trend identification and noise reduction well, but it won't time exact entries or catch reversals early. Understand its limits, pair it with proper risk management, and it'll serve you.
▶What is Heikin Ashi Smoothed and how does it differ from regular Heikin Ashi?
Heikin Ashi Smoothed is a charting technique that adds a moving average layer on top of standard Heikin Ashi candles. Regular Heikin Ashi averages OHLC prices to reduce noise, but the smoothed version passes those values through a second moving average — usually an EMA or SMA. You get an even cleaner view of trend direction, at the cost of a bit more lag. I'd say it's like comparing a clean windshield to one that's also been polished.
▶How do I set the smoothing period for Heikin Ashi Smoothed?
It depends on your style. For day trading on 5-minute to 1-hour charts, try 5 to 7 bars with an EMA — you want faster signals. For swing trading on daily charts, I'd go with 14 to 20 bars and an SMA for stability. For long-term position trading on weekly charts, push it to 20 to 50 bars with SMA or Hull MA. More smoothing means fewer signals, but the ones you get tend to be higher quality.
▶Can Heikin Ashi Smoothed be used as a standalone trading signal?
I wouldn't recommend it. It's great at showing trend direction, but I've found it works best when paired with ADX for trend strength, RSI for overbought and oversold levels, and volume analysis. On its own, you'll catch some moves but you'll also act on weak signals more often than you'd like.
▶What are the main limitations of the Heikin Ashi Smoothed indicator?
The biggest one is lag. Two layers of averaging means it reacts slowly to sudden reversals. It's not built for catching exact tops or bottoms — I've tried, and it doesn't work. If you need precise entry timing, look elsewhere. This is a trend-following tool through and through.
▶On which timeframes does Heikin Ashi Smoothed work best?
Daily charts and above, hands down. It'll work on 1-hour charts for intraday swing trades, but I've had mixed results. Below that, even with smoothing, the signals get choppy. I tested it on 5-minute BTC/USD charts and regretted it — too many false flips.
▶How do I use color changes in Heikin Ashi Smoothed for entry and exit signals?
Red to green means a potential buy; green to red means a potential sell or short. But don't jump on the first flip. I wait for two or three consecutive candles of the same color before I act. Even then, I check other indicators before pulling the trigger. Patience filters out the noise.
▶Do I need to know Pine Script to use Heikin Ashi Smoothed on TradingView?
Not anymore. Pineify lets you build this indicator visually — no code required. You add the Heikin Ashi and moving average components through point-and-click editing, then generate clean Pine Script code to paste into TradingView. I've been using it for months and haven't touched a line of Pine Script directly.