PyAlgoTrade and Backtrader Alternatives: No-Code Backtest Analysis
PyAlgoTrade is a Python event-driven backtesting library for testing trading strategies against historical data. Backtrader is a more advanced Python framework with multi-asset support, plug-in data feeds, and live broker connectivity. Both can get the job done, but for most traders who just want clear answers about their strategy's performance, Pineify's Backtest Deep Report delivers professional analysis without the Python overhead. If you've ever lost a full weekend to pip install failures, environment conflicts, and cryptic tracebacks just to run a simple backtest, you already know the real problem: the tools get in the way of the question. I've been down that road — three weekends debugging Backtrader data feeds just to test an SPY mean-reversion strategy — and I'm done pretending that's productive.
Both tools add complexity that distracts from the core question: does the strategy work? Traders are switching to Pineify because it cuts through that noise. Instead of wrestling with Python code, you paste your TradingView strategy CSV into Pineify. It transforms the raw trades into an institutional-grade report with 16+ KPIs, rolling analysis, and Monte Carlo simulations — no environment setup required. For those writing their own scripts, you'll want to check out our guide on Pine Script v5 structure and best practices.

PyAlgoTrade vs. Backtrader: Where Python Gets Complicated
Both PyAlgoTrade and Backtrader are event-driven backtesting libraries written in Python. They sound impressive on paper. In practice, using them tests your patience more than your strategy.
PyAlgoTrade was one of the earliest dedicated Python backtesting libraries. It's simple, has decent docs, and uses a clear event-driven model. You can pull data from Yahoo Finance or CSV files, and it handles basic order types. The real problem? Development has mostly stopped. It wasn't designed for strategies that trade multiple assets or timeframes simultaneously. Try running two correlated ETFs together and you'll write mountains of extra code to make it work.
Backtrader goes much further. It supports plug-in data feeds, works directly with Pandas DataFrames, aligns multiple timeframes, and offers advanced order types. You can even connect live brokers. It's versatile. That versatility comes at a cost: optimizations run painfully slow, everything processes in a single thread, and the learning curve is steep. I haven't tested Backtrader with tick-level crypto data, but I've heard the performance crater beyond 50k rows.
Both frameworks require Python comfort, environment setup, and self-debugging. They're great if you're a developer building complex systems. For TradingView users who prototype strategies and want deeper testing, they're overkill.
Here's something that doesn't get discussed enough. You just finished a backtest in Backtrader. The code works. The data is clean. It executes. Now you're staring at the output. What's next?
Standard results give you the basics: final profit or loss, trade count, max drawdown. It's a start, but it's like checking only the fuel gauge — you're missing engine temperature, tire pressure, and the road conditions ahead.
To understand your strategy's consistency, resilience in bad markets, and risk-adjusted returns, you need more. Sharpe ratio, Sortino ratio, rolling performance windows, Monte Carlo simulations. In Backtrader, getting that depth means one thing: writing more code. Another project layered on top of the project you just finished.
That exact moment — the "now what?" after the backtest — is the real gap. I'd rather spend my time analyzing results than writing analyzer code. That's why I use Pineify's Backtest Deep Report.
You do the heavy lifting: build and run a solid backtest in TradingView. Then instead of writing hundreds of lines of Python, export your trade log and upload it. The Deep Report turns it into a clear, visual breakdown of what happened. You move from "Did it make money?" to "Is this a strategy I can trust?" without writing a single extra line of code.
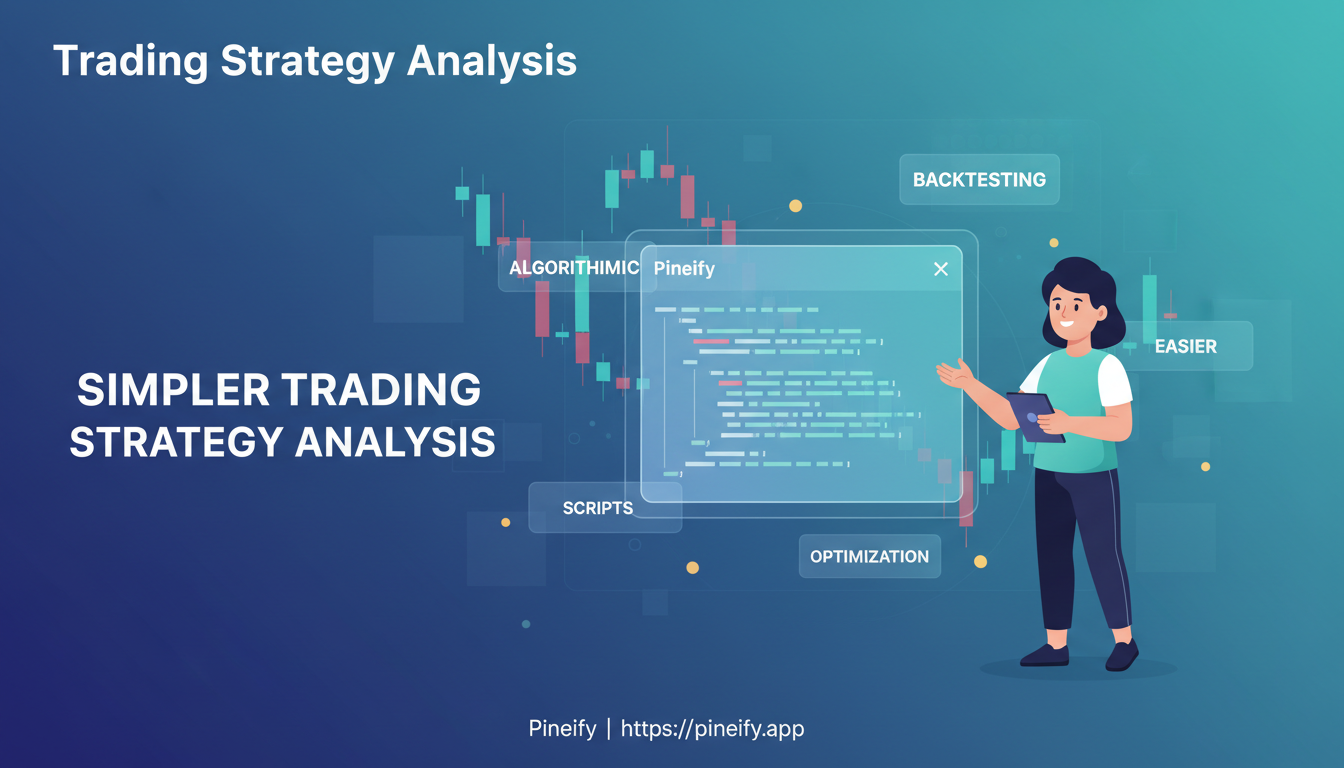
What Pineify's Backtest Deep Report Actually Does
You build and test a strategy in TradingView and export that "List of Trades" CSV. Making sense of it usually means Python and complex libraries. Pineify removes that step.
It's a tool built specifically for TradingView users. Upload your CSV from the Strategy Tester, and it builds a professional performance report in your browser. Three steps:
- Build and test your strategy in TradingView using Pine Script.
- Export the "List of Trades" from the Strategy Tester as a CSV file.
- Upload that file at pineify.app/backtest-report.
No setup. No Python. No pip install errors. Everything runs in your browser, so your trade data stays local.
16+ Professional Metrics That Show You the Full Picture
When you open your dashboard, you get a clear performance snapshot. Pineify calculates over 16 key metrics automatically — the same ones professional fund managers use. You can filter by all trades, long-only, or short-only with one click.
| Metric | What It Reveals |
|---|---|
| Sharpe Ratio | Return per unit of total volatility |
| Sortino Ratio | Return per unit of downside volatility only |
| Calmar Ratio | Return relative to maximum drawdown |
| SQN Score | Overall quality and consistency of signals |
| VaR (95%) | Worst expected loss in 95 out of 100 scenarios |
| CVaR / Expected Shortfall | Average loss in the worst 5% of cases |
| Ulcer Index (UPI) | Depth and duration of drawdowns |
| Kelly Criterion | Optimal position sizing fraction |
| Skewness & Kurtosis | Return distribution shape and tail risk |
| Recovery Factor | Profit relative to largest drawdown |
Getting this depth manually is a headache. With Backtrader, you'd write custom analyzers for every metric. With Pineify, upload one CSV and it's all computed. I built an AAPL strategy in January 2025 and the Monte Carlo simulation flagged a 12% risk of ruin I'd have missed entirely. That alone saved me from allocating serious capital to a flawed idea.
For a deeper look at crypto-specific backtesting, check out our guide on validating cryptocurrency trading strategies.
Rolling Window Analysis: Catch Decay Before It Hurts
Most traders don't see performance decay until it's too late. That's where Rolling Window Analysis comes in — like checking your oil monthly instead of waiting for the engine to seize.
Pineify v2.0 breaks your performance into every set of 20 consecutive trades. Instead of one average number, you see a moving picture of highs and lows. A strategy can look great on average while hiding a brutal losing streak in the middle.
| Metric | What It Reveals |
|---|---|
| Rolling Sharpe Ratio | Is risk-adjusted return holding steady or getting shaky? |
| Rolling Sortino Ratio | Is downside risk building before it bites? |
| Rolling Win Rate | Are you in a hidden losing streak the average masks? |
One user caught their Rolling Sharpe trending down for weeks — an early signal something was off. They adjusted before significant losses hit months later. Building this in Backtrader takes hours. Pineify gives it to you automatically.
Monte Carlo Stress Testing: 1,000 Possible Futures
A single backtest tells you what did happen during a specific time period. It doesn't answer: Was that luck? What if trades happened in a different order? How bad could it have gotten?
Pineify's Monte Carlo Simulation shuffles your trade order randomly, 1,000 times, in seconds. You get:
- Worst-case drawdown at 95% and 99% confidence intervals
- Risk of Ruin probability — the chance your account hits critical loss levels
- A spaghetti chart with all 1,000 simulated equity curves
I ran this on a TSLA scalping strategy and discovered the max drawdown was 2.3x worse than the single backtest suggested. I wouldn't have caught that without the simulation. Getting this from PyAlgoTrade or Backtrader means coding the entire thing from scratch.
MFE/MAE Analysis: Are You Leaving Money on the Table?
Maximum Favorable Excursion (MFE) and Maximum Adverse Excursion (MAE) scatter plots show the full journey of each trade, not just the exit.
For every closed trade:
- Highest profit point while open (MFE, Y-axis)
- Worst drawdown before close (MAE, X-axis)
- Color-coded: green for winners, red for losers
One user spotted a cluster where price ran far into profit (high MFE) but came all the way back to a small gain or loss. They were giving back nearly 30% of potential profits by exiting too late. After adjusting their exit rules, their average winning trade increased by 15%.
That level of insight is hard to get from raw trade lists or standard backtest charts.
Visual Heatmaps: Find Hidden Rhythms
Does your strategy crush it in January but fade by July? Stumble every Friday? Visual heatmaps reveal these patterns without staring at spreadsheets.
- Monthly Returns Matrix: Seasonal performance at a glance with YTD totals.
- Weekly Returns Heatmap (Weeks 1–53): Subtle recurring patterns during the year.
- Daily Returns Pattern: Which days of the week drive profits or losses.
- Time Efficiency Heatmap: For intraday strategies — cross-reference hour of day with day of week to find exactly when your edge exists.
That last one is crucial. A strategy might look great on paper, but a time heatmap could reveal 90% of profits come from one volatile hour each morning. Knowing that changes how you trade it.
One-Click Excel Export
Need to share performance with a partner, investor, or compliance team? Pineify's one-click Excel export builds a clean workbook with 8 organized sections:
| Sheet Name | Contents |
|---|---|
| KPI Overview | All key performance metrics in one summary |
| List of Trades | Full log of every trade |
| Monthly/Weekly/Daily Returns | Returns by timeframe |
| Rolling Statistics | Sharpe, drawdown over rolling periods |
| Returns Distribution Data | Statistical breakdown of returns |
| Monte Carlo Simulation Results | Risk simulation outcomes |
Everything processes locally. Your CSV never hits a server. You can also learn about interpreting key indicators through our guide on the Relative Vigor Index and RVI signals.
Considering PyAlgoTrade, Backtrader, and Pineify is like choosing between building a car from scratch, tuning a powerful engine, or using a sophisticated simulator. The table below breaks down what each actually requires.
| Feature | PyAlgoTrade | Backtrader | Pineify Backtest Deep Report |
|---|---|---|---|
| Setup Required | Python + pip install | Python + pip install | None (browser-based) |
| Programming Required | Yes (Python) | Yes (Python) | No |
| Monte Carlo Simulation | Manual build | Manual build | Built-in (1,000 simulations) |
| Rolling Window Analysis | Manual build | Custom analyzer code | Built-in |
| MFE/MAE Analysis | Not built-in | Limited | Built-in scatter plot |
| Visual Heatmaps | Not built-in | Not built-in | Built-in (monthly/weekly/daily) |
| 16+ KPI Metrics | Basic only | Partial (custom code needed) | Automatic |
| Data Privacy | Local | Local | 100% client-side |
| TradingView Integration | None | None | Native (CSV import) |
| Excel Export | Manual | Manual | One-click |
If you love coding and want full control, PyAlgoTrade and Backtrader are solid Python libraries. You build everything yourself. Pineify is a browser-based analysis tool that handles the stats and visuals for you — better if you want to focus on the strategy idea rather than the programming.
Common Questions About Pineify's Backtest Deep Report
▶Can I use Pineify with strategies built in Backtrader or MetaTrader?
Not directly. Pineify works with the specific CSV format TradingView's Strategy Tester produces. It can't parse Backtrader, MetaTrader, or other platform exports in their native formats. If you run your strategy in TradingView and export the trade list, you're good.
▶Is my trading data private when I use Pineify?
Yes. Everything stays in your browser — the upload, analysis, and report generation. Your CSV file is never transmitted to any server. Your strategy details never leave your machine.
▶What does the Kelly Criterion metric tell me?
It calculates the optimal percentage of your capital to risk on each trade, based purely on your strategy's historical win rate and average win versus loss size. Pineify computes it automatically so you don't need to do the math yourself. It's a data-driven starting point for position sizing decisions.
▶Can I separate Long and Short trade performance?
Yes. Every metric and chart on the dashboard includes a one-click filter for All Trades, Long-only, or Short-only. This helps you spot if your strategy's success comes mostly from one direction, which matters for understanding its real behavior.
▶How reliable are the Monte Carlo simulation results?
The simulation runs 1,000 scenarios by randomly reshuffling your actual trade history. It gives statistically sound estimates for worst-case drawdown, risk of ruin, and the full spectrum of possible equity curves. It's a stress test beyond the single historical backtest result, not a prediction.
▶Do I need to install anything to use Pineify as a Backtrader alternative?
No. No Python, no pip commands, no dependency conflicts. You only need the CSV file from TradingView's Strategy Tester. Open your browser, upload the file, and get your report.
▶What does rolling window analysis tell me that a standard backtest doesn't?
Standard backtest gives you one average number for the whole period. Rolling analysis breaks your trades into overlapping segments — every 20 consecutive trades by default — and tracks Sharpe, Sortino, and win rate across each. This reveals performance decay or losing streaks that a single average completely hides. It's an early warning system.
What to Do Next
If you've been fighting Python setups instead of understanding your strategy, there's a faster path.
- Turn on Deep Backtesting in TradingView's Strategy Tester settings for maximum historical data.
- Export the "List of Trades" tab as a CSV file.
- Upload to pineify.app/backtest-report — no sign-up needed.
- Study the Rolling Window Analysis and Monte Carlo results first. Those tabs reveal the most about whether your strategy can be trusted.
- Export to Excel with one click for offline review or sharing.
The goal isn't to replace Python tools if you're a quant developer. It's to make professional-grade analysis available to everyone else. Any trader who can download a CSV can get a serious, in-depth look at their strategy's strengths and weaknesses. For more on automated trading on TradingView, read our complete guide to algorithmic trading success.