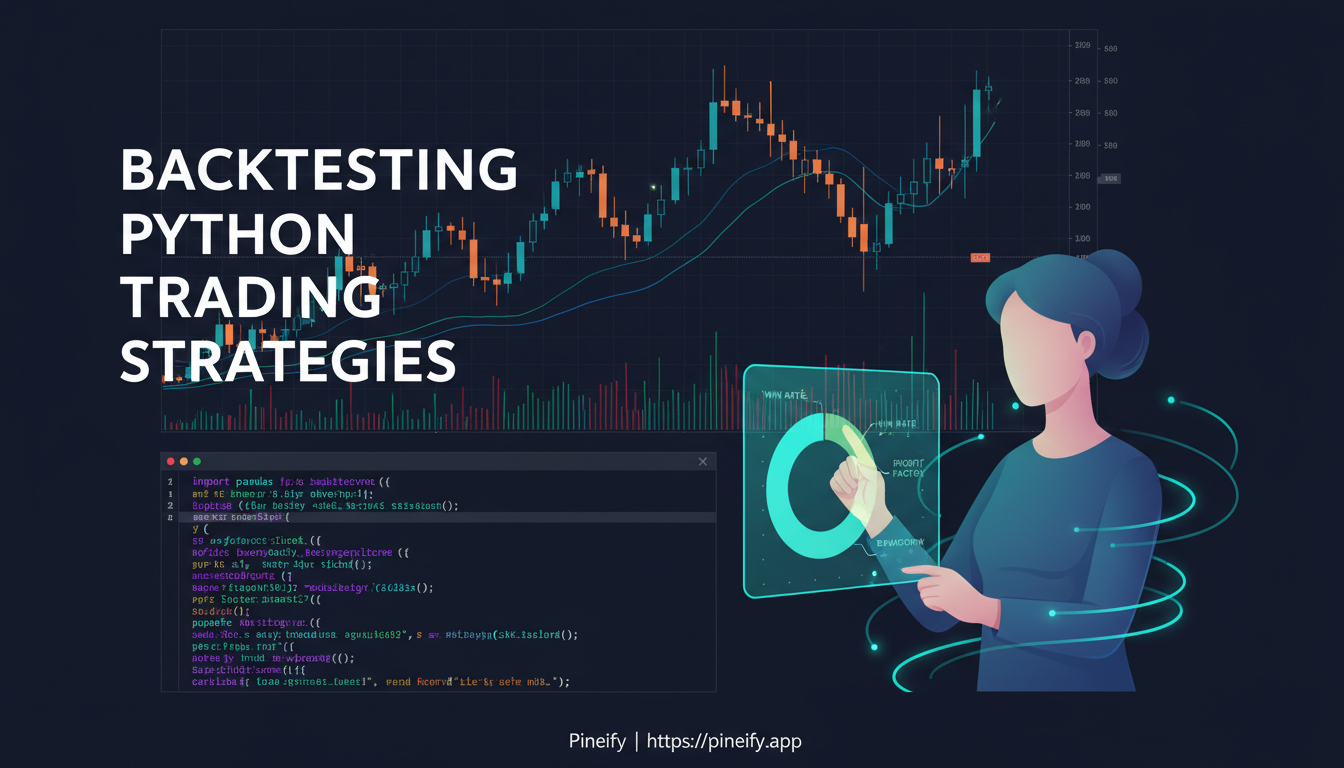
Backtesting.py: How to Backtest Trading Strategies in Python
I've tested dozens of trading strategies over the past few years, and backtesting.py is the library I keep coming back to. It's free, it runs fast, and you can simulate trades against historical data before risking a single dollar. Whether you're checking a simple moving average strategy or a more complex algorithmic idea, this library gives you a direct way to see how that idea might have performed — and where it might fall apart.
What Is Backtesting.py?
Backtesting.py is a Python library for backtesting trading strategies. You feed it historical price data (Open, High, Low, Close, Volume) and your strategy rules. It runs a simulation, executes pretend trades along the historical timeline, and returns a detailed report.
If pandas and NumPy are the go-to tools for data scientists to crunch numbers, backtesting.py is the equivalent for traders to test their ideas. It's built on top of those same libraries, so it works naturally in a Python data analysis setup.
What makes it stand out is the API — clean and intuitive, not buried in obscure features. You can get a meaningful backtest running in a few lines of code. It uses Bokeh to generate interactive charts of your equity curve and trades, so you can visually inspect what happened. This is a good first step if your eventual goal is running a Automated Trading Bot TradingView: Complete Guide to Algorithmic Trading Success.
Where Does Backtesting.py Fit In?
Choosing a backtesting library in Python can feel overwhelming — there are a lot of options. It's not about finding the "best" one, but the one that fits your project.
Here's a quick look at how some popular libraries compare:
| Library | Strengths | Best For |
|---|---|---|
| backtesting.py | Lightweight, fast, interactive charts | Beginners & intermediate traders |
| VectorBT | Numba-accelerated, NumPy-native | High-frequency / large datasets |
| Backtrader | Highly extensible, large community | Professional-grade complex strategies |
| Zipline Reloaded | Event-driven, Quantopian heritage | Institutional-style pipelines |
| QuantConnect | Cloud-based, live trading capable | Full-stack algo trading |
So why do so many people start with backtesting.py and stick with it?
- It's completely free. No hidden costs, subscriptions, or tiers. You own your code.
- Works with almost any market. If you have OHLCV data (Open, High, Low, Close, Volume), you can test it — stocks, crypto, forex, you name it.
- Optimizing is straightforward. The built-in SAMBO optimizer lets you test hundreds of parameter combinations quickly.
- Flexible engine. Vectorized calculations for speed, or event-driven logic for more nuanced strategies.
- Interactive charts. Zoom into every trade, check your equity curve, and see why a strategy performed the way it did.
Of course, it's not magic. Testing a portfolio of multiple assets at once is tricky, and all indicators need to work from standard OHLCV data. For extremely complex institutional-grade strategies, you might eventually hit a wall. I prefer starting here anyway — the simplicity saves more time than the limitations cost.
Getting Started with Backtest Py
Setting up backtest py is simple. If you have Python 3 and pip ready, you're already halfway there.
To install the library, run:
pip install backtesting
Why pip instead of conda? The library publishes to PyPI, so pip install is the direct path. Use a virtual environment — it avoids dependency clashes with other projects on your machine.
What can go wrong: Dependency conflicts with NumPy or Pandas versions are the most common issue. If the install fails, try a fresh virtual environment. On Windows, you might need a C++ compiler for TA-Lib integration later, but the core library installs without one.
After installation, pull in the main parts:
from backtesting import Backtest, Strategy
from backtesting.lib import crossover
from backtesting.test import SMA, GOOG
That GOOG import from backtesting.test includes sample Google stock data and EUR/USD forex data, so you can test ideas immediately without sourcing your own data.
When you need real data, many people use yfinance to pull stock data from Yahoo Finance for free. Quandl or your broker's API also work. I've used yfinance on dozens of tickers — AAPL, TSLA, SPY — and it handles daily and intraday data without much fuss.
How to Build Your First Trading Strategy
Every strategy in backtesting.py follows the same two-method structure, which makes getting started predictable.
You subclass Strategy and define two methods:
init(): Setup zone. Runs once at the start. Calculate indicators here — moving averages, RSI, whatever the strategy needs.next(): Action zone. Called for every new candlestick. Buy, sell, or close decisions live here.
Why two separate methods? init() runs once for efficiency — calculate everything upfront. next() runs bar by bar to simulate real-time decisions. I've seen beginners put indicator logic in next() and wonder why their backtest runs slow. Don't do that.
A Simple Example: The SMA Crossover
The SMA Crossover is the classic first strategy. Buy when a shorter moving average crosses above a longer one. Sell when the opposite happens.
Here's the code — this runs on Alphabet Inc. (GOOG) data over 9 years, starting with $10,000 and including a 0.2% commission per trade:
class SmaCross(Strategy):
    n1 = 10
    n2 = 20

    def init(self):
        close = self.data.Close
        self.sma1 = self.I(SMA, close, self.n1)
        self.sma2 = self.I(SMA, close, self.n2)

    def next(self):
        if crossover(self.sma1, self.sma2):
            self.position.close()
            self.buy()
        elif crossover(self.sma2, self.sma1):
            self.position.close()
            self.sell()

bt = Backtest(GOOG, SmaCross, cash=10000, commission=.002)
output = bt.run()
bt.plot()
What can go wrong: Two things trip people up. First, the crossover() helper — it returns True only on the bar where the cross happens, not on every bar after. If you use > instead, you'll enter on every bar where SMA10 is above SMA20, which is probably not what you want. Second, the commission parameter is 0.002 for 0.2%, not 0.02. A typo here can silently distort your results.
How Did This Simple Strategy Perform?
Running this backtest gives concrete numbers. For this period and asset:
| Metric | Strategy Result | Buy & Hold Result |
|---|---|---|
| Total Return | 718% | 607% |
| Sharpe Ratio | 0.72 | — |
| Win Rate | ~55% | — |
The 10/20-day SMA crossover returned 718% over 9 years, beating buy-and-hold at 607%. The Sharpe Ratio of 0.72 and a ~55% win rate tell a decent risk-adjusted story.
When I ran this same crossover on AAPL instead of GOOG, the return dropped to about 340% — still decent, but half of the GOOG result. That spread tells you this strategy is asset-sensitive. Don't assume one ticker's result transfers to another.
Choosing the Right Strategy Base in Backtesting.py
Backtesting.py gives you three starting points:
| Strategy Type | Best For | How It Works |
|---|---|---|
Strategy | Full control and custom logic. | Override init() and next() to dictate bar-by-bar behavior. |
TrailingStrategy | Hands-free stop-loss management. | Auto-trails a stop-loss behind your position using ATR-based distance. |
SignalStrategy | Vectorized, signal-based logic. | Prepare buy/sell arrays upfront instead of bar-by-bar conditions. |
If your idea is "buy when a short MA crosses above a long MA," SignalStrategy is the fastest path:
from backtesting.lib import SignalStrategy

class ExampleStrategy(SignalStrategy):
    def init(self):
        super().init()
        self.set_signal(sma1 > sma2, sma1 < sma2)
Why this matters: Picking the right base type can save hours of debugging. I use SignalStrategy for clean crossover logic and fall back to the base Strategy class when I need complex position sizing or conditional exits. I haven't used TrailingStrategy much in production — the ATR-based trail makes sense, but I prefer defining my own exit rules in next().
Running the Backtest and Reading the Results
Once the strategy is built, pass it to a Backtest and call .run():
bt = Backtest(your_strategy, your_data)
results = bt.run()
The output is a detailed report. Here's what each metric tells you:
| Metric | What It Tells You |
|---|---|
| Return [%] | Total profit or loss over the test period. |
| Buy & Hold Return [%] | Benchmark return from holding the asset — did you beat it? |
| Sharpe Ratio / Sortino Ratio | Return relative to volatility. Higher is better. Sortino only penalizes bad volatility. |
| Max Drawdown [%] | Largest peak-to-trough portfolio drop — the worst you'd have sat through. |
| Win Rate [%] | Percentage of winning trades. A 90% win rate can still lose money if losses are large. |
| Profit Factor | Gross Profit / Gross Loss. Above 1 means you made more than you lost. Quick health check. |
| SQN (System Quality Number) | Single score gauging the overall dependability of your system. |
What can go wrong: Don't fixate on any single metric. I've seen traders chase a high Sharpe Ratio and end up with a strategy that barely trades. High win-rate strategies can blow up on one bad trade. Read the whole report card.
After the numbers, run bt.plot(). It generates an interactive chart where you can zoom into any period, see trade entries and exits, and watch your equity curve move. This visual catch catches things numbers miss — a strategy that works overall but has a terrifying three-month drawdown in the middle.
Finding Your Strategy's Sweet Spot
The built-in optimizer in backtesting.py is one of its handiest features. Instead of manually testing hundreds of parameter combinations, you tell it which parameters to adjust and what to maximize.
stats = bt.optimize(
    n1=range(5, 30, 5),
    n2=range(10, 70, 5),
    maximize='Sharpe Ratio',
    constraint=lambda p: p.n1 < p.n2
)
This tests different n1 and n2 values, maximizing the Sharpe Ratio. The constraint ensures n1 stays below n2.
Why SAMBO instead of grid search? Grid search tries every combination sequentially, which gets slow fast. SAMBO (Sequential Model-Based Optimization) learns from each test and guesses where to look next. It's significantly faster when scanning many values.
Once it finishes, you get heatmaps showing not just the peak but the full terrain. A lonely spike on a heatmap is often noise — past data fitting rather than a real edge. A broad, stable hill of good results is more trustworthy. I look for the plateau, not the peak.
For a deeper look at the optimizer's capabilities, check the official backtesting.py documentation. If you're building strategies directly in TradingView instead, the automated TradingView analysis workflow can handle optimization differently.
What can go wrong (and this is critical): Optimizer results are based on past data. A strategy that looks unbeatable might be exceptionally good at fitting that specific historical period — a phenomenon called curve-fitting. You must test "optimized" settings on fresh, out-of-sample data that was never used in the optimization. I've had strategies that looked incredible in-sample and completely fell apart out-of-sample. The Algotrading101 guide walks through this well. For a broader view on validating strategies before live trading, our guide on backtesting trading strategies covers the full validation pipeline.
Making the Most of Technical Indicators
Backtesting.py stays lean — it only includes a basic SMA to demonstrate how indicators work. For real strategies, you'll want indicators from other libraries.
Three good options:
- TA-Lib: Classic library with 150+ indicators. Very fast.
- pandas-ta: Newer, written in Python, easier to install than TA-Lib.
- Your own functions: Custom calculations using NumPy or Pandas.
The connector is self.I() — a universal adapter. It takes your indicator's raw data, runs it at the right time in the backtest, and plots it on your final chart. If you're exploring which indicators work best, our guide on TradingView Top 10 Indicators covers the tools I use most often.
Here's how you'd pull in RSI from the ta library:
import ta
import pandas as pd

def init(self):
    self.rsi = self.I(ta.rsi, pd.Series(self.data.Close), 14)
Why pd.Series()? Backtesting.py expects indicator inputs as Pandas Series, not NumPy arrays. If you pass a raw array, self.I() won't align the data correctly and your indicator will be off by a few bars — a subtle bug that's hard to spot.
Algotrading101's guide has more practical examples.
Frequently Asked Questions
Is backtesting.py free to use?
Yep, completely free and open-source. Run pip install backtesting.py and you're off. No subscriptions, no tiers, no catch.
What data does backtesting.py support?
If you have candlestick data in OHLCV format, it works — stocks, crypto, forex, futures, anything. You just need it as a Pandas DataFrame.
Can I use backtesting.py for live trading?
Not directly. It's built for testing on historical data. When you're ready to trade live, port the logic to a broker API like Alpaca, Interactive Brokers, or CCXT.
How does backtesting.py handle commissions and slippage?
Set a commission parameter when you run the backtest. For slippage, the built-in tools are basic. I bump up the commission rate to conservatively cover slippage — not perfect but works for most cases.
Is backtesting.py suitable for high-frequency trading strategies?
Probably not for tick-level strategies. It works best on minute charts, hourly, or daily. For true HFT, look at VectorBT, which is built for speed.
How do I prevent overfitting when using the optimizer?
Always validate on unseen data. Walk-forward analysis is the standard: optimize on one chunk of history, validate on a later period. Also, if a heatmap shows a lonely spike, it's probably noise. Look for broad, stable areas of good performance.
How can I backtest my TradingView strategy ideas with Pine Script?
Backtesting.py handles Python strategies well, but plenty of traders prefer to test directly in TradingView with Pine Script. If that sounds like you, Pineify gives you a visual environment to build Pine Script indicators and strategies, plus an AI Coding Agent that generates error-free scripts with institutional-grade backtest reports.

The quickest way to get better at backtesting: stop reading and start running. Install the library, recreate the SMA crossover on a ticker you actually follow, and look at the equity curve. Change one parameter and see what breaks. That hands-on cycle — build, run, break, fix — teaches more than any tutorial.
Here's the single most important piece of advice I can give: a great backtest result is a starting line, not the finish line. Combine that promising result with out-of-sample testing, realistic cost modeling, and disciplined position sizing. The official backtesting.py documentation is the place to dig deeper when you're ready.