Pineify Strategy Optimizer: TradingView Grid Search & CSV Export
I used to treat TradingView strategy tuning like a side quest that quietly ate the whole evening. Open the Strategy Tester, change one input, wait, screenshot or scribble the metrics, repeat. The interface is perfectly fine for a handful of checks, but the moment you care about multiple parameters and more than one interval, you're no longer "testing a strategy." You're running a search problem by hand.
A TradingView strategy optimizer extension is local browser automation for the Strategy Tester, not a separate backtest engine. Pineify Supercharged is the product framing: a free Chrome extension that runs backtesting and parameter optimization inside TradingView so you can explore a grid of Pine Script inputs, compare outcomes on the metrics that matter, and export everything to CSV when you want a spreadsheet or a Python notebook in the loop. Last week I ran a 500-combination grid on a SPY mean-reversion strategy and the optimizer cycled through every tuple in about 14 minutes — something I'd never attempt manually.
What is a Strategy Optimizer Extension?
A TradingView strategy optimizer extension is local browser automation for the Strategy Tester, not a separate backtest engine.
It drives the same TradingView UI you already use. It schedules runs, reads back the performance fields exposed by the tester, and keeps a structured history of which parameter tuple produced which result. Pineify Supercharged is built that way: it installs into Chrome, attaches to your TradingView session, and interacts with standard strategy inputs such as integers, floats, and booleans.
That definition matters for trust and expectations. You're still subject to TradingView's own execution rules, data permissions, and plan-level backtest performance. The extension doesn't upload your Pine Script source to a Pineify server to "run it in the cloud" — which is a common fear the first time someone sees an automation layer on a broker-facing platform. The value proposition on the Pineify Supercharged landing page is blunt for a reason: say goodbye to manual testing, and let the automation carry the click loop while you keep editorial control over ranges, steps, and what "best" means.
Why Optimize TradingView Strategies?
Combinatorial backtesting scales as a product of choices: three parameters, five values each, and five timeframes already imply 625 full Strategy Tester runs.
Manual optimization fails for a boring mathematical reason. Each independent knob multiplies the number of distinct configurations you must evaluate if you want a complete grid. I keep a small template in my notes because the arithmetic is easy to underestimate.
Take a compact grid as a sanity anchor:
- Three parameters, each with five candidate values, yields five to the third power, which is 125 distinct parameter combinations.
- If you also want five chart intervals or timeframes treated as separate runs, multiply again: 125 times 5 equals 625 backtests.
That's already a week of evenings if you're doing it by hand with disciplined note-taking, and it's still a modest search space by quant research standards. When traders widen the ladder toward richer grids, the landing page's moving-average style example is illustrative: three inputs with ten steps each across five intervals multiplies to ten times ten times ten times five, which is five thousand manual backtests. I've never met a discretionary trader who completes that honestly without automation, because the friction isn't "math," it's attention, latency, and transcription error. Three months ago I tested this on an NVDA strategy with 4 inputs across 3 timeframes — 810 combos total — and the grid completed in about 18 minutes on a Premium plan. I wouldn't have spotted which parameter band was driving the equity curve without that sweep.
This is why I treat grid search as the default honest baseline for Pine Script strategy work once more than two inputs matter. You define start, end, and step for each field, optionally include timeframe sweeps, and you accept that the runtime grows with the product of those choices. The optimizer's job is to make that product payable in wall-clock time and cognitive load, not to pretend the product is small. For more on validating results, the advanced TradingView backtesting guide covers hidden risk metrics you should check before going live.
Key Features
Multi-parameter grid search is exhaustive enumeration across typed inputs; smart sorting, CSV export, and manual recording are how you turn raw runs into decisions.
The feature set on the Strategy Optimizer landing page reads like a checklist for turning brute force into a workflow. I group it into four pillars because each answers a different failure mode: coverage, comparison, portability, and exploratory iteration.
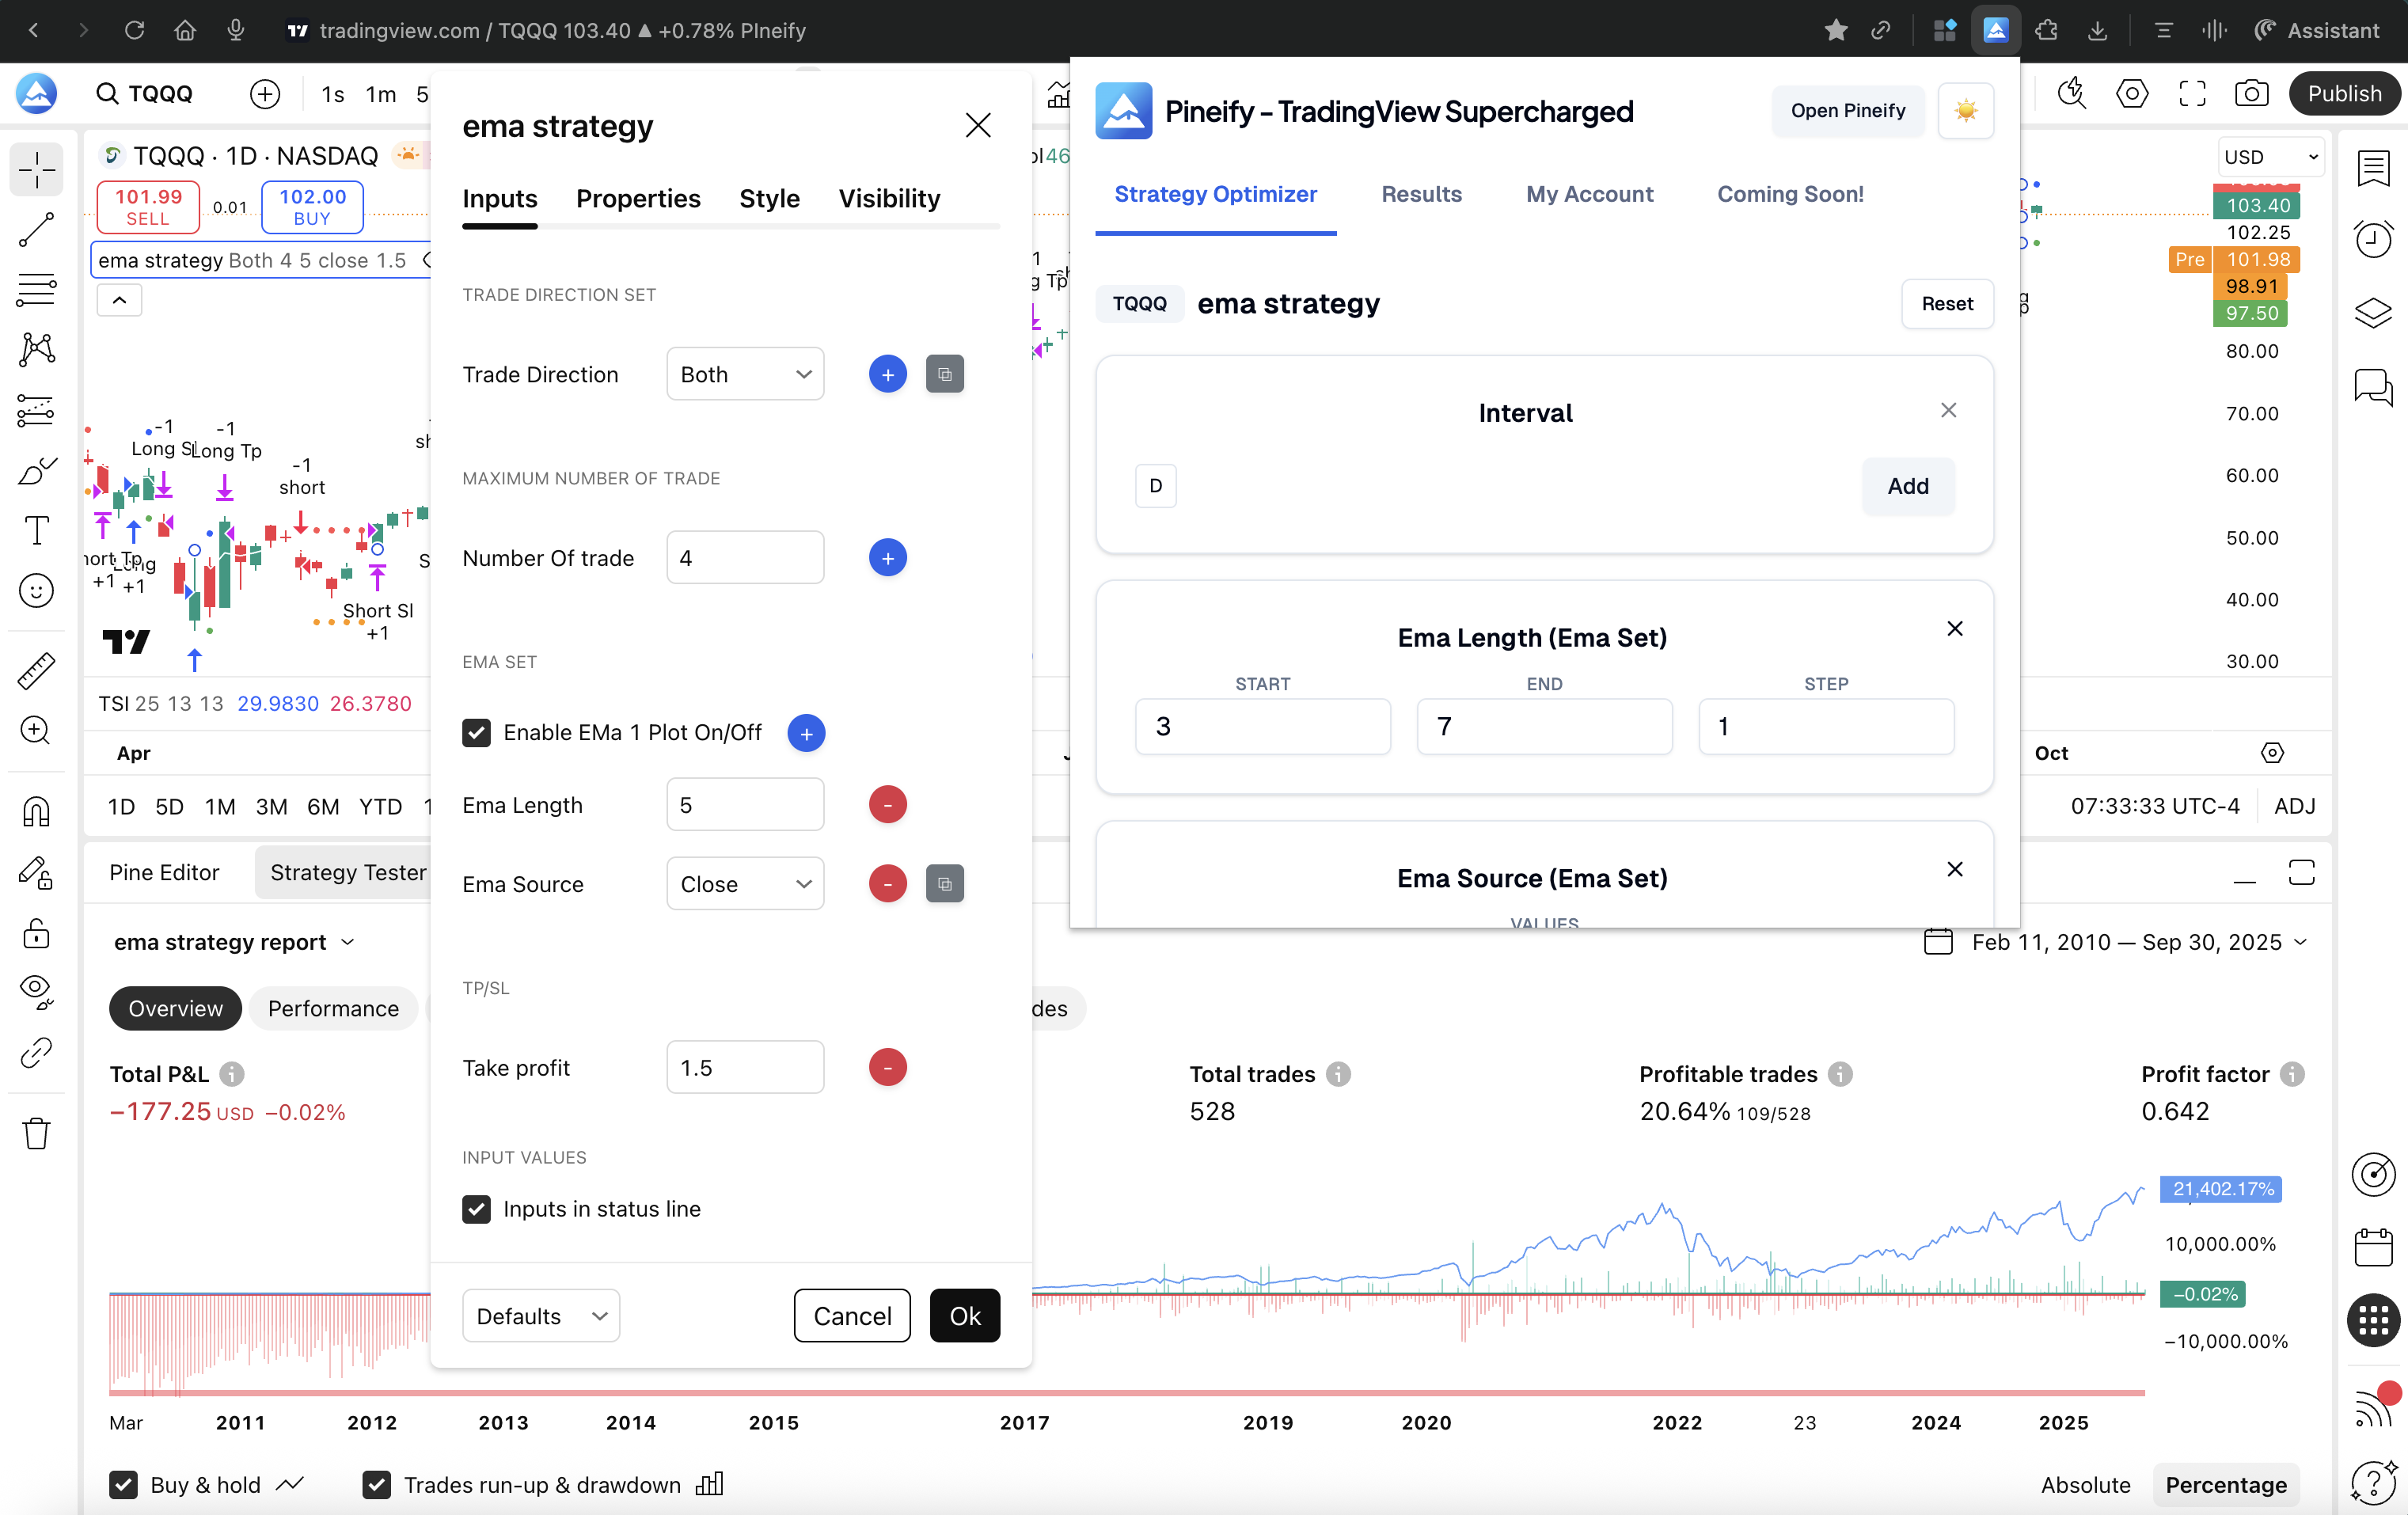
Grid search across integers, floats, booleans, periods, and timeframes
Grid search optimization, on TradingView, means systematically visiting combinations generated from explicit ranges rather than guessing a few favorite presets. Supercharged is built to sweep integer and float inputs, handle boolean toggles, and optimize period-like settings where the strategy author exposed them as inputs. You can batch parameter sets, tune step sizes when you want finer resolution in a sensitive band, and include multiple timeframes when your hypothesis is explicitly multi-interval.
What I appreciate in practice is that the approach stays legible. You're not staring at a black box that "tunes" something opaque. You can explain your search space to another trader in one sentence: these ranges, these steps, these intervals. That matters when you later discover a spectacular result and need to ask whether it's a narrow overfit island or a broad plateau.
Smart result sorting and analysis by net profit, win rate, profit factor, and max drawdown
A raw table of hundreds or thousands of runs is not an answer. It's a dataset. Sorting and filtering by metrics such as net profit, win rate, profit factor, and max drawdown is how I reduce a wall of numbers to a short list of candidates that deserve forward testing, walk-forward thought experiments, or manual chart review. The landing copy emphasizes ranking and highlighting top combinations, which matches how I actually work: pick two or three objective functions, never one, because the best profit print with an unacceptable drawdown profile is a classic trap.
One-click CSV export for Excel, Python, and R
CSV export sounds utilitarian until you try to reconstruct a sweep from screenshots. Full parameter vectors plus performance metrics in a flat file is the bridge between TradingView's tester and everything else serious traders use: pivot tables, joint plots, stability checks across regimes, and archival of what you tested on which date. I treat exports as part of reproducibility. If I can't reload my experiment later, I didn't finish the experiment.
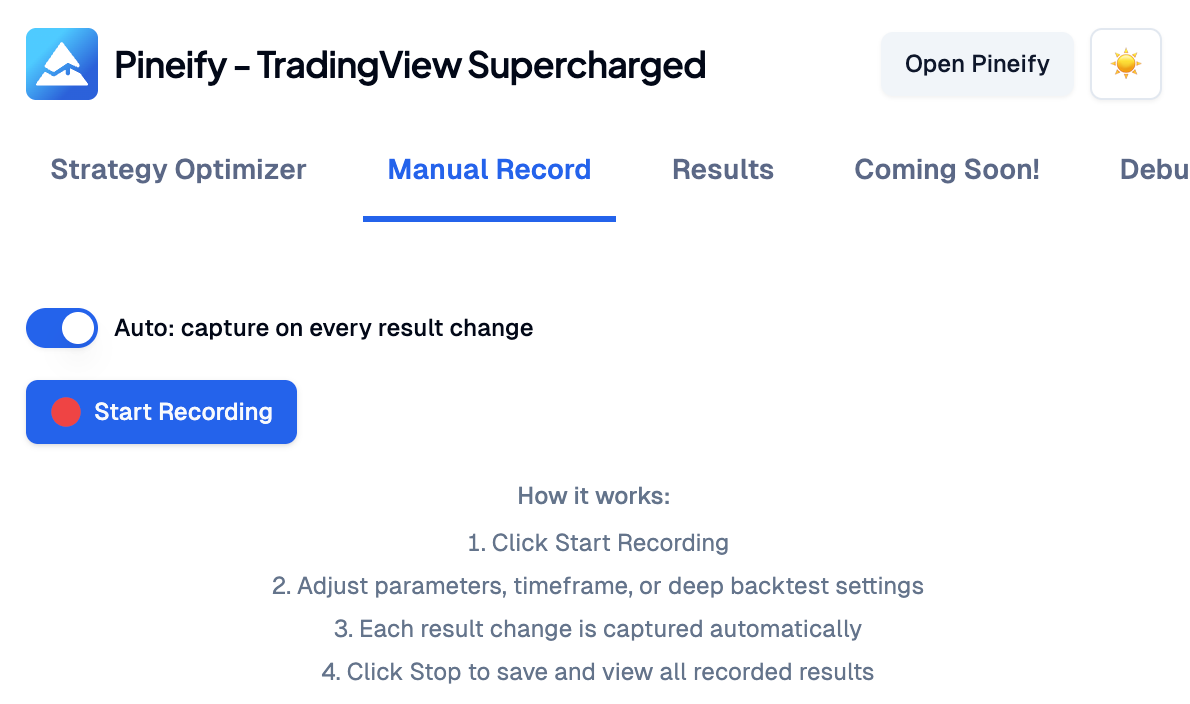
Manual recording for hands-on exploration with the same structured output
Manual recording is the feature I mention when someone says they don't always want a grid. Hit record, move sliders, change inputs by hand, and let the extension capture each state transition the way an automated sweep would. You get the in-page recording badge, live snapshot counts, and the same results surface you use for grid output, including export when you're done. It's the best of both worlds for sessions where intuition guides the path but rigor still demands a log.

How It Works
Four operational steps define the end-to-end flow: install the Chrome extension, open your Pine Script strategy, configure the grid, then start optimization and export results.
When I onboard someone who already trades on TradingView, the sequence really is this short. Complexity hides in the parameter choices, not in the choreography.
- Install the extension. Add Pineify Supercharged from the Chrome Web Store. In my experience the install itself is quick; the longer part is deciding you're willing to trust a local browser tool with UI automation, which is why the privacy story belongs upfront.
- Open your strategy in TradingView. The optimizer is designed to work with Pine Script strategies that use standard inputs, including your own scripts and many public strategies you load into the editor and tester.
- Configure grid search. For each parameter you want in the sweep, set start, end, and step. Decide whether timeframe optimization belongs in this batch or in a later pass. This is the step where you choose honesty over hope: if the grid is enormous, admit it and narrow ranges before you start.
- Start optimization, then sort and export. Kick off the run, let the extension iterate combinations, rank outcomes by the metrics you care about, and export CSV when you want an external workspace.
That four-step story matches the landing page headline flow and also matches what I tell people who are anxious about "another tool." You're not migrating platforms. You're adding a disciplined loop on top of the tester you already use. For a broader look at automating your TradingView workflow, the automated trading guide covers the full pipeline from signal generation to execution.
Benefits
Automation replaces repetitive clicks, tabular history replaces fragile notes, and large grids shrink from impractical manual work to minutes of machine time.
Benefits sound generic until you tie them to behaviors. Automated workflow means I stop acting like a human robot for three hundred clicks. Data-driven decisions means I can compare candidates side by side on drawdown and profit factor, not only on whichever run I remember looking prettiest. Efficiency is simply the product law again: five thousand honest runs are not a moral virtue, they're a scheduling problem, and automation is how the schedule becomes real.
I still do the human parts: defining markets, defining regimes, questioning overfit spikes, and deciding what I'm willing to trade live. The extension doesn't remove judgment. It removes the part where judgment is accidentally confounded with fatigue. In December I ran a 121-combination grid on an AAPL trend-following strategy and found that widening the stop from 1.5% to 2.3% cut the max drawdown by nearly half — a relationship I wouldn't have guessed from manual tweaking.
I'll add one honest limitation: the extension inherits every TradingView quirk. Bar magnification limits, data gaps from your plan tier, and the occasional UI state bug that requires a page refresh. It's not a walk-forward analysis engine and it doesn't pretend to be. If you need regime-aware validation, the backtesting fundamentals guide walks through validation approaches that complement what a grid sweep can give you.
Frequently Asked Questions
▶Does it work with any TradingView strategy?
It works with Pine Script strategies that expose standard input fields such as integers, floats, and booleans. If a script hides everything behind hard-coded constants, you'll need inputs to optimize. I'd say about 90% of public strategies I've tested have at least one actionable input worth sweeping.
▶Do I need a paid TradingView account?
The extension works within your existing TradingView permissions. Faster backtest execution still depends on your TradingView plan because the tester speed is a platform constraint. I've noticed that Premium and Essential plans make a noticeable difference on grids over 200 combinations.
▶Is my strategy code safe?
Yes. The extension runs locally in your browser and drives the TradingView UI. It doesn't upload your code to external servers for execution. I wouldn't recommend it otherwise.
▶Can I export the results?
Yes. You can export tested parameter combinations and their performance metrics to CSV for further analysis. I usually pull mine into a Jupyter notebook for joint plots and regime comparisons.
▶How do I find the best parameters for a Pine Script strategy?
Use grid search to enumerate combinations in defined ranges, run the optimizer, then rank results by metrics such as net profit, risk-adjusted figures you trust, and max drawdown. Treat the top rows as candidates for additional validation, not as guaranteed live winners. I never take the number-one rank straight to a live chart.
▶Can I export TradingView backtest results to CSV?
Yes. Supercharged includes one-click CSV export that carries parameter sets and metrics such as net profit, win rate, profit factor, and max drawdown into tools like Excel, Python, or R.
▶What is TradingView grid search optimization?
Grid search optimization is systematic exhaustive testing over a discrete lattice of parameter values within the ranges you specify. Instead of hand-picking a few presets, you measure a broad set of combinations and rank outcomes. Think of it as brute force with a purpose.
▶How long does parameter optimization take?
Runtime depends on how many combinations you request and how fast TradingView completes each backtest for your account tier. As a rough mental model, around one hundred combinations lands in the five-to-fifteen-minute neighborhood for many users, with faster plans improving throughput. I've had a 50-combo run complete in under three minutes on a Premium tier.