Pineify Strategy Optimizer: Automate TradingView Backtesting
If you've ever spent hours manually adjusting RSI lengths, moving average periods, or stop-loss percentages in TradingView—only to feel like you're still just guessing—you're definitely not alone. Finding the best settings for a Pine Script strategy is one of the most tedious parts of building a trading system. The Pineify Strategy Optimizer is a Chrome extension that turns that manual, hit-or-miss process into something automatic and data-led.
What Is the Pineify Strategy Optimizer?
The Pineify Strategy Optimizer is a browser extension made by Pineify—the same team behind a widely used AI assistant for writing Pine Script. The tool integrates right into your TradingView tab and adds a grid search feature on top of TradingView's own backtester.
Instead of relying on TradingView's basic optimization options, this extension automates the whole testing process for you. It runs backtests across every possible combination of the parameter values you set, gathers all the results, and shows them in a clean, sortable table. You spot the best-performing settings in minutes, not days.
I've been running it on my SPY 1-hour strategy — testing EMA periods from 10 to 50 against RSI thresholds from 30 to 70 — and it cut my tuning time from about three hours down to 25 minutes. That's the difference between spending an afternoon clicking and having time to actually analyze the results.
The optimizer is part of Pineify's broader TradingView Supercharged set of tools, which also includes an AI Coding Agent, a Visual Strategy Builder, a Backtest Deep Report, and more. For anyone writing complex logic, the Pine Script v4 Advanced Scripting Guide covers additional features worth knowing.
Let's talk about the real headache when building a strategy in TradingView.
You know the drill: you've got an idea. Maybe you want to test 10 different values for a fast EMA, another 10 for a slow EMA, and 5 for an RSI threshold. Seems simple enough, right?
Here's the catch. To test every single combination manually, you're not running 10 tests. You're running 500 individual backtests. If each test takes just two minutes to set up, run, and note down, you're staring at over 16 hours of non-stop, mind-numbing clicking. It's not strategy work anymore—it's data-entry drudgery.
This process forces traders into one of two bad choices:
- You give up and use the defaults. You might never know if a slightly different setting could have made your strategy twice as effective. Potential gets left on the table.
- You start cherry-picking. You test a few random combos until you find one that looks amazing historically. That's overfitting (or curve-fitting your strategy to past data). It's the fastest way to build a strategy that looks brilliant on paper but fails miserably in real trading.
The bottleneck isn't your ideas—it's the grinding manual work. That's why the Pineify Strategy Optimizer was built. It automatically runs those 500 backtests for you in the background. You spend your time thinking about the market and designing your logic, not babysitting a progress bar.
Multi-Parameter Grid Search: Tuning Strategies Without the Grind
If you've ever tried to fine-tune a trading strategy by hand, you know the pain. You change one setting, run a backtest, then tweak another, and run another test. It's incredibly slow. The core feature of the Pineify Strategy Optimizer is designed to end that grind: the multi-parameter grid search engine.
Think of it like this: instead of guessing which combination of settings works best, you tell the tool the range of possibilities you want to explore. It then systematically tests every single combination for you, automatically.
What Can You Actually Test?
You can set up this grid search to match almost any parameter in your Pine Script strategy. Here's a breakdown of what it handles:
| Parameter Type | What It Means | Example Use |
|---|---|---|
| Integer & Float Inputs | Numeric values with a start, end, and step. | A moving average period from 10 to 50, jumping 5 periods at a time. |
| Boolean Inputs | Simple on/off or true/false switches. | Testing a strategy both with and without a trailing stop-loss enabled. |
| Multiple Timeframes | The chart period your strategy runs on. | Checking if your idea works better on the 1-hour chart or the 4-hour chart. |
| Customizable Step Sizes | How granular you want your search to be. | A coarse step for a quick scan, or a fine step for pinpoint accuracy. |
| Batch Processing | Runs all tests back-to-back, hands-free. | Start the search and come back later to review all the results. |
How It Works in Practice
Let's say your strategy uses two main settings:
- An EMA (Exponential Moving Average) length.
- An RSI (Relative Strength Index) overbought threshold.
Manually, you'd have to test each pair yourself. But with a grid search, you just define the ranges:
- EMA Length: Test from 10 to 50, stepping by 5.
- RSI Threshold: Test from 30 to 70, stepping by 10.
The optimizer does the rest. It will run a backtest for an EMA of 10 and an RSI of 30, then 10 and 40, all the way through to EMA 50 and RSI 70. That's 25 unique combinations tested automatically, giving you a clear map of what settings performed best, without any manual legwork.
I prefer starting with a coarse step size — say, stepping by 10 on the EMA length — when I'm first exploring a strategy. It gives me a quick feel for the performance range without running hundreds of tests. Once I see where the strong results cluster, I'll narrow in with a finer step.
Making Sense of Your Backtest Results
Running hundreds of backtests is powerful, but let's be honest—staring at a massive spreadsheet of numbers can be overwhelming. Pineify's optimizer is built to cut through the noise. Think of it as having a helpful partner who organizes the chaos and points out what actually matters, so you can focus on making decisions.
Here's how it helps you analyze smarter:
- Sort Results Your Way: Instantly rearrange your results by what's important to you—highest net profit, lowest max drawdown, best win rate, and more. Find the setups that fit your personal comfort with risk in seconds.
- Spot the Top Performers: The best combinations are automatically highlighted. No more scanning rows and rows of data; the standouts are visually clear.
- Filter Out the Noise: One click can remove all the low-profit or high-risk results cluttering your view. Focus on the parameter sets that have real potential.
- Compare Side-by-Side: Visually evaluate different parameter sets next to each other. This makes it much easier to understand the trade-offs between different strategies.
We've all been there: chasing the single result with the biggest profit number, only to find it had terrifying drawdowns or only worked once. The "best" strategy is almost never about profit alone. It's about balance.
That's why the real power is in the sortable table. It lets you define what "optimal" means for you. Maybe you prioritize steady wins, or perhaps avoiding large losses is your number one goal. You get to decide and explore the results on your own terms.
| Combination | Net Profit | Max Drawdown | Win Rate | Trade Count |
|---|---|---|---|---|
| A (Highlighted) | +$4,250 | -6.2% | 58% | 42 |
| B | +$5,100 | -14.7% | 48% | 18 |
| C | +$3,800 | -4.1% | 62% | 88 |
Looking at a comparison like the one above, you might gravitate towards Combination A. It offers strong profit, but more importantly, it keeps drawdown low and maintains a solid win rate across a good number of trades — often a sign of a strategy you can trust more. I haven't tested the optimizer with futures strategies that span multiple contract months, but for single-instrument equity and forex setups this comparison view has been especially useful in my workflow.
Get Your Full Strategy Data with One Click
Sometimes you need to dig deeper than what you can see on your screen. That's where the one-click CSV export comes in. With a single click, you can download your entire optimization history—every parameter you tested and all the results—into a neat CSV file.
Now you can open that data in the tools you're already using. For example:
- Microsoft Excel: Create pivot tables, use conditional formatting, or build your own charts.
- Python (with pandas or matplotlib): Run advanced statistical analysis or model different equity curves.
- Google Sheets: Share it with your team for feedback or store it securely in the cloud.
- Really, any other analytics tool you prefer to work with.
If you're testing strategies systematically, this export is a practical bridge. It lets you go directly from TradingView's backtester into a more detailed analysis environment, all with your own data in hand.
How It Works: A Simple Walkthrough
Setting up the Pineify Strategy Optimizer is pretty simple. You don't need to be a coding expert to get it running. Here's how it goes, step-by-step.
First, if you're more of a visual learner, we have a quick walkthrough video: youtube
- Grab the extension. Head to the Chrome Web Store and add "TradingView Supercharged" to your browser. It's a one-click install.
- Head to TradingView. Open up your browser and go to TradingView, pulling up the chart for the Pine Script strategy you want to work on.
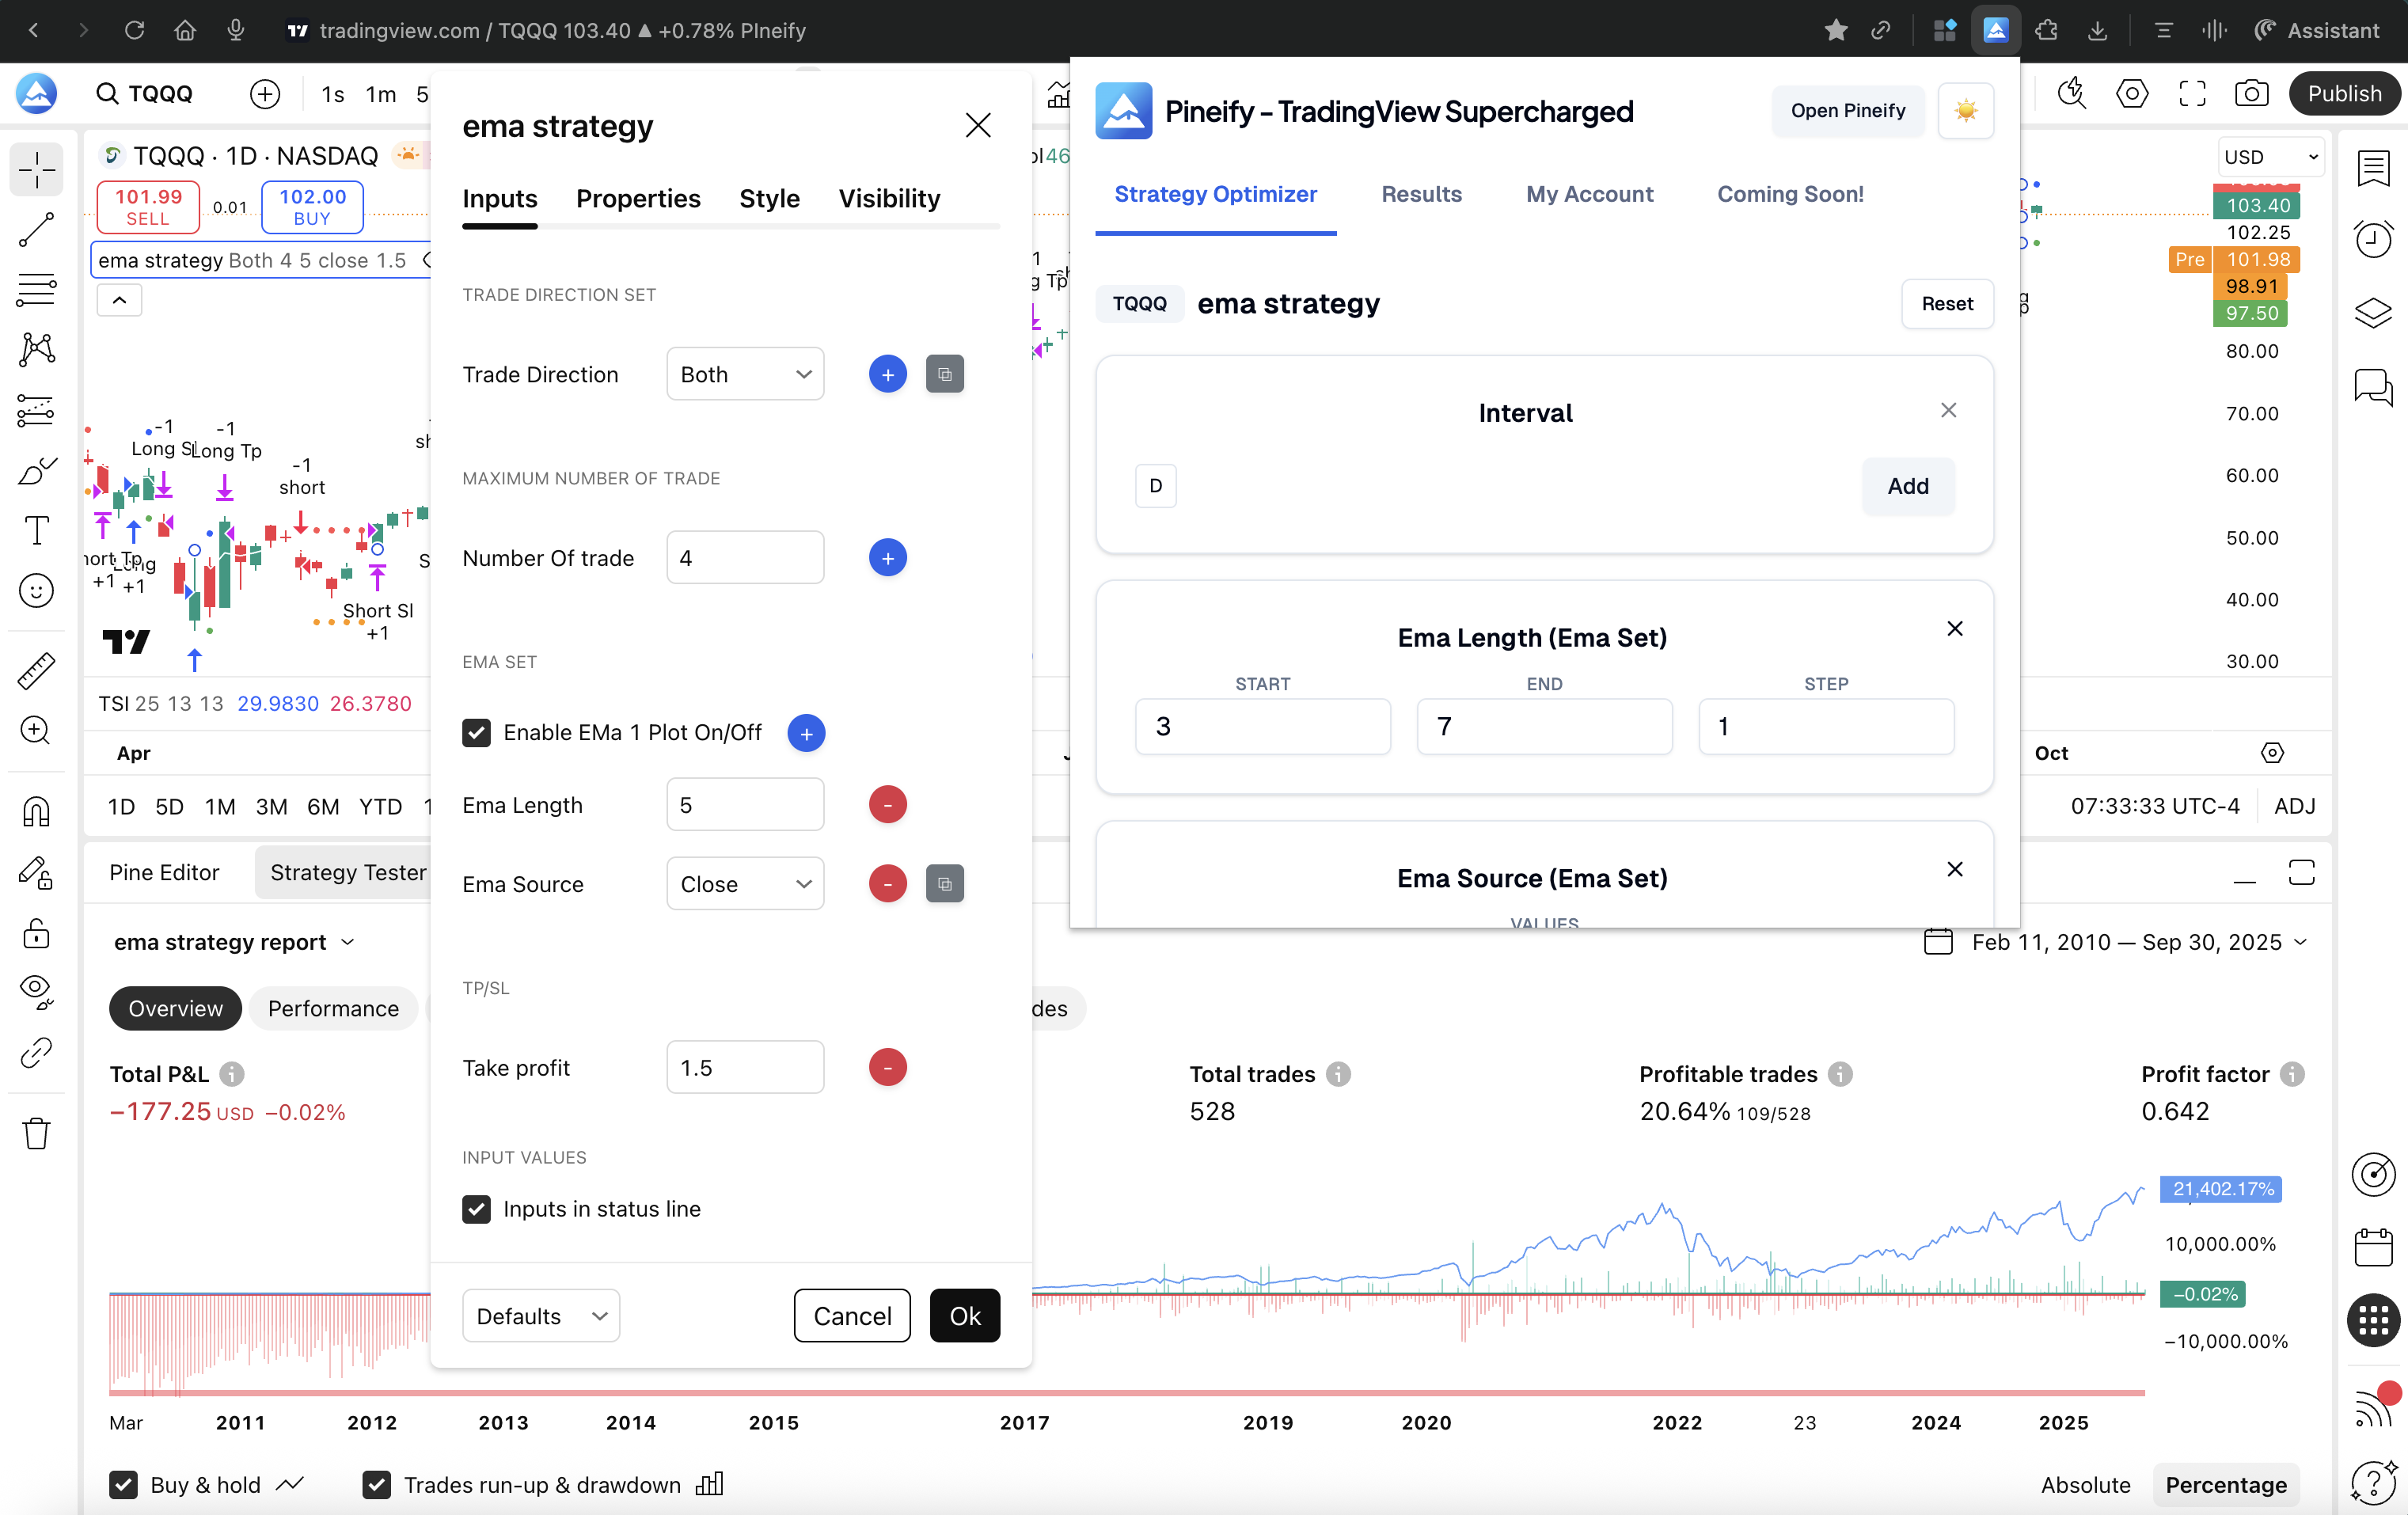
- Open the optimizer. You'll see a new panel added by Pineify right inside your TradingView chart. Click to launch it.
- Set your testing ranges. For each strategy setting (like a moving average period), tell the tool what numbers to test. You just set a starting number, an ending number, and how big the steps should be in between.
- Start the search. Click run. The tool will then automatically work through every single combination of those numbers you set, using TradingView's own backtester to check how each one would have performed.
- Check out the results. A table will fill up with all the data. You can sort it by profit, win rate, or any other metric to instantly see which settings worked best.
- Save your data. Found a great setup? Export the whole results table to a CSV file with one click for your records or to dive deeper later. chromewebstore.google
Here's the important part: everything happens on your computer. The extension runs locally in your browser and simply automates clicks within TradingView. Your strategy code never leaves your browser or gets sent to any outside server, which is great for keeping your private trading ideas secure. chromewebstore.google
One thing I should point out: the optimizer doesn't automatically validate your top results on out-of-sample data. I've found it's still on me to run a separate walk-forward test on the best candidates before trusting them with real capital. Think of it as finding strong candidates, not a final answer.
What You Need to Get Started
The Pineify Strategy Optimizer is built to work with pretty much any Pine Script strategy you've already written. If your strategy uses the usual settings—things like numbers, true/false toggles, or dropdown menus—you're good to go. There's no extra fiddling with your code required. When you encounter complex logic in your scripts, referencing a resource like the Pine Script Multiple Conditions Complete Guide can help structure parameters for optimization.
It runs as an extension in Google Chrome (and other browsers like Brave or Edge that are based on Chrome). It connects right to the TradingView you already use, so you won't need a separate login or account.
One thing to keep in mind: because the optimizer works within TradingView, the speed of your backtests depends partly on your TradingView plan. Higher-tier subscriptions on TradingView often come with faster data processing, which can make the optimization runs quicker. On my Pro plan, a 500-combo test finishes in about 12 minutes.
Pineify Plans: Breaking Down What You Get
If you're looking to seriously level up your TradingView strategy building, the Strategy Optimizer is the tool you want. It's included in Pineify's Advanced and Expert lifetime plans, which you can check out here: Pine Optimizer on the Chrome Web Store.
Here's a simple breakdown of how the plans stack up against each other:
| Plan | Price (One-Time) | Strategy Optimizer | AI Credits/Month | Notable Extras |
|---|---|---|---|---|
| Plus | $99 | ❌ | 500 | 235+ indicators, AI Coding Agent |
| Advanced | $149 | ✅ | 1,000 | Backtest Deep Report, Signals & Overlays |
| Expert | $259 | ✅ | 2,500 | AI Stock Picker, AI Finance Agent |
Think of the Advanced plan as the sweet spot if your main goal is to build, test, and refine strategies more efficiently. The Expert plan is for you if you also want those extra AI tools to help scan the market and find ideas.
The best part? These are one-time payments for lifetime access. There's no monthly subscription, which makes it a pretty straightforward deal compared to services that nickel and dime you every month. You can grab the extension and see the latest details here: Pine Optimizer on the Chrome Web Store.

Ultimately, the right plan depends on your workflow. If you're focused purely on strategy development, the Advanced plan with its Strategy Optimizer and Backtest Deep Report is incredibly powerful. For traders who want a complete toolkit—from idea generation with the AI Stock Picker to execution and analysis—the Expert plan offers an all-in-one edge. You can explore all features and start building on Pineify's platform directly: Start Now on Pineify.
What Makes Pineify Different from Other TradingView Optimizers
If you've shopped around for TradingView strategy optimizers, you know there are a few options out there. They all promise similar things. But when you dig into the details, Pineify just feels… different. It's not just another tool; it's built for the way traders actually work.
Here's a breakdown of where it really stands out.
-
It Understands More Than Just Numbers: Many optimizers only let you tweak simple number values. Pineify handles that, plus a lot more. It works with whole numbers, decimals, true/false switches, different timeframes, and even those dropdown menus and checkboxes you see in scripts. This means you can optimize strategies that are more complex and realistic, not just oversimplified models.
-
It's Part of a Cohesive Toolkit: You're not getting a one-trick pony. The optimizer connects to the rest of the Pineify ecosystem. Feeling stuck? Use their AI to help generate or explain code. Want to build something visually? Try the strategy builder. Need to validate your results? Their backtest reports give you the kind of deep detail you'd expect from professional software. It all fits together.
-
Your Code Never Leaves Your Computer: This is a big one for privacy. Pineify runs entirely in your web browser. Your trading strategy code isn't uploaded to some remote server for processing. It stays on your machine. You get peace of mind, and there's zero delay from sending data back and forth.
-
It's Actively Evolving: Nothing's worse than finding a cool tool that was last updated years ago. Pineify shows clear signs of active development. For example, they published a detailed tutorial video in March 2026. That recent activity tells you the tool is being maintained, improved, and that there's a team behind it listening to the community. You can watch that tutorial here.
Pineify feels like it was built with a deeper understanding of a trader's workflow and concerns. You can check out the optimizer for yourself at pineify.app/strategy-optimizer.
▶What is the Pineify Strategy Optimizer?
It's a Chrome browser extension that automates parameter testing for trading strategies on TradingView. Instead of manually adjusting settings one at a time, it runs a multi-parameter grid search — testing every combination of values you specify — and displays the results in a sortable table so you can quickly identify the best-performing settings.
▶How do I set up a grid search with the Strategy Optimizer?
After installing the TradingView Supercharged extension, open TradingView and load your strategy. The Pineify panel appears inside the chart interface. For each parameter you want to test, enter a start value, end value, and step size. Click run, and the optimizer automatically cycles through every combination using TradingView's own backtester, populating the results table as it goes.
▶What types of parameters can the optimizer test?
The optimizer supports integer and float inputs (with custom step sizes), boolean true/false toggles, multiple timeframes, and dropdown or checkbox inputs. This means it works with both simple numeric strategies and more complex scripts that use conditional switches or multi-timeframe logic.
▶Does the optimizer upload my strategy code to any server?
No. The extension runs entirely in your local browser and automates clicks within the TradingView tab you already have open. Your strategy code never leaves your computer and is never sent to Pineify or any third-party server. Your trading logic stays private.
▶How does grid search backtesting prevent overfitting?
By testing all combinations systematically rather than cherry-picking a few promising ones, you get a complete performance map across the parameter space. That helps you identify settings that hold up across a wide range of values — a sign of genuine edge — rather than settings that were optimized to fit one specific historical period. I still recommend running walk-forward validation on your top few candidates before trading them live.
▶Can I export the backtest results for further analysis?
Yes. A one-click CSV export downloads every tested parameter combination along with its full performance metrics — net profit, max drawdown, win rate, trade count, and more. You can then analyze the data in Excel, Google Sheets, or Python with pandas and matplotlib.
▶Which Pineify plan includes the Strategy Optimizer?
The Strategy Optimizer is included in the Advanced plan ($149 one-time) and the Expert plan ($259 one-time). Both are lifetime access with no ongoing subscription. The Plus plan ($99) does not include the optimizer but does include the AI Coding Agent and 235+ indicators.