Pineify Market Insights: Track Options Flow, Dark Pool and Smart Money
I used to piece together options chatter, delayed headlines, and single-purpose data feeds until the move was already obvious. That workflow was slow, expensive, and easy to misread. When I started routing everything through Pineify Market Insights, the difference was immediate: one workspace where I could watch large options prints, sector-level sentiment, off-exchange block flow, and congressional disclosures without tab-hopping.
Pineify Market Insights is a market intelligence suite that unifies four data streams — Options Flow, Market Tide, Dark Pool activity, and Congress Trading — so you can cross-check positioning, sentiment, hidden size, and political timing in one place. I've been running it alongside my SPY and NVDA positions since January, and the biggest change is how fast I can rule out bad setups. The suite tracks over 50,000 options trades per day, monitors net premium across 11 sector ETFs, and keeps Options Flow and Dark Pool streams under one second of latency during active sessions.
Four streams, one dashboard
Retail traders often see fragments of the story after institutions have already acted. Options flow can surface aggressive conviction. Dark pool prints show where size changed hands away from the lit tape. Net premium summarizes whether calls or puts dominate. Congressional filings reveal what public officials bought or sold, albeit on a delay. When those signals disagree, I slow down. When they align, I pay attention.
The platform updates in real time: Options Flow and Dark Pool use smart polling during market hours, Market Tide refreshes on a steady cadence, and Congress data updates as new disclosures arrive. Polling pauses when I navigate away and resumes when I return — a small detail, but I appreciate that it keeps my machine predictable during a session.
Options Flow
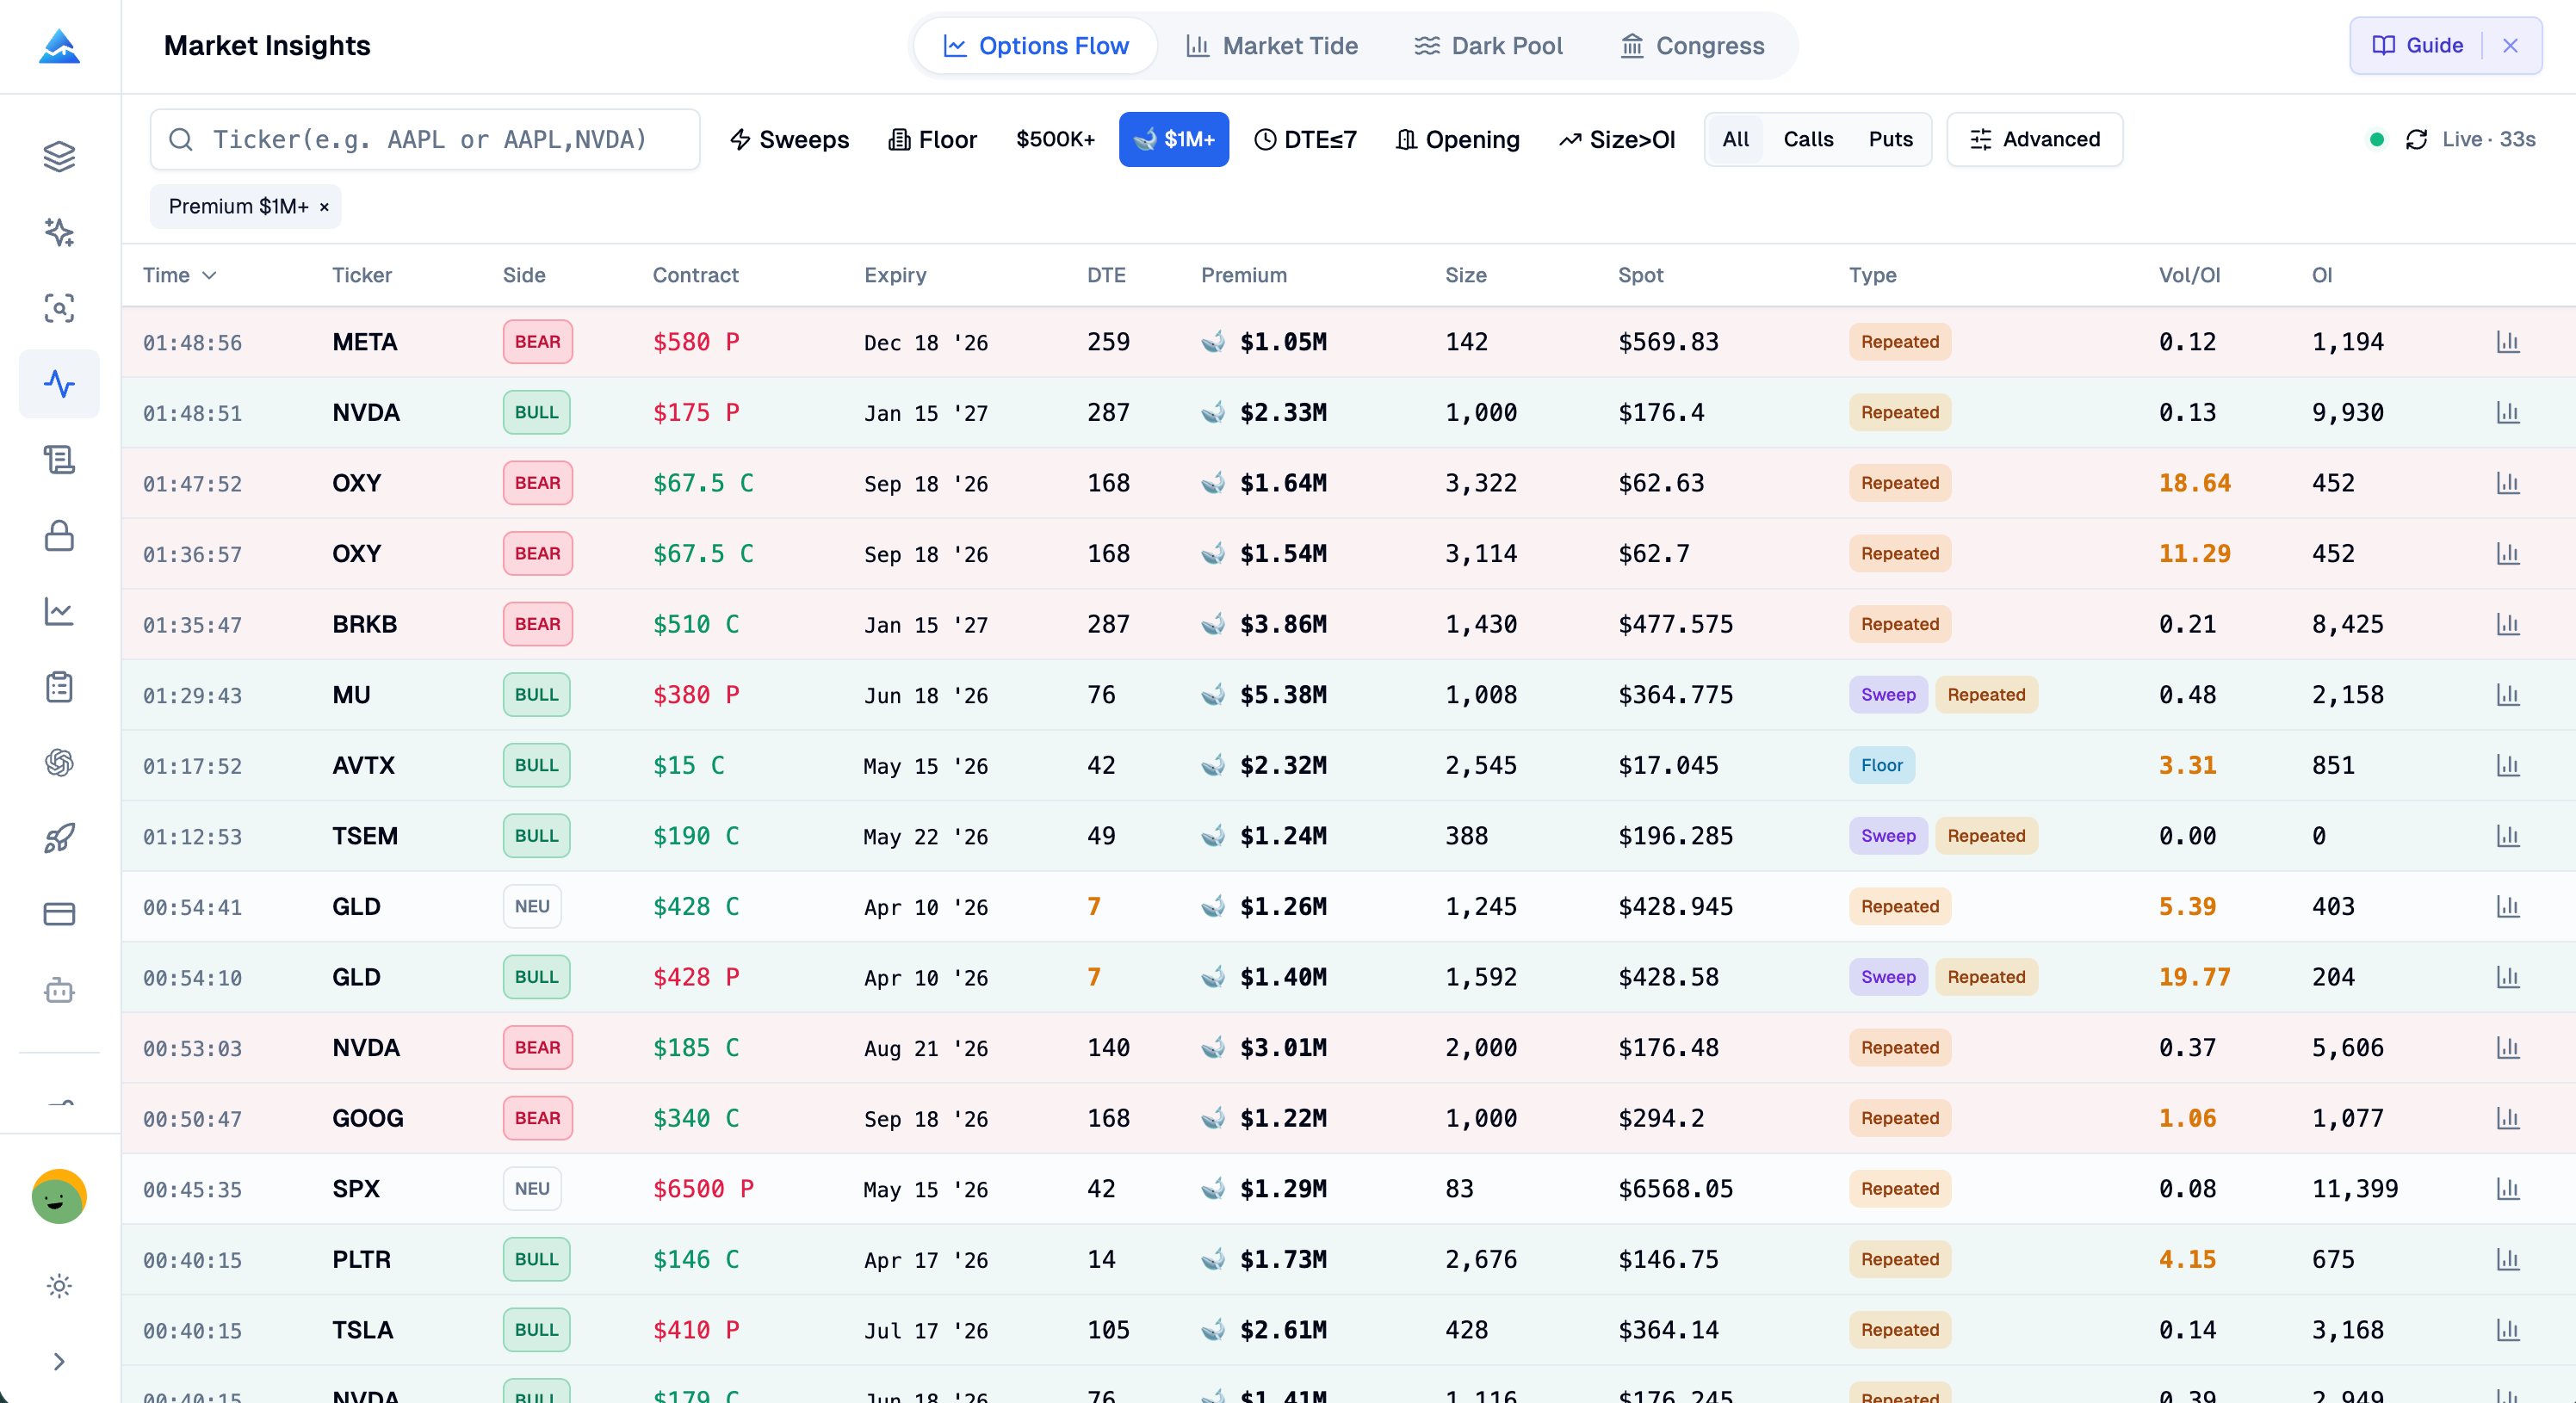
Options Flow is where I watch large and aggressive options trades as they print. The module highlights unusual activity using premium size, volume, and how trades relate to the bid-ask spread. Prints at or above the ask read as more aggressive on the buy side; prints at or below the bid read as more aggressive on the sell side. That simple classification is surprisingly useful when I'm deciding whether a sweep is noise or a deliberate expression of risk.
What I filter and why
I narrow the tape to what actually matters for my book:
- Premium thresholds that match my risk budget, so tiny retail clips don't drown out size
- Sentiment tags that align with how the trade was executed relative to the spread
- Ticker and strategy context, because a bullish call buy and a bullish put spread tell different stories
- Sortable columns, since the first page isn't always the most important print of the day
The expandable trade details help when I need to sanity-check context quickly. I use the flow as an early warning layer, not a guaranteed signal. My rule is simple: flow suggests urgency — everything else confirms it. That said, I don't trust the flow data for illiquid tickers like GNS or DRTS, where the spread is too wide to classify cleanly. If you're scanning small-caps, stick to premium filters above $50,000 to filter out the noise. For a deeper breakdown of how I read unusual prints, check out this options flow analysis guide.
Market Tide
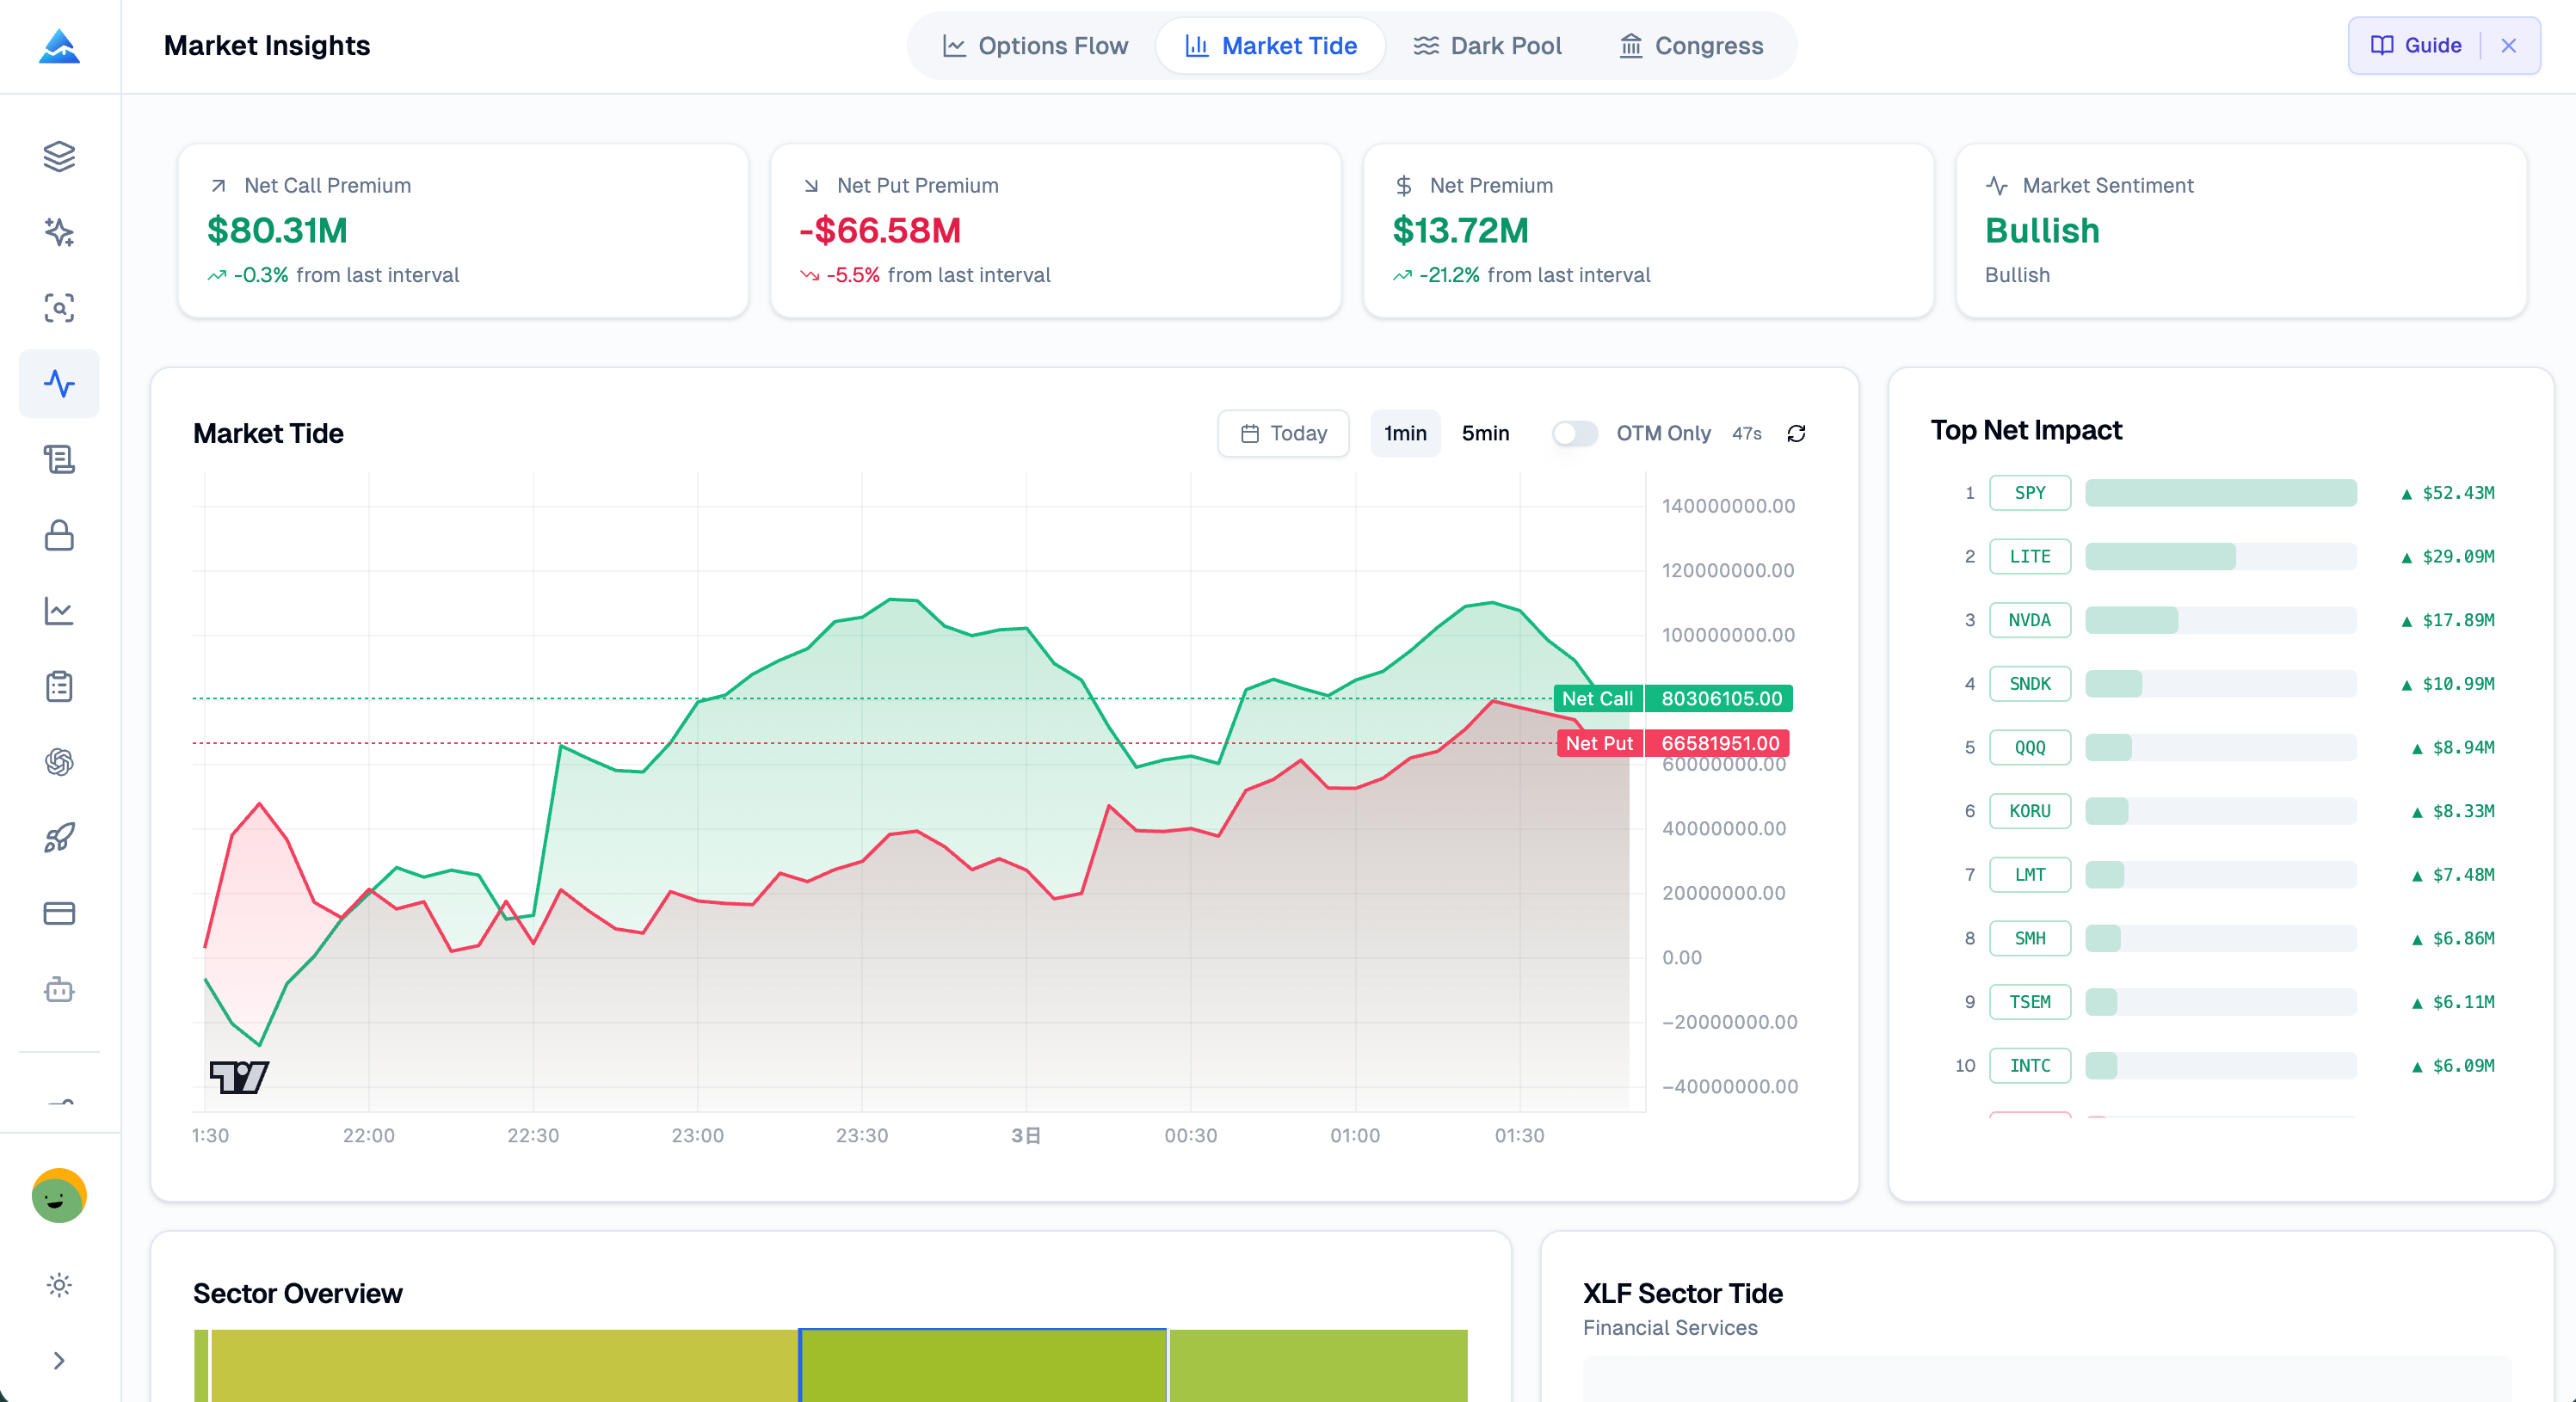
Market Tide measures sentiment by comparing how much premium is going into calls versus puts across the broad market. When net call premium expands quickly, I read that as a risk-on skew in paid positioning. When put premium dominates, I treat it as hedging demand or outright bearish expression, depending on what Options Flow and single-name behavior look like alongside it.
How I read the module in practice
The dashboard combines a few views I check in sequence:
- Net premium time series, to see whether conviction is building or fading over sessions
- A sector heatmap across 11 sector ETFs, to spot rotation without manually rebuilding baskets
- Top net impact names, to find single stocks driving the aggregate skew
- KPI-style sentiment cards, for a fast read before I drill down
I like that Market Tide answers a different question than Options Flow. Flow is about specific prints; Tide is about whether the entire options complex is leaning one direction. When Tide and Flow disagree, I assume something idiosyncratic is happening under the surface — and I usually tighten my stops rather than fade it. I've found Tide more useful than single-stock flow when I'm scanning sector rotation, especially around Fed weeks. If you want to pair sentiment data with an actual AI-powered options strategy, I'd start with Tide for the macro read first.

Dark Pool Intelligence
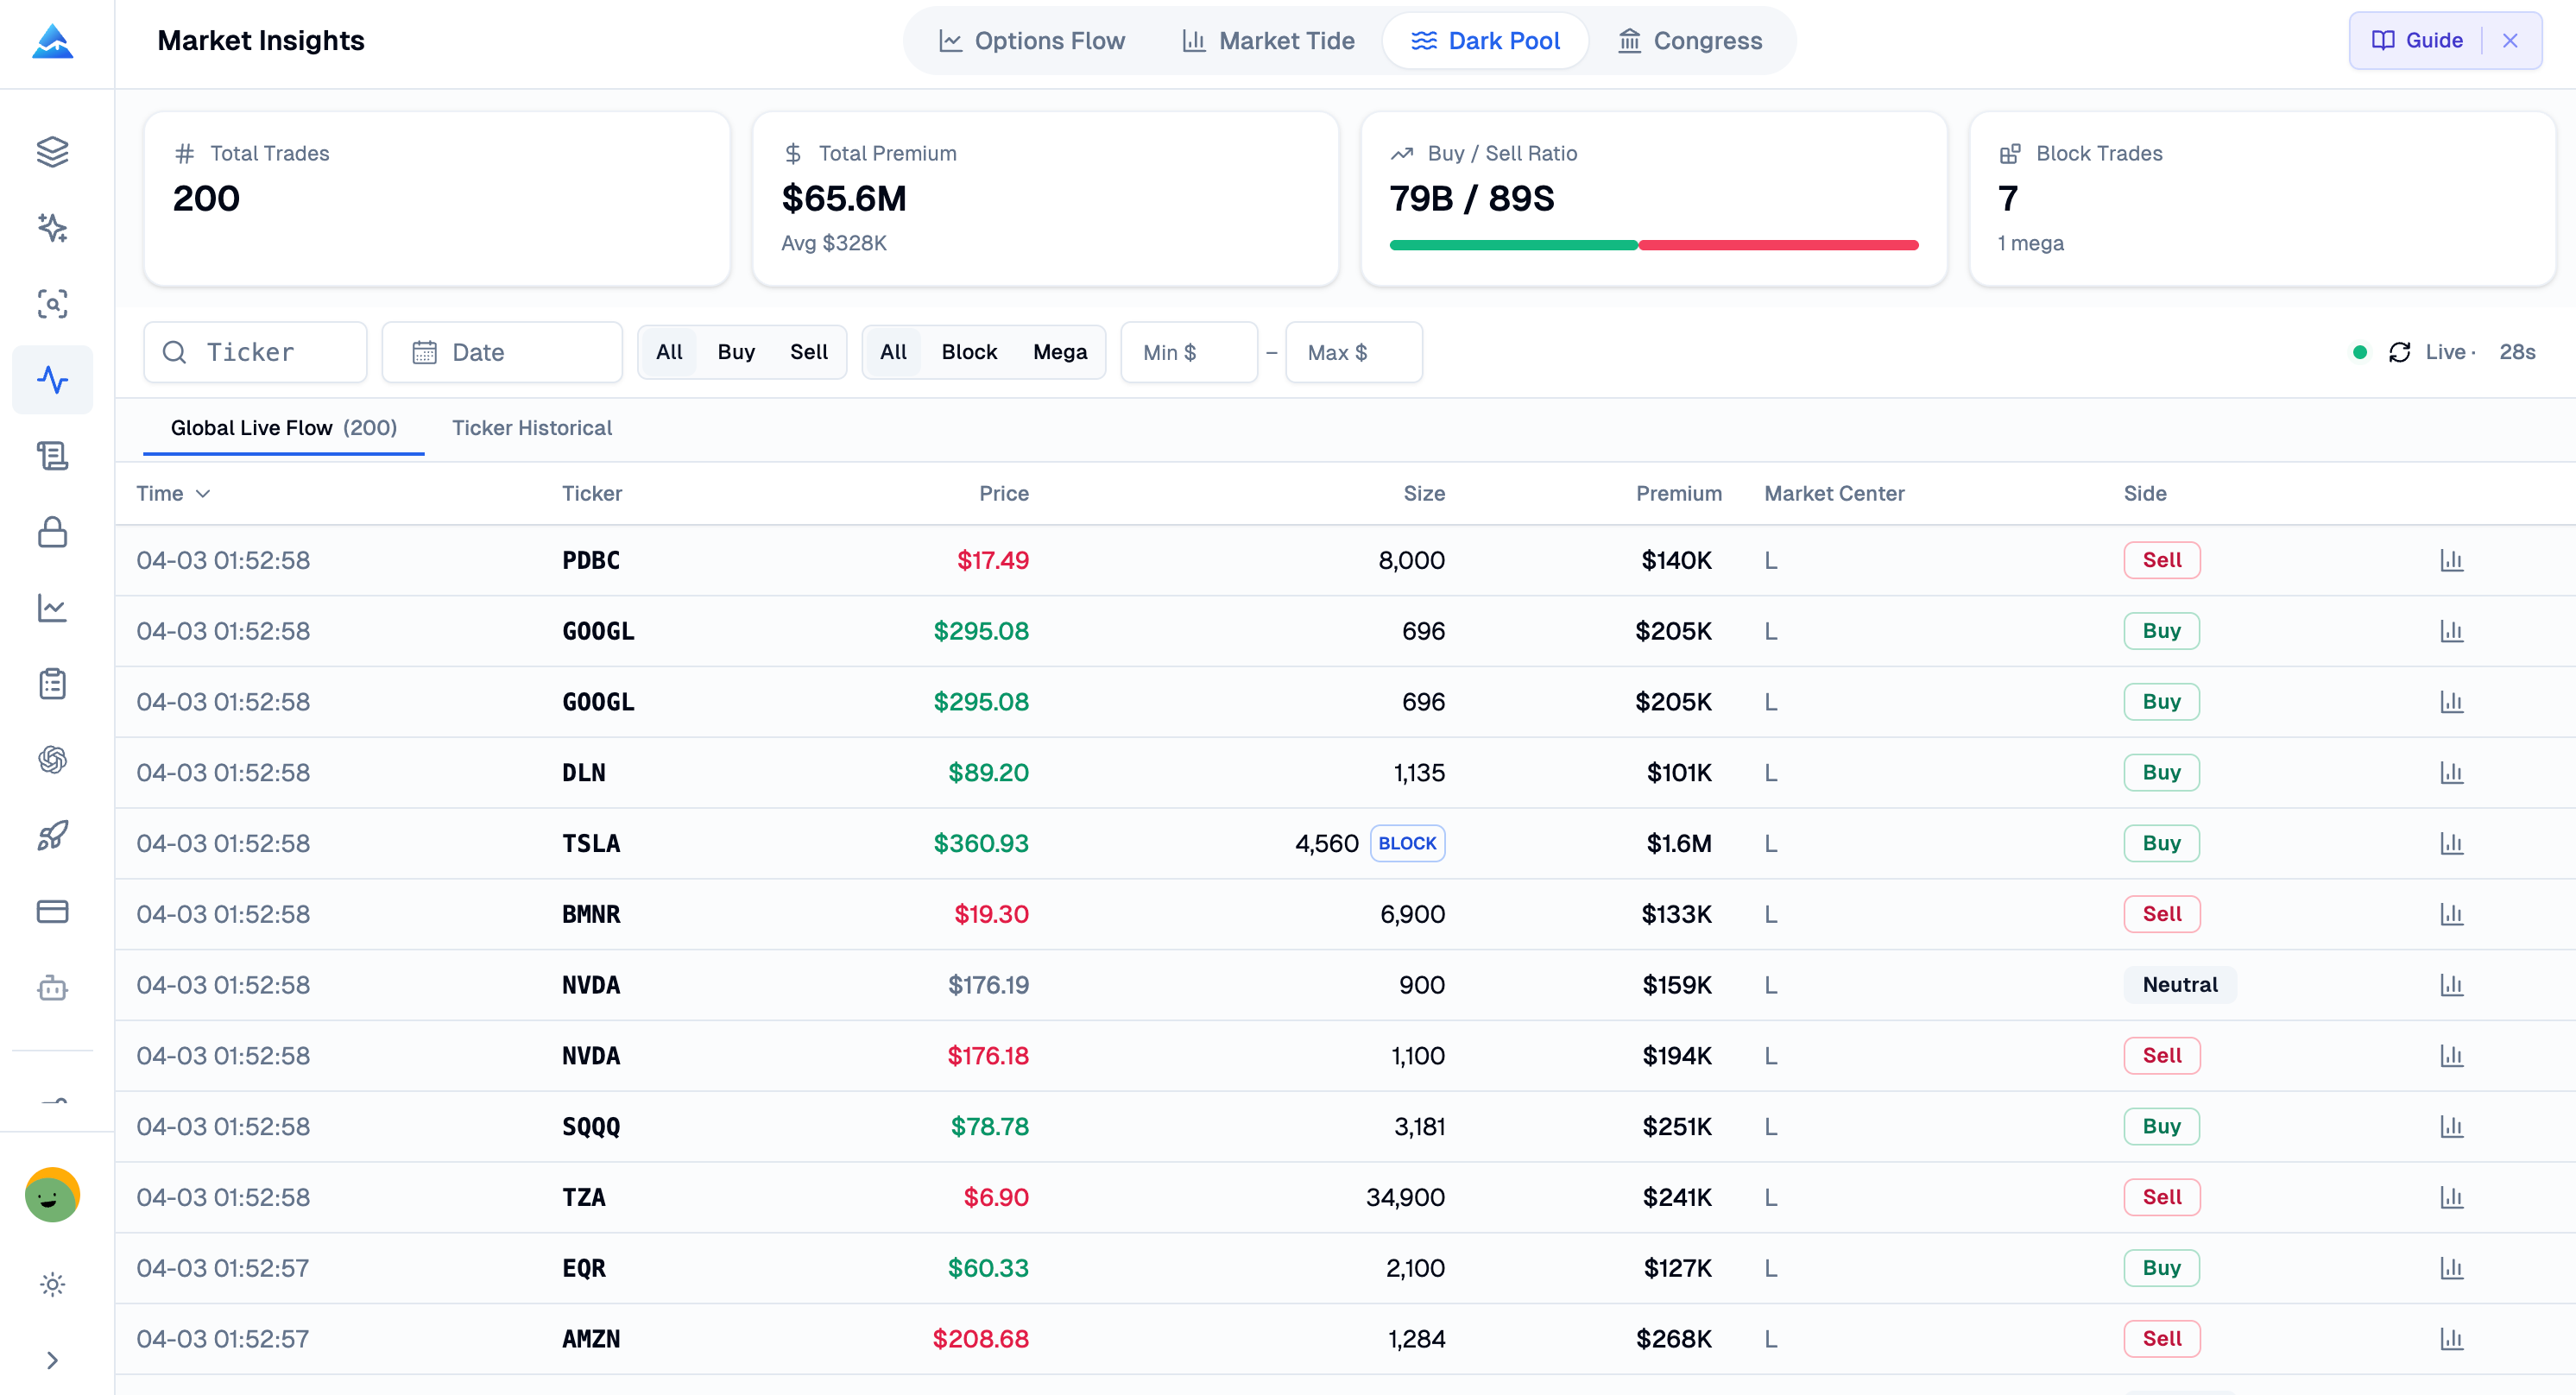
Dark pools are private venues where institutions can work large orders with less immediate market impact than hitting a public exchange. That doesn't make the activity irrelevant — it means the prints show up somewhere else first. The Dark Pool module surfaces block and mega block tiers, infers direction using NBBO context, and visualizes volume at price so I can see where size accumulated.
What I look for in the profile
I use the feed and the volume profile together:
- Block and mega block prints for scale context
- Inferred buy versus sell leaning from NBBO, understanding it's a model, not a confession
- Price-level volume and markers such as point of control and value area, to compare hidden liquidity with visible support and resistance
Dark pool analysis is easy to overfit. I treat it as one lens. If dark pool accumulation aligns with constructive flow and stable Tide, I investigate further. If it conflicts, I downgrade my confidence and wait for price to confirm. I'll be honest — I haven't tested the dark pool data on crypto or forex pairs, so I can't vouch for its usefulness outside equities. For a broader take on institutional dark pool trading signals, there's a separate deep-dive you can cross-reference.
Congress Trading Tracker
Members of Congress and their spouses must disclose stock trades, and those disclosures arrive on a schedule that creates a searchable timeline. The Congress module aggregates filings, supports filters by party and chamber, and flags late disclosures when reporting stretches beyond the intended window. I use it to watch for clusters of activity around sectors I already follow, not to treat every trade as a signal.
How I keep the analysis disciplined
I focus on repeatability and context:
- Politician drill-down pages for pattern review rather than one-off headlines
- Buy versus sell ratios and hot ticker summaries to see where attention concentrates
- Late filing alerts as a hygiene check on how seriously I weight a given name
I'll say it plainly: political trades are lagged by definition, and I don't treat a Nancy Pelosi filing from six weeks ago as a reason to buy today. I pair them with the real-time modules so I'm not trading last month's headline with this week's volatility. I also haven't found the Congress data useful for small-cap names — most disclosures I've seen cluster around mega-caps like NVDA, MSFT, and AAPL, so don't expect penny stock signals here.
How It Works
The only workflow that survived my own bad habits is a three-step loop: pick the right module, stress-test the live feed with filters, and require convergence before I size risk. I don't browse Market Insights — I interrogate it.
- Choose the module that matches the question. If I'm hunting urgency, I start in Options Flow. If I want broad skew, I open Market Tide. If I care about hidden size, I open Dark Pool. If I'm researching policy-sensitive names, I open Congress.
- Analyze live data with filters that match my horizon. I let the tools update during market hours, drill into details when something spikes, and write down the hypothesis before I trade — that way I don't retrofit a story to the chart after the fact.
- Act only when multiple modules agree, or when one module gives me a clear risk-defined reason to fade the crowd. Confidence, for me, is overlap, not volume of alerts.
Who Should Use Market Insights?
The traders who get the most mileage are the ones who treat latency and cross-checks as risk controls, not entertainment. Systematic day traders and active swing traders gain the most from sub-second flow and dark pool context because timing and liquidity matter. Longer-term investors still benefit from Tide and Congress views when they want a quarterly read on sentiment skew and disclosure patterns. I'm somewhere in the middle: I care about execution quality, but I also want sector context without building spreadsheets by hand.
If you currently pay for one narrow feed, the practical win is cross-verification. A single stream can lie by omission. Four complementary streams make omissions easier to spot.
Frequently Asked Questions
▶What is Pineify Market Insights?
It's a four-module intelligence suite inside Pineify that combines Options Flow, Market Tide, Dark Pool prints, and Congress disclosures. I use it when I want institutional-style context without juggling separate vendors for each dataset.
▶How does Options Flow classification work?
The tool evaluates trades in real time and uses execution price relative to the bid-ask spread to label aggressive buying or selling. I combine those tags with premium and volume filters so the feed stays relevant to my watchlist.
▶Why should I care about dark pool activity?
Institutions often work size away from the public tape first. Monitoring dark pool prints helps me see where large trades clustered and how volume built at price, which I compare to visible levels on the chart.
▶How does Congress tracking handle timing and rules?
Disclosures are aggregated as they're filed. I filter by politician, party, chamber, and ticker, and I watch for late filing flags so I know when reporting slipped beyond the normal window.
▶What does Market Tide measure?
Market Tide tracks net premium flow by comparing call premium to put premium across the market, with sector breakdowns across 11 sector ETFs. I use it as a broad sentiment gauge, not as a timing trigger by itself.
▶Is the data real-time?
During market hours, Options Flow and Dark Pool update with smart polling that targets under one second of latency for those streams. Market Tide refreshes on a timed cadence, and Congress updates as new filings appear. Polling pauses off-tab and resumes when I return.
▶How does this compare with standalone tools?
Many products sell one stream. I prefer one dashboard where I can cross-reference flow, tide, dark pool, and disclosures without exporting CSV files between browsers.
▶What does scale look like in practice?
The platform tracks more than 50,000 options trades per day, monitors 11 sector ETFs inside Market Tide, follows 535 or more Congress members, and keeps the fastest modules responsive with sub-second latency when markets are open.