Edgewonk vs Pineify Trading Journal: Best Performance Tracker?
Every serious trader hits a point where spreadsheets stop cutting it. You need a tool built for trade analysis. A trading journal is a system that records your trades, strategies, and emotions, giving you data instead of guesses. Edgewonk and Pineify Trading Journal are two of the strongest options — and I've used both.
Here's my verdict up front: Pineify wins for cost-conscious traders who prefer manual logging and already live in TradingView. Edgewonk takes the prize for automated-import fans who need deep psychology analytics. Neither is perfect, and I'll show you the real trade-offs.
Edgewonk: Over a Decade of Trade Analytics
Edgewonk has been around for more than ten years, helping traders log over 7 million trades. Its core philosophy: most traders don't need a new strategy — they need to see why their current one is underperforming.
The standout feature is the Edge Finder, an AI tool that scans your weekly trades and analyzes hundreds of data points to pinpoint actual strengths and weaknesses. Setup is easy thanks to support for 200+ brokers, covering Forex, Stocks, Futures, Crypto, and more. If you want auto-import and minimal manual entry, this breadth of compatibility matters.
I signed up for Edgewonk in January 2025 and imported about 180 trades across AAPL and TSLA before the analytics started to click. The Edge Finder flagged something I hadn't noticed: my entries were fine, but I was consistently exiting too early on winning trades. That alone was worth the subscription.
Pineify Trading Journal: Manual Logging with Purpose
Pineify takes a different path. Instead of automated import, it's designed around pausing to log each trade yourself. I was skeptical at first — it felt like extra work. But after three months of using it for my NVDA and SPY trades, I changed my mind. That manual step forces you to reconnect with the reasons behind the trade: the setup, your emotional state, the outcome. The lessons stick better.
The journal comes from the team behind the Pineify platform, which started as a helper for traders who code their own Pine Script indicators on TradingView. If you build custom strategies, it feels like a natural extension. Understanding technical tools like the Ehlers Dynamic Smoothed Moving Average Indicator on TradingView can feed directly into your journal notes.
The journal is organized into four modules:
| Module | What It's For |
|---|---|
| Trade Log | Record every trade, entry/exit, and your notes. |
| Strategies | Group trades by strategy to see what's working. |
| Diary | Free-form space for market thoughts and emotions. |
| Sessions | Pre-market prep and post-market review routines. |
The big time-saver: Pineify automatically generates weekly and monthly reports from your data. I haven't tested Pineify's auto-reports against Edgewonk's analytics side-by-side for the same period — my experience comes from separate months with each tool. But the auto-generation makes it far easier to stay consistent.
Core Analytics: Depth vs. Clarity
The two tools approach trade analysis from opposite directions.
Edgewonk is built for deep dives. You can filter by asset, time of day, emotional state, stock float, or entry quality. It tracks Expectancy and R-Multiples, and its Underwater Chart shows drawdown depth clearly. The Edge Finder runs a weekly AI scan against millions of historical trades to find your single biggest weakness.
Pineify focuses on fast, readable insights. You get Net P&L, Win Rate, Profit Factor, plus Sharpe and Sortino ratios — all on one dashboard. A daily P&L chart shows consistency at a glance. Its Reports module auto-generates weekly and monthly summaries by symbol, long/short, and strategy, including best and worst trades. For traders who also rely on technical indicators, pairing this with the Best Stop Loss Indicator on TradingView can strengthen both journaling and risk management.
| Feature | Edgewonk | Pineify Trading Journal |
|---|---|---|
| Win Rate & Profit Factor | ✅ | ✅ |
| R-Multiple Tracking | ✅ | ✅ (auto-calculated) |
| Sharpe / Sortino Ratio | ❌ | ✅ |
| Equity & Drawdown Charts | ✅ (Underwater Chart) | ✅ (Equity Curve + ROI) |
| AI-Driven Analysis | ✅ (Edge Finder) | ✅ (AI credits-based) |
| Broker Auto-Import | ✅ (200+ brokers) | ❌ (Manual-first) |
| Partial Close Support | Limited | ✅ Full support |
| Session-Based Analytics | ✅ | ✅ (Sessions Module) |
| Weekly/Monthly Reports | Manual | ✅ Auto-generated |
| Multi-Journal Support | ✅ | ✅ |
I prefer Pineify's dashboard for quick weekly check-ins. But if I needed to audit a specific losing streak in detail, I'd open Edgewonk.
Psychology Tools: Automated vs. Reflective
Psychology is often the real reason traders fail. Both tools address it, but differently.
Edgewonk's Tiltmeter automatically detects when you break your rules or trade emotionally. It flags those trades and shows you the dollar cost. After using Pineify's Diary module for two months, I noticed a pattern: my confidence was lowest after three consecutive losses — something I'd never tracked before. Edgewonk's Tiltmeter would have caught this automatically; Pineify required me to log it manually and then notice the pattern in my reports.
| Feature | Edgewonk | Pineify |
|---|---|---|
| Primary Tool | Tiltmeter | Diary Module |
| Approach | Automated detection of emotional & rule-break trades | Structured daily reflection & self-rating |
| Best For | Traders who want alerts when their mindset slips | Traders building a consistent mindfulness routine |
If you want an automated nudge when you're tilting, Edgewonk's Tiltmeter is hard to beat. If you prefer a structured daily habit that builds awareness over time, Pineify's Diary works well. I'd say the automated approach is better for newer traders — I wish I'd had it when I started.
Organizing Your Trading by Strategy
Grouping trades by strategy turns a pile of data into actionable reports. Both tools let you tag each trade with the strategy you used, then filter results to see which setups actually make money.
Why this matters: instead of guessing, you get a clear report card per strategy. Win rate, profit factor, and drawdown per setup. The losing strategies become obvious, and you can retire them faster.
Planning before the market opens is a natural companion. You outline your entry, exit, stop loss, and rationale. After the trade, you compare results against the plan. Both Edgewonk and Pineify support this workflow. For technical traders who embed indicator logic into their plans, a Gaussian Channel Indicator for TradingView Pine Script can provide concrete, rule-based entry and exit criteria.
Cost Comparison: Subscription vs. Lifetime
Price is often the deciding factor.
| Feature | Edgewonk | Pineify Trading Journal |
|---|---|---|
| Pricing Model | Annual Subscription | One-Time Lifetime Payment |
| Cost | $169 per year | $149 (lifetime, discounted from $219) |
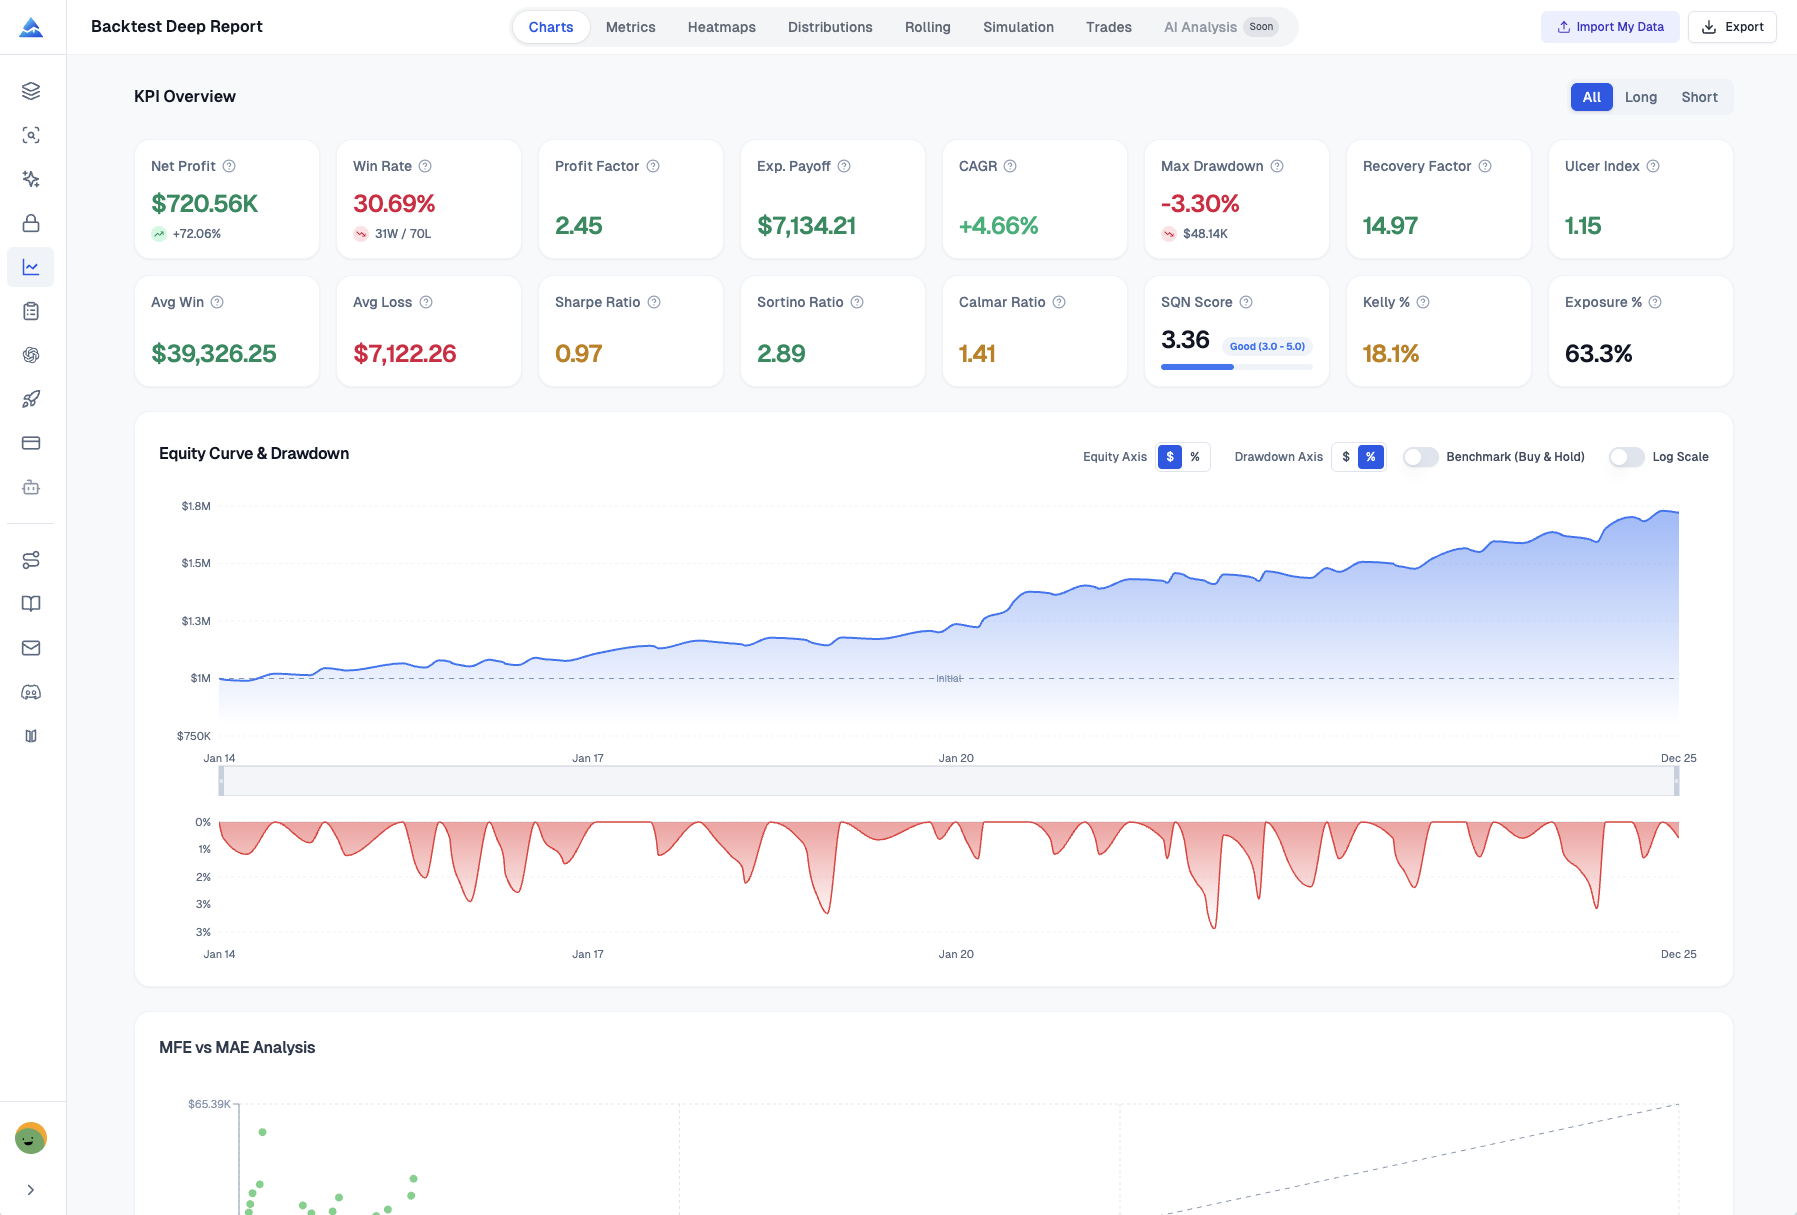
| What's Included | Access to all features, markets, and trading styles. | The journal plus the Strategy Optimizer, Deep Backtest Reports, and AI coding tools. |
| Refund Policy | 14-day refund period. | Included with the lifetime purchase. |
Pineify's lifetime deal is compelling if you dislike recurring bills. Over three years, you save roughly $350 compared to Edgewonk's subscription. That said, Edgewonk's model includes ongoing development and infrastructure costs — you're paying for continuous improvement.
Which Platform Is Right For You?
Choose Edgewonk if:
- You want automated psychology detection with the Tiltmeter and Edge Finder.
- You trade through a broker that supports auto-import (200+ options).
- You trust a platform refined over a decade with millions of trades.
Choose Pineify Trading Journal if:
- You prefer a one-time payment over subscriptions.
- You value a clean, modular interface organized into four sections.
- You trade on TradingView and use Pine Script.
- You want weekly and monthly reports generated automatically.
- You use partial closes or maintain separate journals per strategy.
Frequently Asked Questions
▶What's the real difference between Edgewonk and Pineify Trading Journal?
Edgewonk focuses on deep psychological analysis with automated tools like the Tiltmeter and Edge Finder, while Pineify emphasizes structured manual logging with automatic report generation. Edgewonk uses annual subscriptions; Pineify offers a one-time lifetime payment. Edgewonk supports auto-import from 200+ brokers; Pineify takes a manual-first approach built for TradingView users.
▶How does Edgewonk auto-import trades from a broker?
Edgewonk connects directly to over 200 brokers. Once linked, it pulls your trading history — entry and exit points, position size, and P&L. This eliminates manual data entry and frees you to focus on analysis.
▶What is the Tiltmeter in Edgewonk?
The Tiltmeter automatically detects emotional trading or rule-breaking. It scans your trades and flags when frustration or overconfidence may have influenced decisions, then shows the financial impact of those emotional trades.
▶Does Pineify Trading Journal generate automatic reports?
Yes. Pineify creates weekly and monthly reports from your logged trades automatically. These break down performance by symbol, long/short position, and strategy, including your best and worst trades each period. Visit the Pineify platform for more details.
▶Which journal works better for day traders?
Both work well. Pineify has a Sessions module for tagging specific market windows like the London Open or New York session. Edgewonk offers time-of-day filters for granular review. The choice depends on whether you prefer manual logging with auto-reports (Pineify) or automated import with psychology analytics (Edgewonk).
▶Does Pineify offer a one-time payment option?
Yes. Pineify Trading Journal costs $149 for lifetime access (discounted from $219), which includes the journal, Strategy Optimizer, Deep Backtest Reports, and AI coding tools. Edgewonk charges $169 per year, so Pineify becomes more cost-effective over time.