Google Sheets Trading Journal: Track Your Performance
A Google Sheets trading journal is a free spreadsheet where you record every trade and measure what actually works. It turns your trade history into organized data so you can spot patterns, refine your approach, and catch bad habits before they compound.

Why a Journal Changes Your Trading
Trading without a journal means trusting your memory, and memory is unreliable. You remember the big wins and forget the sloppy losses. A good journal captures the full story behind each decision.
I started my first journal in early 2024, and within two months I spotted something I'd missed for years: I was taking bigger positions after two wins in a row, and those trades accounted for roughly 70% of my losses. That pattern was invisible until I had the data in front of me.
When you log trades consistently:
- Random events become measurable facts.
- You see your real strengths and the habits holding you back.
I also started noting how I felt before each trade — rushed, overconfident, impatient. After about a month, a pattern emerged: my worst trades happened when I felt most "sure" about the setup. The trades I entered with doubt actually performed better. It was the opposite of what I expected.
What Your Journal Needs
The Core Columns
Start here: Date, Asset, Entry Price, Exit Price, Position Size. Add Buy/Sell, don't skip Fees (they add up faster than you think), then Gross P/L, Net P/L, and Notes.
Tailor it to what you trade. Options traders should add Strike Price, Expiration Date, Contract Type. Crypto traders should use pairs like BTC/USDT instead of stock tickers. I used generic "Crypto" for everything my first month and couldn't tell which coins were driving my P&L.
The "Why" Column
Prices tell you what happened. The "why" column tells you why it keeps happening — and that's the one that changes your trading.
Write down your strategy, setup, market sentiment, and especially your pre-trade rationale. Why did you enter at that price at that moment? What did you expect to happen?
I've found that most of my bad entries happened because I skipped this step. When I forced myself to type the reason before clicking buy, roughly half those trades never happened. Writing it out revealed how weak the logic was. For more on data timing and setup, read Why Is My TradingView Delayed? Full Guide to Real-Time Market Data.
Key Metrics
| Metric | Target Range | Purpose |
|---|---|---|
| Win Rate | 50-65% | Measures strategy reliability |
| Risk/Reward Ratio | Minimum 1:2 | Validates position sizing |
| Profit Factor | Above 1.5 | Gross profit divided by gross loss |
| Maximum Drawdown | Under 20% | Risk management effectiveness |
| Average Win/Loss | Above 1.5:1 | Confirms position sizing |
Don't just calculate these — act on them. A 65% win rate looks great until your average loss is three times your average win. I ran a 58% win rate for six months and still lost money. That's what forced me to rework my position sizing.
How to Build It
Step 1: Set Up Columns
Open a new sheet and name it something memorable — "Trading Log 2025" or "Options Journal."
Columns you need: Date, Ticker, Action, Quantity, Entry Price, Exit Price, Fees, Gross P/L, Net P/L, Notes.
Why this matters: A consistent structure means you never guess where data goes when you're rushing to log a trade right after market close.
What can go wrong: If you skip formatting (dates as plain text, prices as general numbers), your formulas will silently fail. I learned this when my January P/L showed $4,000 but was actually $40 — Sheets had treated a decimal as text. Fix it upfront: select the columns, open the Format menu, and set the right type before entering data.
Step 2: Add Formulas
Instead of using a calculator:
- Gross P/L:
=(Exit Price - Entry Price) * Quantity - Net P/L:
=Gross P/L - Fees - P/L %:
=Net P/L / (Entry Price * Quantity)
Why automate: Manual math invites mistakes. I've typed the wrong exit price more times than I want to admit.
What can go wrong: If you drag formulas down before testing one row, a single typo in row 1 propagates silently across all your data. Enter the formula in row 2, verify the result, then drag.
Step 3: Structure for Insight
Filters and separate sheets turn a log into an analytics tool.
- Filters: Data > Create a filter. Sort by ticker, date range, or strategy in one click.
- Separate tabs:
- Trade Log — every entry and exit.
- Dashboard — key metrics pulled from the log (
=COUNTIF(Trade Log!K:K, "Win")). - Monthly Reviews — duplicate the log each month.
Why it works: A single long list is noise. A dashboard forces you to look at the summary, not the raw data. I review my dashboard every Sunday evening — it takes five minutes and catches problems early.
What can go wrong: If your dashboard formulas reference the wrong tab, the numbers look correct but aren't. Cross-check a known value before trusting the dashboard.
For traders who want to take this further, check out Automated Trading Strategies Complete Guide 2025.
When and How to Review
Daily: Capture While It's Fresh
Log each trade within 15 minutes of closing. Write down:
- Why you entered
- What changed during the trade
- How you felt at exit
Do this before you check your daily P&L. I've noticed that knowing the dollar figure first changes how I describe the trade — I downplay losses and inflate wins. Log first, check later.
Weekly: Find the Patterns
Pull your win rate, total P/L, and compare strategies. Last November I noticed my win rate on SPX options dropped to 38% — but only on Wednesdays. Without the weekly review, that pattern would have stayed hidden.
Monthly: Check Your Trajectory
Are you actually improving? Compare this month to last on three metrics: win rate, average risk/reward, and maximum drawdown. If all three move in the right direction, you're on track. If one slips, investigate before it pulls the others down.
Customize It
A day trader could add columns for entry time, exit time, and trade duration. I trade mostly in the first two hours of market open, so tracking entry time was the single most useful change I made.
A swing trader would track holding period in days and fundamental triggers. There's no single right setup. Start with the core columns and add what matters to your process. I add and remove columns every quarter based on what I'm trying to learn about my trading.
I actually prefer building my own sheets instead of using templates — copying someone else's format never quite fit my workflow. But that's personal. A template might work better for you.
When to Move Beyond Google Sheets
Sheets is free and flexible, but it has limits. Here's when I'd say it's time for a dedicated tool:
You're spending too much time on data entry. More than 15 minutes a day logging trades is time you're not analyzing. I hit this wall around trade 200 — manual entry became a chore and I started skipping it.
Your questions outgrow your formulas. Want to filter by holding time under 10 minutes, or calculate R-multiple per trade? Sheets can do it, but the formulas get fragile. One wrong click breaks everything.
You're juggling multiple accounts. Data scattered across three sheets for different brokers means you have no single source of truth. Dedicated journals consolidate everything.
| Spreadsheet Limits | Dedicated Solution |
|---|---|
| Manual data entry | Automated trade imports |
| Breakable formulas | Built-in analytics |
| Disconnected files | Unified dashboard |
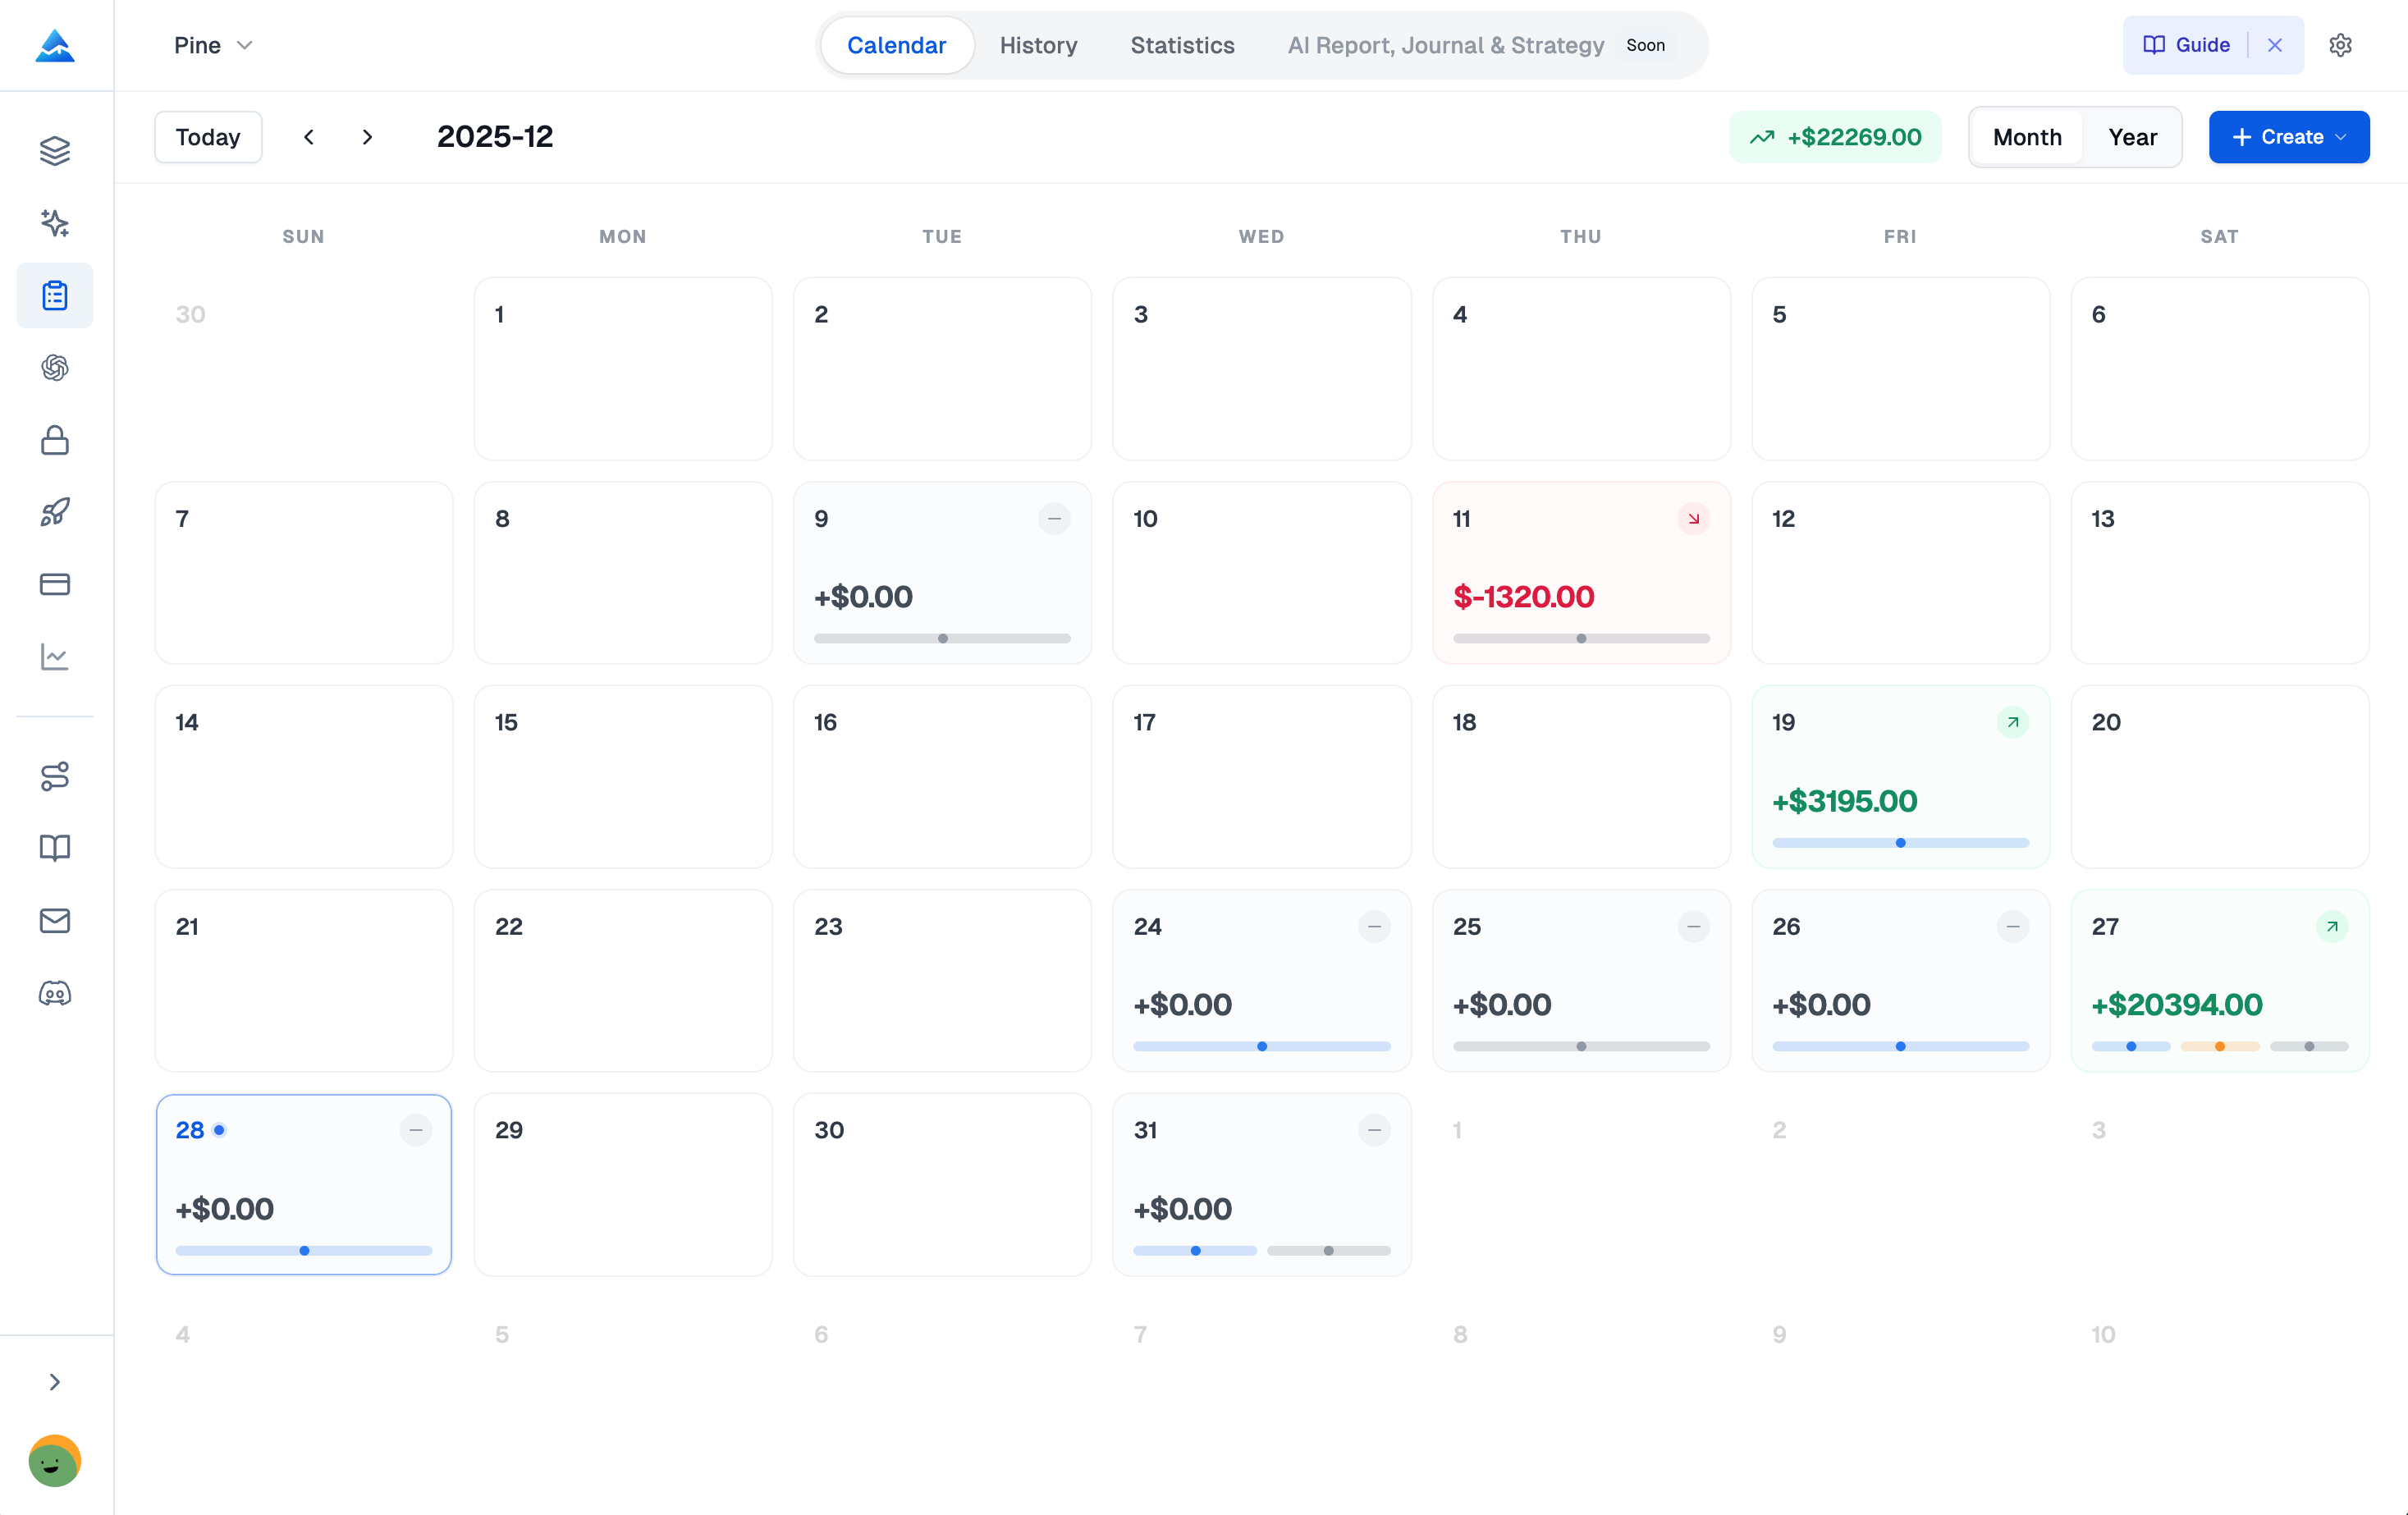
I still use Sheets for quick notes, but I moved my main journal to Pineify when manual logging started costing me time I could spend analyzing. I haven't tested every journal tool out there, so I can't offer a full comparison, but the shift from manual entry to auto-logging saved me roughly 10 hours a month. Pineify also includes strategy builders and AI coding agents that go beyond what a spreadsheet can do.
Common Mistakes
Even a good journal won't help if you fall into these traps:
- Skip entries. Every missed trade is a blind spot. Make logging part of closing the trade, not a separate task you do later.
- Only track winners. This is the most common mistake I see. People remember losses but log wins. A journal isn't a trophy case — the losses teach you the most.
- Leave out context. Price and P&L are useless without the "why." My most valuable journal entries are the ones where I explain exactly why a bad decision happened.
- Let it get messy. If you dread opening the file, you won't review it. Keep the structure clean from day one.
For more on structuring exits, see ATM Strategy TradingView: Complete Guide to Advanced Trade Management.
Frequently Asked Questions
▶What should I put in my Google Sheets trading journal?
Start with Date, Asset, Entry and Exit Price, Position Size, and strategy. Add Fees, Gross P/L, and Net P/L. The Notes column is the most useful — write down why you took the trade and how you felt. Use formulas to auto-calculate win rate, average risk/reward, profit factor, and max drawdown.
▶How often should I look at my journal?
Daily: log every detail right after trading. Weekly: run the numbers and look for patterns — losing on a specific strategy or day. Monthly: zoom out to see if your adjustments are moving you toward bigger goals.
▶Can I use Google Sheets for day trading, options, or crypto?
Yes. Day traders add Trade Duration and Time of Day. Options traders need Strike Price and Expiration Date. Crypto traders use pairs like BTC/USD. The tracking principles are the same across all styles.
▶What is the single most important metric?
Trade Expectancy. It combines win rate with average win and loss sizes. A positive number means your strategy works over time. A negative number means it doesn't, even if you've had lucky wins.
▶Is a free template enough, or do I need paid software?
Sheets is fine for starting out. Switch when you want automatic broker sync, need complex analytics in one click, or manage multiple accounts that need a single dashboard.
▶How do I calculate P&L automatically?
=(Exit Price - Entry Price) * Quantity for Gross P/L. =Gross P/L - Fees for Net P/L. =Net P/L / (Entry Price * Quantity) for the percentage return. Enter these in the first data row and drag down so every new trade calculates instantly.
Start Your Journal Today
The gap between traders who improve and those who stay stuck is rarely a secret strategy. More often it's the habit of tracking performance and reviewing it regularly.
Open a new spreadsheet. Set up the columns. Log your next trade. Don't skip the notes about what you were thinking — that's the part that teaches you something.
Your first month:
- After week 1: Calculate your win rate and average win/loss. Just seeing those numbers will tell you something you didn't know.
- After month 1: Look for patterns across days of the week or times of day. I traded worse on Mondays for six months before I had enough data to confirm it. That insight came from the journal, not intuition.
To build a more complete trading setup as you grow, you might also find AMP Futures TradingView Integration: The Complete Guide to Professional Futures Trading useful.
Serious traders don't wing it. They use a system to learn from every trade. Your Google Sheets journal is that system. Log the data, review the numbers, make one small adjustment, and repeat.