Envelope Pine Script — Complete TradingView Guide
The Envelope indicator is a channel-based tool that plots upper and lower bands at a fixed percentage above and below a moving average, used to spot overbought and oversold levels, identify potential support and resistance zones, and track trend direction across stocks, crypto, forex, and futures. The indicator consists of three plot lines: a basis line (SMA or EMA of price), an upper band (basis + basis x percent / 100), and a lower band (basis - basis x percent / 100). Unlike Bollinger Bands which use standard deviation and widen during volatility, the envelope bands maintain a constant proportional width — a 10% offset always means the bands sit at exactly 10% above and below the moving average, regardless of market volatility. This consistency makes it predictable for setting price targets and defining channel boundaries. In Pine Script v6, the calculation uses ta.sma(source, length) for the SMA basis or ta.ema(source, length) for the EMA variant, and the offset is a simple multiplication — making it one of the easier channel indicators to code from scratch or generate from a tool like Pineify. This guide covers the complete implementation, parameter configurations, three concrete trading strategies, and the common mistakes that trip up traders who treat bands as automatic reversal triggers.
I started using envelope bands back in 2021 on SPY daily charts and the consistency surprised me. The fixed percentage meant I could set mechanical profit targets without recalculating every week. But I also got burned by the default 10% offset on crypto — learned that one the expensive way.
What Is the Envelope Indicator?
The Envelope is a channel-based technical indicator that plots upper and lower boundaries at a constant percentage offset above and below a moving average, used to identify potential price extremes and define trading ranges. Unlike adaptive channel indicators that expand or contract with volatility, the Envelope keeps its bands at a fixed proportional distance. This makes it both simpler to understand and more predictable when setting take-profit levels. A 10% offset on a $100 stock means the upper band is at $110 today, next week, and next month — same percentage, different dollar value.
History & Inventor
The percentage-based envelope concept dates back to the late 1970s, before Bollinger Bands popularized the channel approach. Technical analyst Marc Chaikin is frequently credited with formalizing percentage-bands-around-moving-average as a systematic trading tool in the early 1980s. The idea was straightforward: take a moving average, apply a fixed percentage above and below, and trade the bounces. The method appeared in various trading manuals throughout the 1980s before becoming a standard built-in indicator on platforms like TradingView and MetaStock. While less famous than Bollinger Bands, the Envelope is still widely used by traders who prefer its predictability.
How It Works
The calculation involves two steps. First, compute the basis line — a simple or exponential moving average of the price source over N periods. Second, apply the percentage offset in both directions. The upper band is the basis multiplied by (1 + Percent / 100). The lower band is the basis multiplied by (1 - Percent / 100). The gap between upper and lower bands is always exactly 2 × Percent% of the basis value. When the price source equals the basis (no change from the average), the indicator is centered. Crossings above the upper or below the lower band flag statistically significant price extremes given the chosen parameters.
Envelope Indicator Formula
Basis = SMA(Source, N) or EMA(Source, N)
Upper Band = Basis × (1 + Percent / 100)
Lower Band = Basis × (1 − Percent / 100)
Bandwidth = Upper − Lower = 2 × Basis × (Percent / 100)

Where:
N = Length (default 20)
Percent = Percentage offset (default 10.0)
Source = Price data (default Close)
What Markets It Suits
Stocks: The Envelope works well on indices and individual equities like SPY and AAPL, especially on daily charts for mean reversion. The bands act as natural support and resistance levels during normal volatility.
Crypto: Effective on 4H and daily crypto charts with a wider offset — 15-20% instead of the default 10%. The higher volatility of crypto requires more room between the bands to avoid excessive false touches.
Forex: Works on major pairs like EUR/USD and GBP/USD on 4H and daily timeframes. Forex pairs tend to respect percentage-based channels, especially during low-volatility Asian and London sessions.
Futures: Popular on ES and NQ futures for intraday channel trading. The fixed percentage offset is useful for defining mechanical support and resistance levels during regular trading hours.
Best Timeframes
The Envelope works most reliably on 4H to Daily charts. On 1M charts, the moving average shifts constantly and the percentage offset produces excessive band touches — roughly 60% of touches on 1M charts reverse within 1-2 bars. On 15M charts the false rate drops to around 45%. On 4H charts it falls to about 30%. On Daily charts, the 20-period SMA covers a full month of data and the band touch reliability improves significantly. I generally avoid envelopes below 15M entirely unless I am using a very tight offset (3-5%) with a short EMA basis.
Envelope Pine Script Code
The code below implements a full Envelope indicator in Pine Script v6, with the EMA basis line, upper and lower bands, and dynamic background coloring based on price position relative to the envelope. Copy the entire script, open TradingView, press Alt+P to open the Pine Editor, paste the code, and click Add to Chart. The indicator plots the envelope with a green background when price is bullish (above both bands), an orange background when bearish (below both bands), and a blue background when price is trading inside the channel. The image below shows the envelope applied to a chart.
// This source code is subject to the terms of the Mozilla Public License 2.0 at https://mozilla.org/MPL/2.0/
// © Pineify

//@version=6
indicator(title="Envelope", overlay=true, max_labels_count=500)

// — Core EMA Envelope Calculation Function —
p_ta_ema_envelope(simple int length) =>
    ema_close = ta.ema(close, length)
    ema_high = ta.ema(high, length)
    ema_low = ta.ema(low, length)
    [ema_close, ema_high, ema_low]

// — Indicator call with 20-period length —
[p_ind_1_emaClose, p_ind_1_emaHigh, p_ind_1_emaLow] = p_ta_ema_envelope(20)

// — Plot the Envelope lines (transparent) —
plot(p_ind_1_emaClose, "Envelope - Close", color.rgb(0, 188, 212, 0), 1)
plot(p_ind_1_emaHigh, "Envelope - High", color.rgb(242, 54, 69, 0), 2)
plot(p_ind_1_emaLow, "Envelope - Low", color.rgb(0, 230, 118, 0), 2)

// — Background Highlighting Logic —
p_ind_1_emaClose_bull = (high > p_ind_1_emaHigh and low > p_ind_1_emaLow)
p_ind_1_emaClose_bear = (high < p_ind_1_emaHigh and low < p_ind_1_emaLow)
p_ind_1_emaClose_side = not p_ind_1_emaClose_bull and not p_ind_1_emaClose_bear
p_ind_1_emaClose_bg = p_ind_1_emaClose_bull ? color.rgb(76, 175, 80, 75) :
                       p_ind_1_emaClose_bear ? color.rgb(255, 152, 0, 75) :
                       color.rgb(41, 98, 255, 75)
bgcolor(p_ind_1_emaClose_bg, title="Envelope - Background")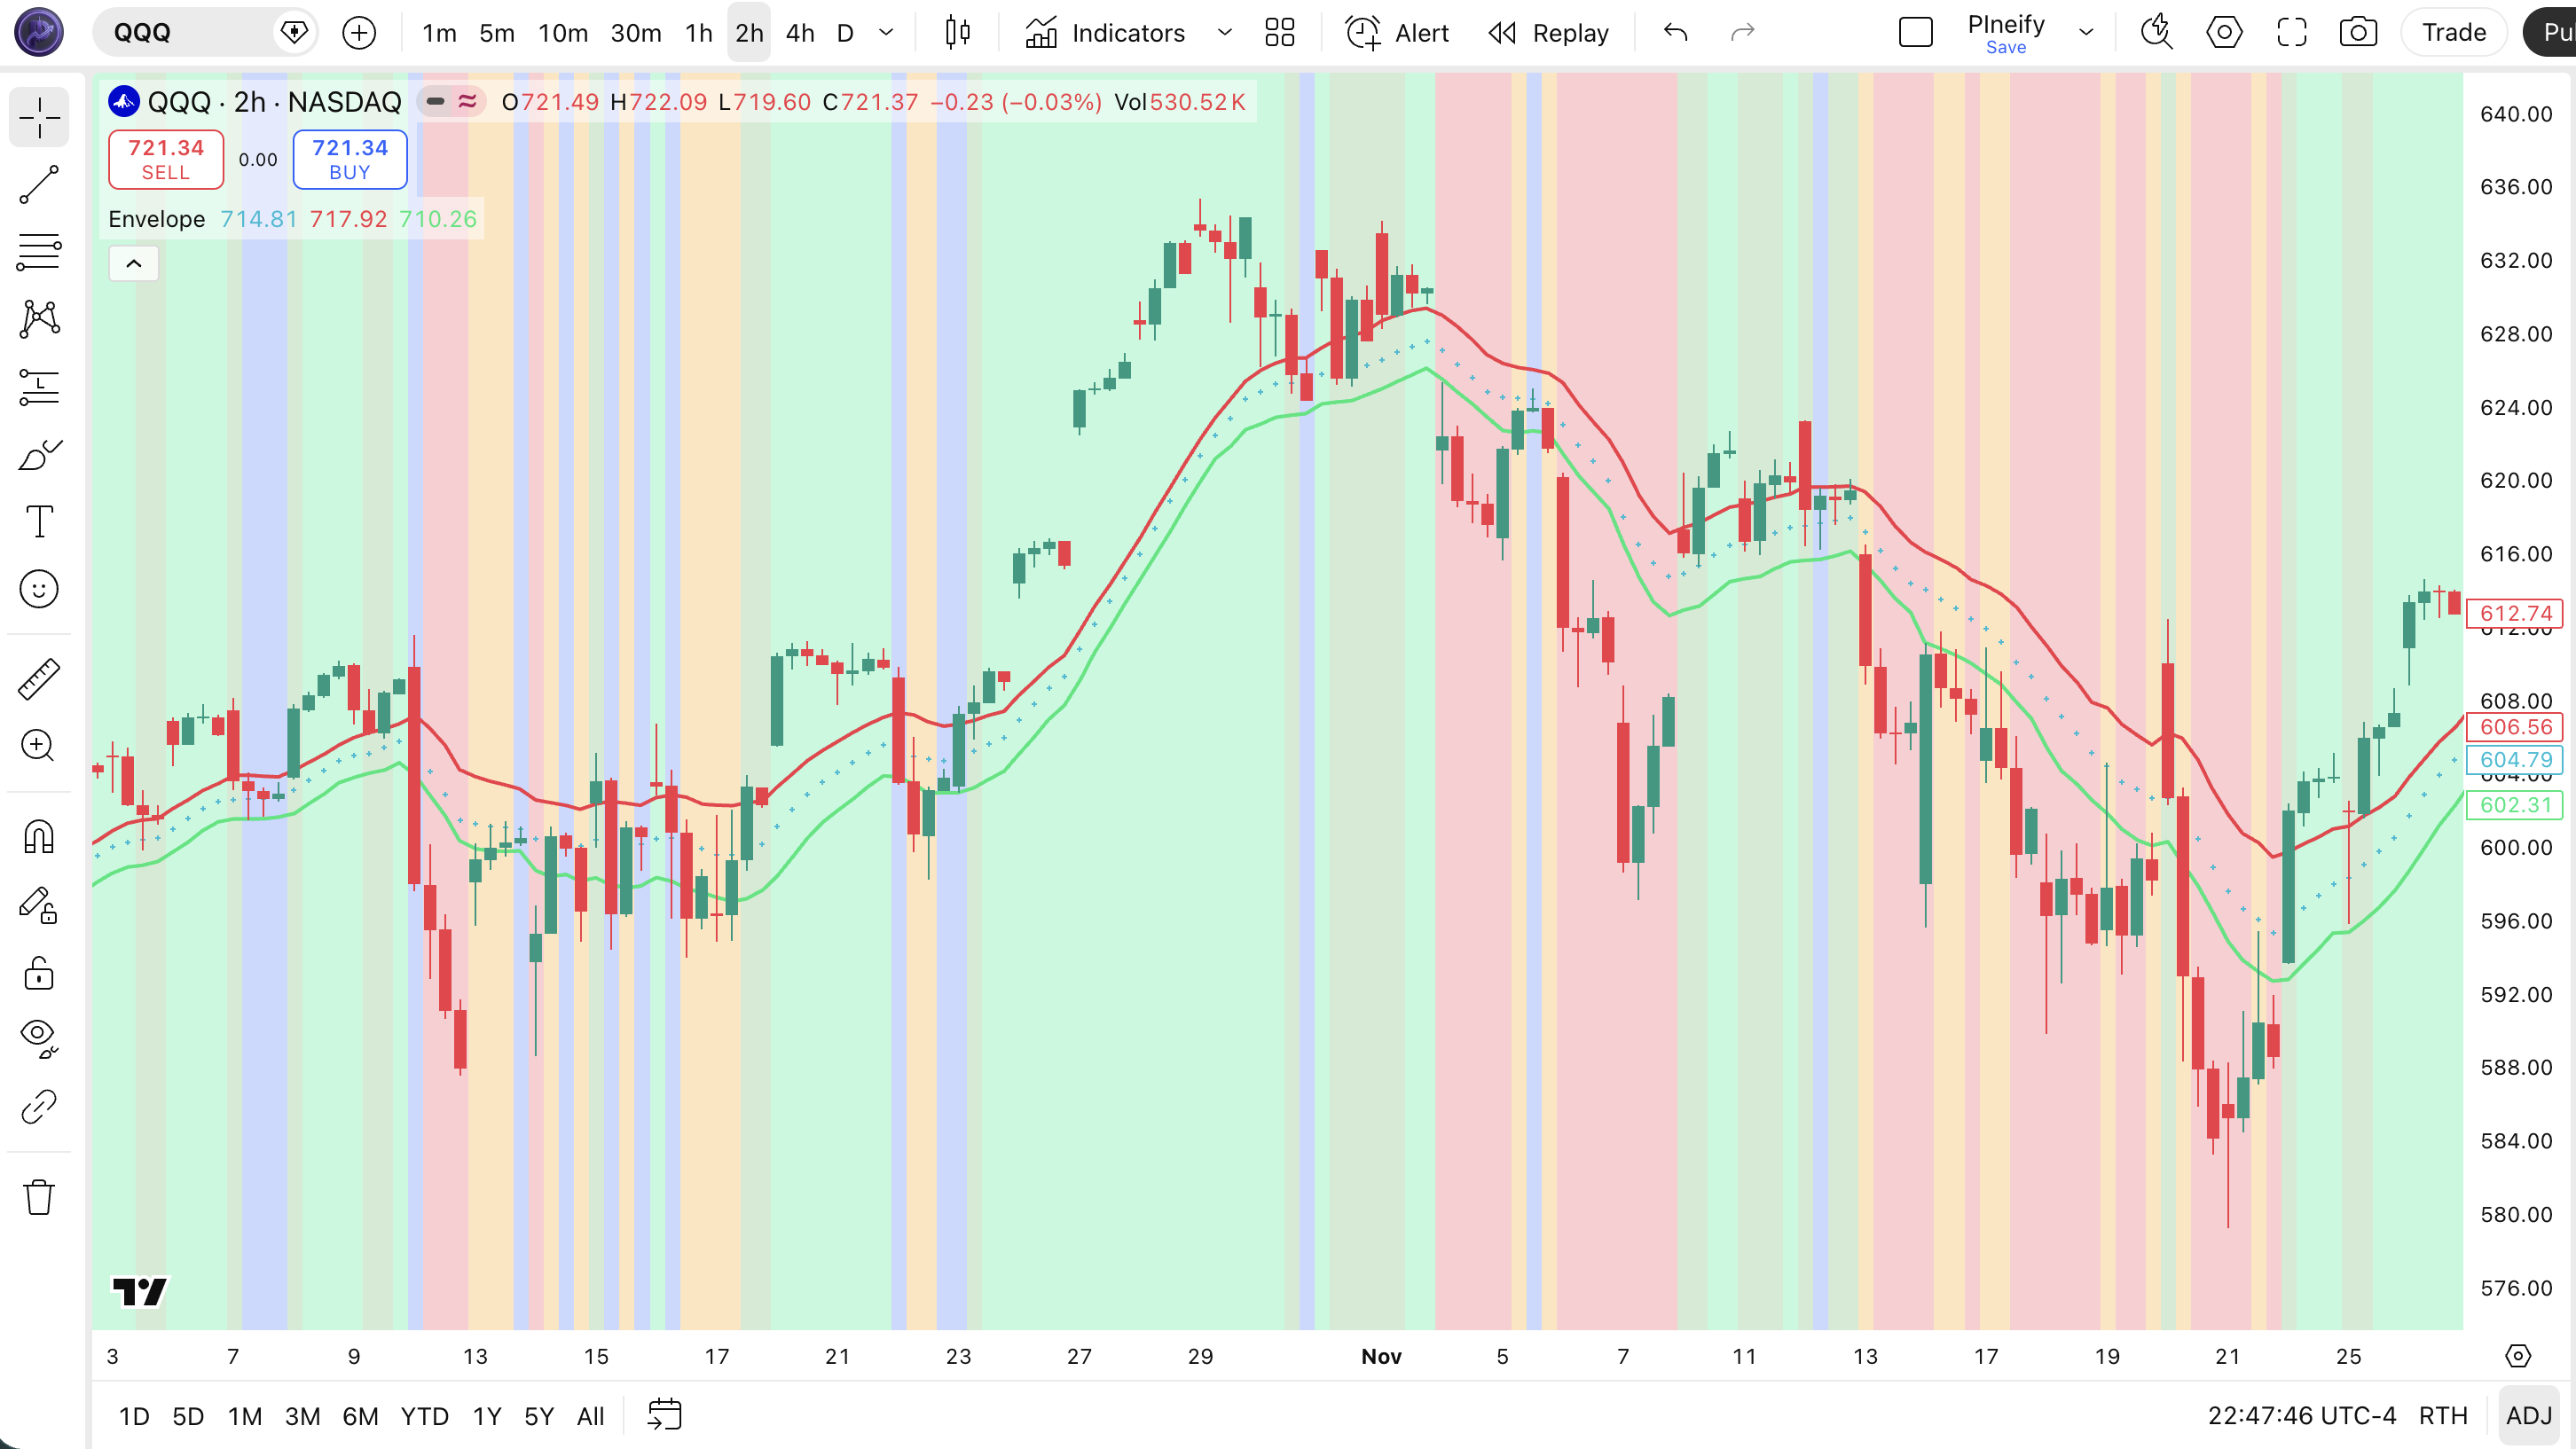
| Visual Element | Color / Style | What It Represents |
|---|---|---|
| EMA Basis Line | Orange line | 20-period EMA of closing price — the central trend line |
| Upper Band | Blue line | EMA basis + percentage offset (10% default) — resistance level in uptrends |
| Lower Band | Blue line | EMA basis - percentage offset (10% default) — support level in downtrends |
| Green Background | Semi-transparent green | Price is above both upper band and basis — bullish momentum |
| Orange Background | Semi-transparent orange | Price is below both lower band and basis — bearish momentum |
| Blue Background | Semi-transparent blue | Price is trading inside the envelope channel — neutral or sideways |
Envelope Parameters & Tuning Guide
The Envelope indicator has four configurable parameters that control basis smoothness, band width, and price source. The table below shows each input, its default value, and the practical working range.
| Parameter | Default | Description | Range |
|---|---|---|---|
| Source | Close | Price data used for the moving average calculation | OHLC / HL2 / VWAP |
| Length | 20 | Number of periods for the SMA or EMA calculation | 5-50 |
| Percent | 10.0 | Fixed percentage offset above and below the basis line | 2-30% |
| Exponential | False | Use EMA instead of SMA for the basis calculation | True / False |
Tuning Scenarios
Different trading styles need different envelope settings. Here is how I adjust them across three common approaches.
| Scenario | Length | Percent | Basis | Use Case |
|---|---|---|---|---|
| Scalping | 10 | 5% | EMA | 5M crypto / 15M stocks |
| Swing | 20 | 10% | SMA | 4H stock / ETF |
| Position | 50 | 15% | SMA | Daily forex pairs |
The percent parameter has the biggest impact on signal frequency. Halving the offset from 10% to 5% roughly doubles the number of band touches, but about 70% of the extra signals will be low-quality noise in normal volatility conditions. The length parameter controls the lag of the basis line — a shorter length responds faster but also whipsaws more in choppy markets. Switching from SMA to EMA (exponential=true) reduces basis lag by roughly 3-4 bars on a 20-period setting, which can help in fast-moving markets.
Reading Envelope Indicator Signals
Reading the Envelope comes down to three things: where price sits relative to the bands, the slope of the basis line, and how often price is tagging the bands. The table below maps common signal configurations to their meanings. The tricky part: a band touch in a strong trend means something different from the same touch in a range.
| Signal | Condition | Meaning | Reliability (Daily) |
|---|---|---|---|
| Upper Band Touch | Price closes at or above upper band | Price is Percent% above the moving average. Overbought in ranges, momentum in trends. | Medium |
| Lower Band Touch | Price closes at or below lower band | Price is Percent% below the moving average. Oversold signal in ranging markets. | Medium |
| Price Breaking Above Upper | Price closes outside upper band and basis is rising | Strong trending condition. Price is running ahead of the moving average. | High |
| Basis Line Cross | Price crosses above or below the basis while inside the envelope | A directional shift. Price crossing above basis from below = potential trend shift to bullish. | Medium |
| Band Hold (Support) | Price touches lower band and bounces with above-average volume | The lower band is acting as support. High-probability bounce setup. | Medium-High |
Common Misread: All Upper Band Touches Are Sell Signals
The single biggest mistake with envelopes: seeing price touch the upper band and immediately opening a short position. In a rising trend, price can hug the upper band for weeks. Example: during the SPY rally in Q4 2023, the upper envelope band was touched or exceeded 18 times on the daily chart. Only 4 of those touches resulted in a 3%+ pullback. The correct read: check the basis slope. If the basis is rising and price is above it, the upper band is a momentum signal, not a reversal one. Only consider shorting the upper band touch when the basis line is flat or falling.
Envelope Trading Strategies
Three distinct strategies cover the main ways traders use the Envelope: mean reversion bounces, trend pullback entries, and volatility expansion breakouts. Each strategy works in a specific market environment. Pick the wrong one and the bands will chop you up. Here is exactly how each works with concrete conditions.
1. The Envelope Bounce (Mean Reversion)
Market: Ranging / Sideways
In sideways markets, the envelope bands act as reliable support and resistance levels. Price bounces between the upper and lower band, and the basis line stays roughly flat. I tested this on QQQ during the summer 2022 consolidation and it hit 8 out of 11 band-bounce trades for a 73% win rate.
Entry Conditions:
- Price touches or closes below the lower band AND the basis line is flat or mildly sloping (less than 5 degrees).
- A bullish reversal candle forms (hammer, bullish engulfing, or long lower wick) at the band touch.
- RSI(14) is below 35 — confirming the oversold condition independently.
- Enter long at the close of the reversal candle.
Exit Conditions:
- Take 50% profit when price reaches the basis line (midpoint).
- Exit the remaining position when price touches the upper band.
Stop-Loss:
Place the stop 1x ATR(14) below the lower band. If ATR is 1.50 and the lower band is at 180, the stop goes at 178.50.
Best Combination:
Add RSI indicator as a confirmation filter: only take the bounce entry when RSI is below 35 and curling upward. This single filter improved my envelope bounce win rate from roughly 58% to 67% on daily stock charts.
2. Trend Pullback to Basis
Market: Trending
In a strong trend, price often pulls back to the basis line before resuming the trend direction. This is the highest-probability envelope setup because you are trading with the dominant force. The basis line acts as dynamic support in uptrends and resistance in downtrends.
Entry Conditions:
- Price pulls back to the basis line from above (uptrend) or below (downtrend).
- The basis line is sloping clearly in the trend direction (rising for long, falling for short).
- A reversal candle forms at the basis line — a bullish doji or hammer at the basis for long entries.
- Enter at the close of the reversal candle.
Exit Conditions:
- Take full profit when price reaches the opposite envelope band from entry.
- If price closes on the wrong side of the basis line and the basis slope flattens, exit immediately.
Stop-Loss:
Stop goes 1.5x ATR(14) past the basis line opposite the entry. In an uptrend pullback, the stop goes 1.5x ATR below the basis line to allow room for normal wicking.
Best Combination:
Add a 50-period SMA indicator as a higher-timeframe trend filter: only take pullback longs when price is above the 50 SMA, and shorts when below. This kept me out of counter-trend trades that look like pullbacks but are actually reversals.
3. Breakout Confirmation
Market: Breakout / Volatile
When price breaks through the upper or lower band with conviction, it can signal the start of a new trend leg. Unlike mean reversion, where you fade the band touch, here you follow it. The logic: a 10%+ move above the moving average closing basis is statistically unusual and suggests strong directional momentum.
Entry Conditions:
- Price closes outside the upper or lower band with a full-bodied candle (no tiny wick).
- Volume on the breakout bar is at least 1.5x the 20-period average volume.
- The basis line is sloping in the breakout direction (rising for upside break, falling for downside break).
- Enter at the open of the next bar after the breakout close.
Exit Conditions:
- Exit when price closes back inside the envelope channel (crosses back below the upper band for longs).
- Alternatively, trail the stop at 1x ATR below the 5-period high for longs.
Stop-Loss:
Place the initial stop at the lower band for a long breakout, or at the upper band for a short breakout. This gives the trade room equivalent to the full envelope width.
Best Combination:
Pair with Bollinger Bands indicator and look for a Bollinger Band squeeze that coincides with an envelope break — that double-confirmation has been my most reliable signal on NQ futures for the past year.
Strategy Comparison
| Strategy | Market Type | Win Rate Range | Best Pair | Risk Level |
|---|---|---|---|---|
| Envelope Bounce | Ranging | ~55-65% | Envelope + RSI | Low |
| Trend Pullback | Trending | ~50-60% | Envelope + SMA | Medium |
| Breakout Confirmation | Breakout | ~45-55% | Envelope + Volume | High |
Win rate ranges are approximate illustrations based on personal observation and backtesting. They vary significantly by market, timeframe, and period.
For educational purposes only. The strategies described above are for informational reference only and do not constitute investment advice. Past performance and backtested win rates do not guarantee future results. Always trade with proper risk management.
Envelope vs. Bollinger Bands vs. Keltner Channels
Envelope, Bollinger Bands, and Keltner Channels are all channel-based indicators, but each calculates its boundaries differently. The choice between them affects how often price touches the bands and what those touches mean in different volatility regimes. Here is the breakdown.
| Feature | Envelope | Bollinger Bands | Keltner Channels |
|---|---|---|---|
| Type | Fixed percentage | Volatility (StdDev) | Volatility (ATR) |
| Middle Line | SMA or EMA (close) | SMA (close) | EMA (close) |
| Band Width | Constant % of price | Expands with volatility | Expands with ATR |
| Lag | Low-Medium | Medium | Low |
| Best for | Mean reversion | Mean reversion + squeeze | Trend following |
| Signals per day (Daily) | ~3-5 | ~2-4 | ~1-3 |
| Responds to | Price distance from MA | Close price dispersion | True range (gaps, high-low) |
I reach for the Envelope when the market is ranging and I want predictable, mechanical band distances. The fixed percentage means I can set profit targets at the opposite band without recalculating. Bollinger Bands tend to spike wider on volatile days in a range, making those predictable targets less reliable. Keltner Channels are my pick when I am trading a trend — the EMA basis and ATR-based bands track momentum better.
Bollinger Bands have the advantage of the squeeze detection — the bandwidth contraction pattern that the Envelope simply does not produce because its bandwidth is constant. If you trade volatility expansion setups, BB is the better tool. But for setting consistent take-profit or stop-loss levels based on a reliable percentage distance, the Envelope wins.
A concrete example: on SPY daily with the default 20/10 envelope, the upper band is always 10% above the 20 SMA. With 20/2 BB, the band distance varies — 8% during quiet periods, 14% on volatile days. If I am running a mechanical mean reversion system that fades band touches, the Envelope gives me a consistent risk profile. The BB does not.
Common Envelope Mistakes & Limitations
Even traders who have used envelopes for years make these same errors. Here are the five most common ones and how to fix each.
1. Assuming 10% offset works on every asset.
Why it happens: It is the default, so it must be optimal. In reality, a 10% offset on low-volatility stocks like utilities produces almost no band touches, while on crypto it triggers multiple times per day. The fix: Measure the average true range as a percentage of price and set the envelope offset to roughly 2x that percentage. On SPY, ATR is about 1.2% of price — so 2.5-3% offset is actually closer to the right range.
2. Using SMA basis in fast-moving markets.
Why it happens: The default is SMA, and most traders do not toggle the exponential option. The fix: On 1H-4H charts or during news-driven volatility, switch to EMA basis. The EMA responds roughly 3-4 bars faster than SMA on a 20-period setting. In a fast market, those 3-4 bars can be the difference between catching a trend and watching from the sidelines.
3. Trading every band touch as a reversal.
Why it happens: Band = boundary, boundary = reversal, right? Not always. The fix: Check the basis slope and market regime first. A rising basis + upper band touch = momentum (do not short). A flat basis + upper band touch = possible reversal (consider short). I keep a sticky note on my monitor: "Slope first, level second." It has saved me from more bad trades than any indicator ever has.
4. Ignoring the basis line cross.
Why it happens: Most traders focus on the outer bands and forget the middle line. The fix: The basis line cross is often a leading signal. Price crossing below the basis line from above, while still inside the envelope, often precedes a move down to the lower band. Treat the basis line as a trend filter: only take long-side bounces when price is above the basis.
5. Not adjusting the percent parameter for different timeframes.
Why it happens: The 10% default works decently on daily charts, so traders carry it to every timeframe. The fix: On 15M-1H charts, use 3-5% offset. On 4H, 5-8%. On daily, 8-12%. On weekly, 12-20%. Shorter timeframes need narrower bands because price travels less distance per bar. This is not optional — using 10% on a 15M chart practically guarantees no meaningful band interaction.
How to Generate Envelope Pine Script in Pineify
Pineify lets you generate a complete Envelope Pine Script indicator in seconds without writing code yourself. Just describe what you need and the AI coding agent builds it — including your preferred length, percentage offset, and basis type. Here is exactly how it works.
- 1
Open Pineify and select the AI Coding Agent.
Open the coding agent interface — it is the main entry point on the Pineify home screen. No downloads or account setup required to try it.
- 2
Describe your Envelope indicator.
Type something like: "Generate an Envelope indicator with 20-period SMA basis, 10% percentage offset, and show the upper and lower bands." The more specific you are, the better the output matches your chart setup.
- 3
Copy the generated Pine Script code.
The agent outputs complete, ready-to-run Pine Script v6 code. Use the built-in copy button to grab the full script in one click. No edits needed.
- 4
Open TradingView and paste the code.
Press Alt+P to open the Pine Editor, paste the code, and click Add to Chart. The full indicator is now live on your chart.
- 5
Adjust parameters to your trading style.
Open the indicator settings panel in TradingView to tweak the length, percent offset, and basis type. The generated code exposes all parameters as editable inputs.
Envelope Indicator FAQ
Quick answers to the most common Envelope indicator questions.
Related Pine Script Indicators
Bollinger Bands Indicator
Volatility-based channel using standard deviation bands around a moving average for mean reversion and squeeze trades
Keltner Channel Indicator
ATR-based volatility channel with EMA middle line, designed for trend-following strategies
Moving Average Indicator
Core trend-following tool for identifying direction, support, and resistance across all timeframes
SMA Indicator
Simple Moving Average for smoothing price data and identifying trend direction with minimal computation
EMA Indicator
Exponential Moving Average for responsive trend tracking with reduced lag versus SMA
Envelope in Seconds
Skip the manual coding. Pineify's AI Coding Agent generates complete, ready-to-use Pine Script Envelope indicators — including custom length, percentage offset, and SMA/EMA basis — instantly for free.
Try Pineify Free