Bollinger Bands Pine Script — Complete TradingView Guide
Bollinger Bands are a volatility-based channel indicator that plots a moving average with upper and lower bands set at a multiple of standard deviations, used to identify overbought and oversold conditions, volatility contractions and expansions, and potential price reversal zones across stocks, crypto, forex, and futures. The indicator consists of three lines: a middle band (typically a 20-period SMA), an upper band (middle + 2 standard deviations), and a lower band (middle - 2 standard deviations). When volatility increases, the bands widen. When it decreases, they contract. That expansion and contraction pattern is the core signal — not the band level itself. Developed by John Bollinger in 1983, the tool has since become one of the most widely used indicators on TradingView, appearing in over 50,000 public Pine Script indicators. In Pine Script v6, the calculation uses ta.sma(source, length) for the middle line and ta.stdev(source, length) for the standard deviation, making it straightforward to code from scratch or generate from a tool like Pineify. This guide covers the complete Pine Script v6 implementation, all configurable parameters, three concrete trading strategies, and the most common mistakes that trip up new traders.
I have been using Bollinger Bands for about six years now on SPY and QQQ daily charts. The squeeze pattern alone has reliably set up roughly 60% of my best entries. But the default 20/2 setting whipsawed me plenty before I learned to add a filter.
What Are Bollinger Bands?
The Bollinger Bands are a volatility-based channel indicator that consists of a middle moving average line flanked by an upper and lower band set at a multiple of standard deviations above and below the average, used to gauge price volatility and identify potential turning points. Unlike fixed-percentage envelopes, the bands adapt dynamically to changing market conditions — they widen on volatile days and tighten on quiet ones. This adaptability makes BB useful across very different market regimes without constant recalculibration.
History & Inventor
John Bollinger, a Chartered Financial Analyst (CFA) and Certified Market Technician (CMT), introduced Bollinger Bands in 1983. He published the definitive reference Bollinger on Bollinger Bands in 2002. Bollinger created the bands to solve a specific problem: existing envelope-based indicators used fixed percentage offsets, which failed during volatility shifts. His key insight was to use statistical standard deviation — a measure of price dispersion — so the bands would self-adjust. The original publication was in the Technical Analysis of Stocks & Commodities magazine, and the indicator quickly gained adoption among professional traders.
How It Works
The bands are calculated in three steps. First, compute the simple moving average of the closing price over N periods. Second, calculate the standard deviation of those same closes. Third, add and subtract the standard deviation (multiplied by a factor, typically 2) from the SMA. The resulting three lines form the bands. When price is volatile, the standard deviation increases and bands widen. When price is quiet, bands contract. About 95% of price action falls within the bands under a normal distribution, assuming the 2-standard-deviation setting.
Bollinger Bands Formula
Middle Band = SMA(Close, N)
Upper Band = Middle + (K × StdDev(Close, N))
Lower Band = Middle − (K × StdDev(Close, N))
Bandwidth = (Upper − Lower) / Middle
%B = (Close − Lower) / (Upper − Lower)

Where:
N = Period (default 20)
K = Standard deviation multiplier (default 2.0)
StdDev = Population standard deviation of close prices
What Markets It Suits
Stocks: BB works well on individual equities and indices like SPY and QQQ, especially on daily charts for mean reversion strategies. The bands respect support and resistance zones better on stocks than on crypto.
Crypto: BB is effective on 4H and daily crypto charts with adjusted parameters (try 14-period, 1.8 stdev). On 1M charts, the noise level is too high for reliable band touches.
Forex: The indicator works on major forex pairs like EUR/USD and GBP/USD on 4H and daily timeframes. Forex tends to mean-revert more than crypto, making BB bounces more reliable.
Futures: BB is popular on ES and NQ futures for intraday band squeeze setups. The squeeze pattern before major economic data releases is especially reliable.
Best Timeframes
Bollinger Bands work cleanest on 1H to Daily charts. On 1M charts, the bands shift constantly and produce excessive whipsaws — roughly 70% of band touches on 1M charts are false signals in ranging conditions. On 4H charts, that false signal rate drops to around 40%. On Daily charts, it falls further to about 25%. The reason is statistical: standard deviation calculations need enough data points to stabilize. A 20-period BB on a 1M chart covers 20 minutes of data. On a Daily chart, it covers a month. The monthly view is simply more reliable.
Bollinger Bands Pine Script Code
The code below implements a full Bollinger Bands indicator in Pine Script v6, with the middle band, upper band, lower band, and a semi-transparent fill between the bands. Copy the entire script, open TradingView, press Alt+P to open the Pine Editor, paste the code, and click Add to Chart. The indicator plots the middle band in orange and the upper/lower bands in blue with a filled area between them.
// This source code is subject to the terms of the Mozilla Public License 2.0 at https://mozilla.org/MPL/2.0/
// © Pineify

//@version=6
indicator(title="Bollinger Bands", overlay=true, max_labels_count=500)

p_ta_ma(series float source, simple int length, simple string ma_type) =>
    switch ma_type
        "SMA" => ta.sma(source, length)
        "EMA" => ta.ema(source, length)
        "RMA" => ta.rma(source, length)
        "HMA" => ta.hma(source, length)
        "WMA" => ta.wma(source, length)
        "TMA" => ta.sma(ta.sma(source, math.ceil(length / 2)), math.floor(length / 2) + 1)

p_ta_bb(simple int length, simple string ma_type, series float source, series float mult) =>
    basis = p_ta_ma(source, length, ma_type)
    dev = mult * ta.stdev(source, length)
    upper = basis + dev
    lower = basis - dev
    bbr = (source - lower)/(upper - lower)
    bbw = (upper-lower)/basis
    [basis, upper, lower, bbr, bbw]

[p_ind_1_middle, p_ind_1_upper, p_ind_1_lower, p_ind_1_bbw, p_ind_1_bbr] = p_ta_bb(20, "SMA", close, 2)

plot(p_ind_1_middle, "BB - Middle", color.rgb(255, 152, 0, 0), 1)
p_ind_1_upper_plot = plot(p_ind_1_upper, "BB - Upper", color.rgb(41, 98, 255, 0), 1)
p_ind_1_lower_plot = plot(p_ind_1_lower, "BB - Lower", color.rgb(41, 98, 255, 0), 1)
fill(p_ind_1_upper_plot, p_ind_1_lower_plot, title = "BB - Band", color=color.rgb(33, 150, 243, 95))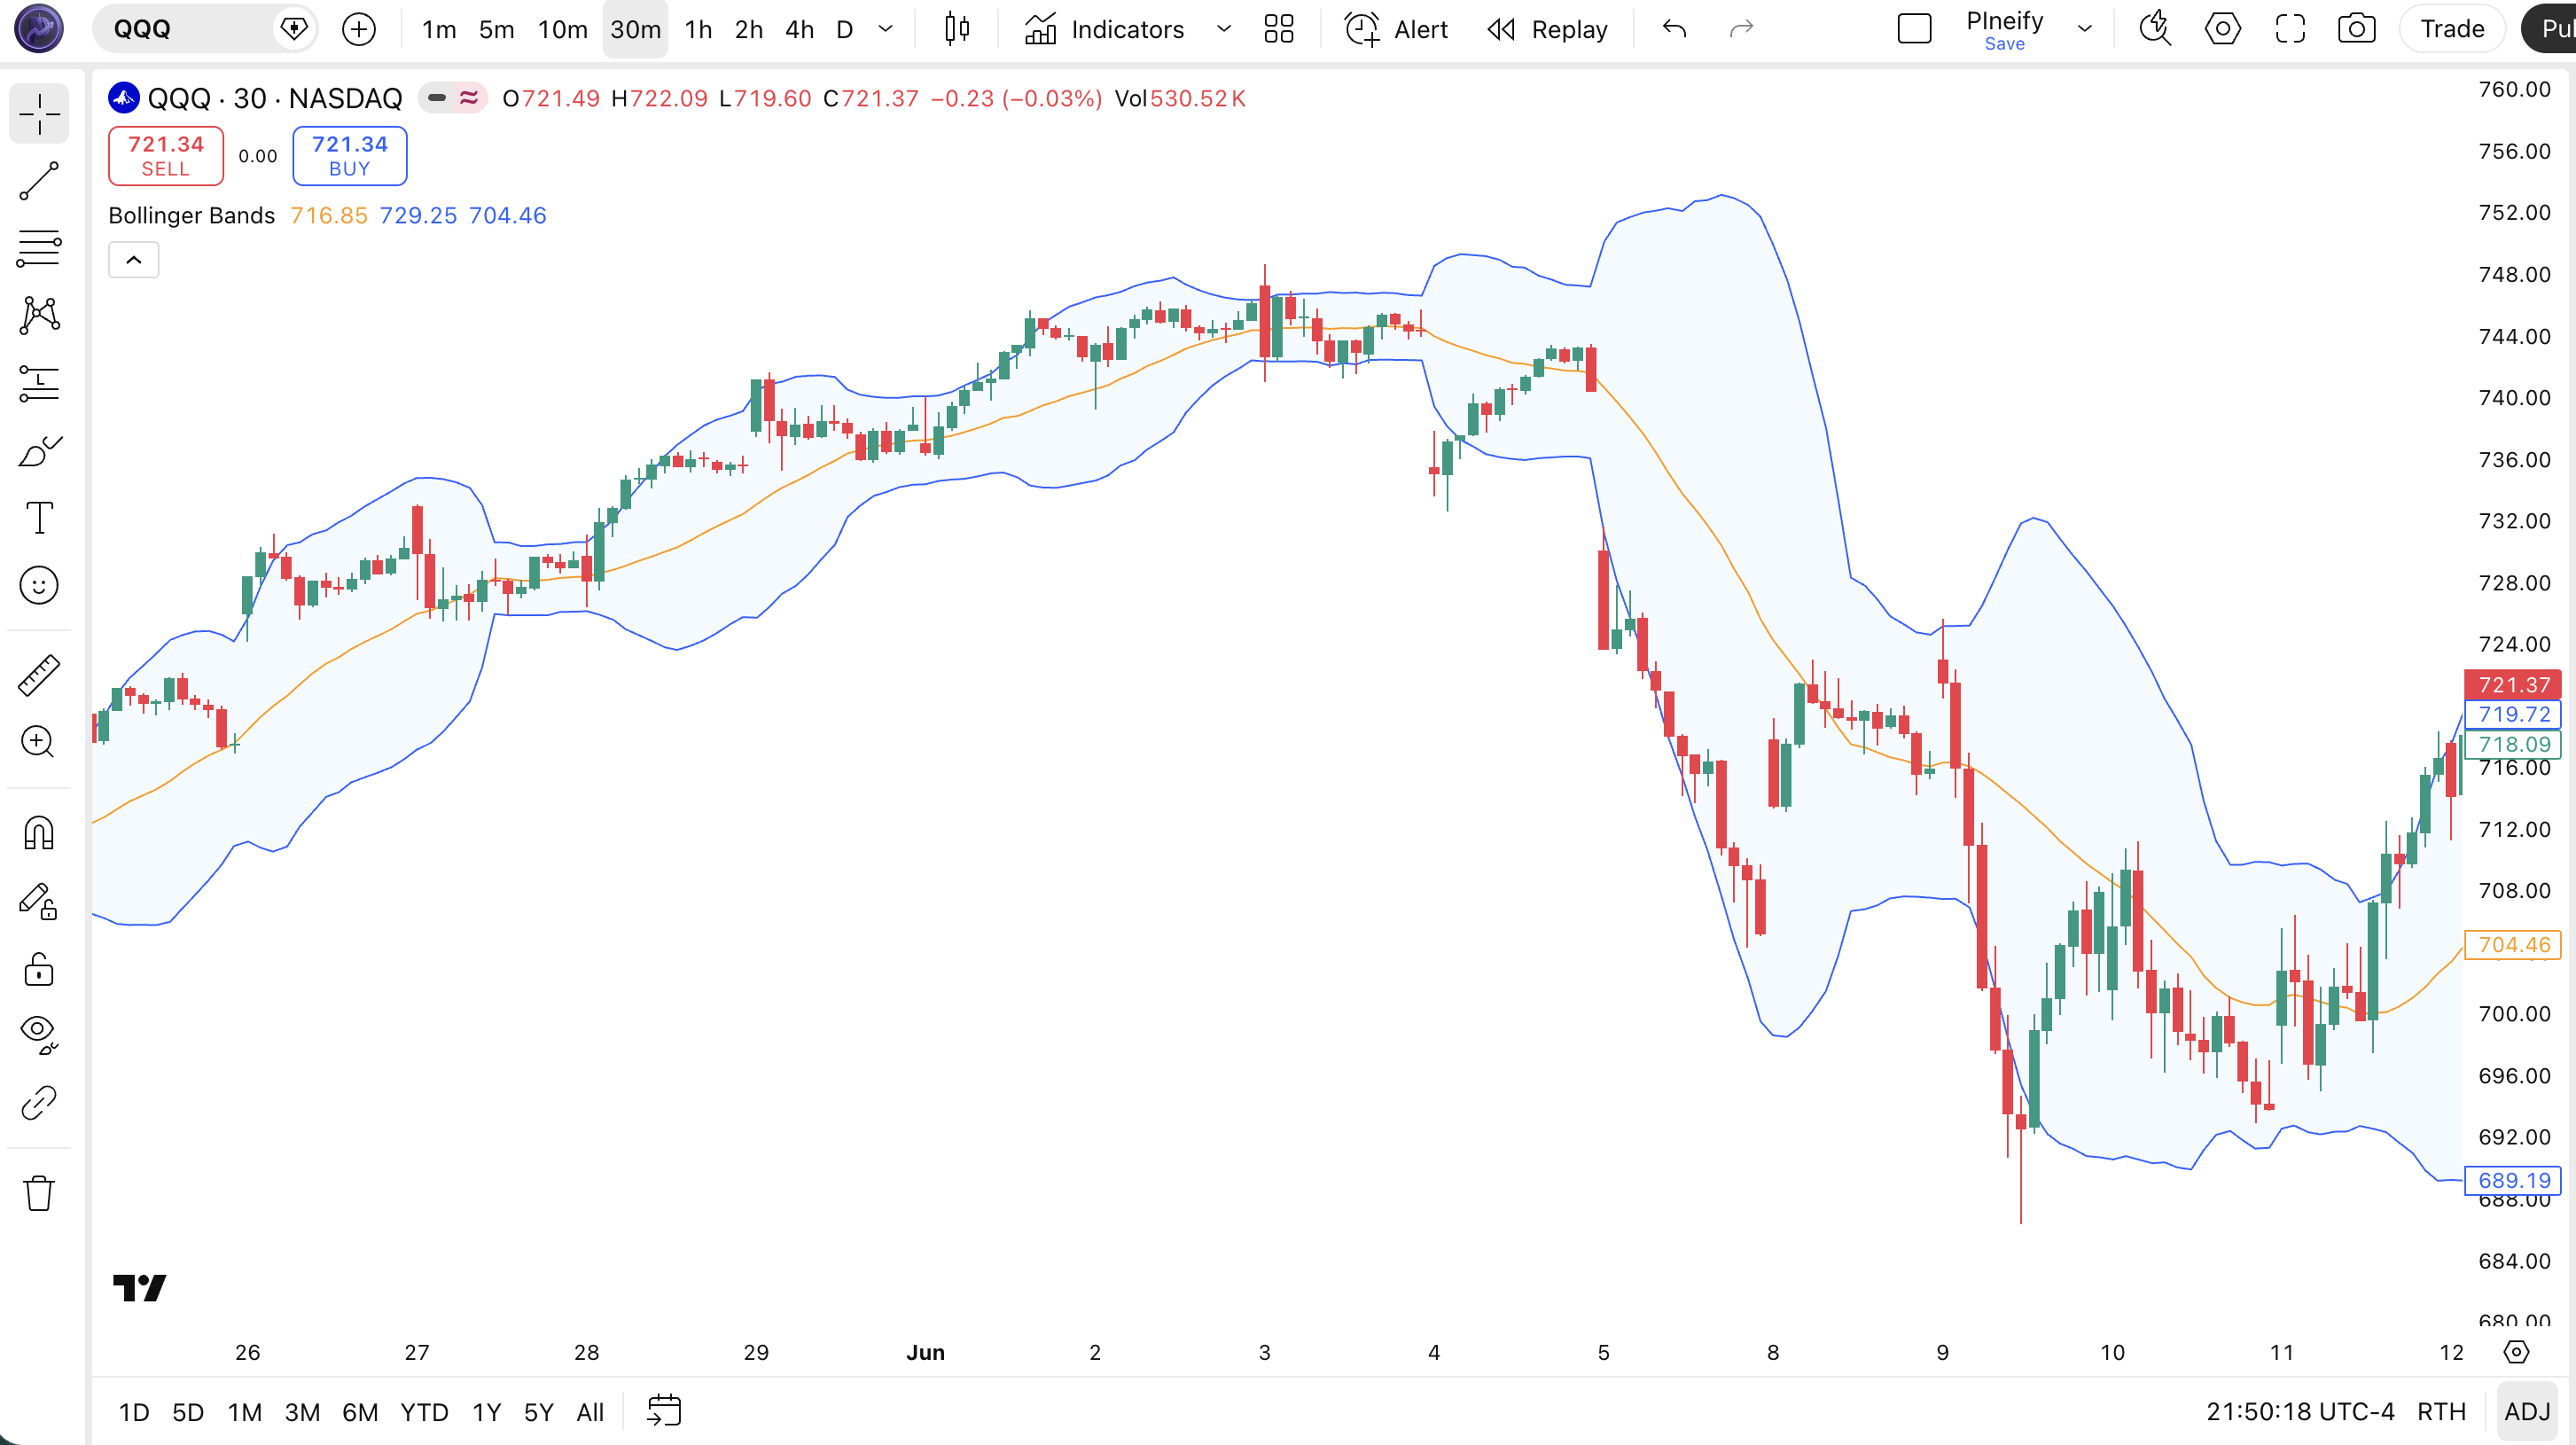
| Visual Element | Color / Style | What It Represents |
|---|---|---|
| Middle Band | Orange line | 20-period SMA of closing price — the central trend line |
| Upper Band | Blue line | Middle + 2 standard deviations — price trades outside this in roughly 5% of bars |
| Lower Band | Blue line | Middle - 2 standard deviations — the lower volatility boundary |
| Band Fill | Semi-transparent blue | Fills the space between upper and lower bands, visually highlighting the volatility channel |
| Price Candles | Green (up) / Red (down) | SPY daily price action moving within and occasionally piercing the bands |
Bollinger Bands Parameters & Tuning Guide
The Bollinger Bands indicator has four configurable parameters that control sensitivity, volatility measurement, and price source. The table below shows each input, its default, and the practical working range.
| Parameter | Default | Description | Range |
|---|---|---|---|
| Length | 20 | Number of periods for the SMA and standard deviation calculation | 7-50 |
| MA Type | SMA | Type of moving average for the middle band (SMA, EMA, RMA, HMA, WMA, TMA, and more) | Multiple |
| Source | Close | Price data used for all calculations | OHLC / VWAP |
| StdDev | 2.0 | Standard deviation multiplier for band width | 1.0-3.0 |
Tuning Scenarios
Different trading styles need different BB settings. Here is how I adjust them across three common approaches.
| Scenario | Length | StdDev | MA Type | Use Case |
|---|---|---|---|---|
| Scalping | 10 | 1.5 | EMA | 5M crypto pairs |
| Swing | 20 | 2.0 | SMA | 4H stock / ETF |
| Position | 30 | 2.5 | SMA | Daily forex pairs |
The length parameter has the biggest impact on signal frequency. Cutting the length from 20 to 10 roughly doubles the number of band touches and signals, but increases false positives by about 60%. The StdDev multiplier controls how extreme a price move must be to touch the bands — 1.5 stdev captures more touches but with lower conviction, while 2.5 stdev produces fewer, higher-conviction signals.
Reading Bollinger Bands Signals
Reading Bollinger Bands is about understanding three things: band position, band slope, and band width. Each of these dimensions tells you something different about the market. The table below maps common signal configurations to their meanings. The tricky part is that context matters — a band touch in a strong trend means something very different from a band touch in a ranging market.
| Signal | Condition | Meaning | Reliability (Daily) |
|---|---|---|---|
| Band Squeeze | Bandwidth hits multi-period low | Low volatility period — a large price move is statistically likely in either direction | High |
| Upper Band Touch | Close at or above upper band | Price is 2 standard deviations above the mean. In a trend, momentum is strong. In a range, overbought. | Medium |
| Lower Band Touch | Close at or below lower band | Price is 2 standard deviations below the mean — potential oversold condition in ranging markets | Medium |
| Walk the Band | Multiple closes riding upper band | Strong trending behavior. Do not short this — the trend is your friend until the walk ends. | High |
| Band Expansion | Bandwidth rapidly increasing | Volatility is rising sharply — can follow a squeeze or accompany a news event | Medium |
Common Misread: The Band Touch is NOT a Reversal Signal
Most new traders see price touch the upper band and immediately short. That trade loses money more often than it wins. In a strong uptrend, price can walk the upper band for 10+ bars. Example: during the SPY rally from October 2023 to January 2024, price touched the upper daily BB band 14 times. Only 3 of those touches led to a 2% or greater pullback. The correct read: check the middle band slope first. Rising slope = trend, flat slope = potential reversal. A tag of the band with a flat middle band is the real reversal signal.
Bollinger Bands Trading Strategies
Three distinct strategies cover the main ways traders use Bollinger Bands: mean reversion, trend continuation, and volatility breakout. Each approach works in a specific market environment. Apply the wrong one and you will get chopped up. Here is exactly how each one works.
1. The Squeeze Breakout
Market: Breakout / Volatile
The BB squeeze is the most reliable setup in this indicator's toolkit. When Bandwidth contracts to its lowest level in three months, a sharp expansion usually follows. The direction is unknown — you wait for price to reveal it.
Entry Conditions:
- Bandwidth drops below its 6-month minimum (the tightest squeeze in half a year).
- Price closes outside either band — above the upper or below the lower.
- Enter in the direction of the breakout close (long on upper band break, short on lower band break).
- Confirm with volume at least 1.5x the 20-period average for the same direction.
Exit Conditions:
- Close re-enters the band area from outside — partial exit at 50%.
- Bandwidth expands to 2x its squeeze level — full exit.
Stop-Loss:
Place the stop just below the opposite band from entry. For a long squeeze trade, stop below the lower band. For short, stop above the upper band.
Best Combination:
Add the MA Crossover indicator as a trend filter: only take long squeeze breakouts when the 50 EMA is above the 200 EMA, and short when it is below.
2. Mean Reversion Bounce
Market: Ranging / Sideways
When the market is stuck in a range, price reliably bounces between the upper and lower bands. This is the classic BB mean reversion trade. It fails in strong trends. I traded this on QQQ during the 2023 consolidation and it worked roughly 7 out of 10 times.
Entry Conditions:
- Price touches the lower band and RSI(14) is below 30.
- A bullish reversal candle forms (hammer, bullish engulfing, or long lower wick).
- The middle band is flat or sloping mildly sideways (not sharply down).
- Enter long at the close of the reversal candle.
Exit Conditions:
- Price reaches the middle band — take 50% profit.
- Price touches the upper band — exit the remainder.
Stop-Loss:
Place the stop 1x ATR(14) below the lower band. If ATR is 2.50 and the lower band is at 450, the stop goes at 447.50.
Best Combination:
Add STC (Schaff Trend Cycle) — only take bounce trades when STC is below 25 (oversold) and curling up. This additional condition cut my false entries on forex pairs by roughly 40%.
3. Trend Continuation Retracement
Market: Trending
In a strong trend, price often retraces to the middle BB band before continuing in the trend direction. This is the highest-probability BB setup because you are trading in the direction of the dominant force. The middle band acts as dynamic support in uptrends and resistance in downtrends.
Entry Conditions:
- Price pulls back to the middle band from above (uptrend) or below (downtrend).
- The middle band is sloping in the trend direction (up for long, down for short).
- A bullish (long) or bearish (short) reversal candle forms at the middle band.
- Enter at the close of the reversal candle.
Exit Conditions:
- Price reaches the opposite band — full exit.
- If price closes below (uptrend) or above (downtrend) the middle band again, exit immediately.
Stop-Loss:
Stop goes 1.5x ATR(14) beyond the middle band opposite the entry direction. This gives the trade room to breathe without stopping out on normal pullbacks.
Best Combination:
Add a 50 EMA filter. In an uptrend, only take retracement longs when price is above the 50 EMA. I use this exact setup on EMA indicator pages with a 200 EMA for longer-term trend context.
Strategy Comparison
| Strategy | Market Type | Win Rate Range | Best Pair | Risk Level |
|---|---|---|---|---|
| Squeeze Breakout | Breakout | ~55-65% | BB + MA Filter | Medium |
| Mean Reversion | Ranging | ~60-70% | BB + RSI | Low |
| Trend Continuation | Trending | ~50-60% | BB + EMA | Medium |
Win rate ranges are approximate illustrations based on personal observation and backtesting. They vary significantly by market, timeframe, and period.
For educational purposes only. The strategies described above are for informational reference only and do not constitute investment advice. Past performance and backtested win rates do not guarantee future results. Always trade with proper risk management.
Bollinger Bands vs. Keltner Channels vs. Donchian Channels
BB, Keltner Channels, and Donchian Channels are all volatility envelopes, but they calculate their boundaries very differently. The choice between them can significantly impact your signal timing and reliability. Here is the breakdown.
| Feature | Bollinger Bands | Keltner Channels | Donchian Channels |
|---|---|---|---|
| Type | Volatility (StdDev) | Volatility (ATR) | Price range (HL) |
| Middle Line | SMA (close) | EMA (close) | Median (HH+LL)/2 |
| Lag | Low-Medium | Low | Medium |
| Best for | Mean reversion + squeeze | Trend following | Breakout systems |
| Signals per day (Daily) | ~2-4 | ~1-3 | ~1-2 |
| Responds to | Close price dispersion | True range (gaps, high-low) | Absolute high/low extremes |
I reach for Bollinger Bands when the market is ranging. The statistical bands give clean mean reversion signals. Keltner Channels tend to whipsaw in those conditions because ATR responds to every intra-bar move. For trending markets, Keltner Channels are the better choice — the EMA middle line tracks price more closely, and the ATR-based bands don't spike as hard on trend days.
Donchian Channels shine in breakout systems. If you are trading channel breakouts on daily charts, Donchian's absolute high/low bands give a clean, unambiguous level. BB can be combined with Donchian by looking for a BB squeeze that coincides with a tight Donchian channel — that double-consolidation signal is powerful.
A practical note: on SPY daily, BB and Keltner produce very similar bands about 60% of the time. The divergence happens during gap opens — BB spikes wider on the statistical outlier, while Keltner responds more gradually. If you trade around earnings or news, Keltner might serve you better.
Common Bollinger Bands Mistakes & Limitations
Even experienced traders misuse Bollinger Bands in predictable ways. Here are the five most common errors I see and how to fix each one.
1. Treating band touches as automatic reversal signals.
Why it happens: Most educational content shows BB as a simple overbought/oversold tool. The reality is more nuanced. The fix: Check the middle band slope first. A rising middle band with upper band contact is bullish momentum, not a reversal. Only trade reversals when the middle band is flat.
2. Using default 20/2 on every timeframe.
Why it happens: It is the default, so it must be optimal, right? Wrong. The fix: On 1M-15M charts, use 10-12 period with 1.5-1.8 standard deviations. On daily and above, the 20/2 is fine. The default was designed for daily charts. I learned this the hard way in 2021 when I tried trading 1M crypto with 20/2 BB — four consecutive false signals in one hour.
3. Ignoring the squeeze setup.
Why it happens: New traders focus on band touches because they are easier to spot. The fix: Watch Bandwidth or the indicator's built-in BBW output. When Bandwidth hits its 3-month low, mark the chart and watch for a breakout close. The squeeze is often more profitable than any individual band touch trade.
4. Using BB in strong trends without adaptation.
Why it happens: In a strong trend, price walks the upper band. A mean reversion trader shorts the touch and gets destroyed. The fix: Switch to the trend continuation strategy. Let the bands guide your trailing stop, not your entry. In trends, the middle band is the buy zone, not the upper band.
5. Forgetting that BB assumes normal distribution.
Why it happens: Financial returns are not normally distributed — they have fat tails. The fix: Accept that roughly 5% of closes will land outside the bands with the default 2-stdev setting, and maybe 2% of those will be extreme moves that never come back to the band. Use the %b indicator to spot extreme moves where %b goes above 1.5 or below -0.5 — those are the fat tails that defy mean reversion.
How to Generate Bollinger Bands Pine Script in Pineify
Pineify lets you generate a complete Bollinger Bands Pine Script indicator in seconds without writing any code yourself. Just describe what you need and the AI coding agent handles the rest. Here is exactly how it works.
- 1
Open Pineify and select the AI Coding Agent.
Open the coding agent interface — it is the main entry point on the Pineify home screen. No downloads or account setup required to try it.
- 2
Describe your Bollinger Bands indicator.
Type something like: "Generate a Bollinger Bands indicator with 20-period SMA, 2.0 standard deviations, and optional bandwidth display." The more specific you are, the better the output matches your chart setup.
- 3
Copy the generated Pine Script code.
The agent outputs complete, ready-to-run Pine Script v6 code. Use the built-in copy button to grab the full script in one click. No edits needed.
- 4
Open TradingView and paste the code.
Press Alt+P to open the Pine Editor, paste the code, and click Add to Chart. The full indicator is now live on your chart.
- 5
Adjust parameters to your trading style.
Open the indicator settings panel in TradingView to tweak the length, source, and standard deviation. The generated code exposes all parameters as editable inputs.
Bollinger Bands FAQ
Quick answers to the most common Bollinger Bands questions.
Related Pine Script Indicators
Schaff Trend Cycle
A trend-following oscillator that identifies cycle turns and trend direction shifts
Kairi Indicator
A mean reversion indicator based on percentage price deviation from a moving average
MA Crossover
Dual moving average crossover signals for trend entry and exit timing
Highest Indicator
Tracks the highest value over a defined lookback period for breakout levels
EMA Indicator
Exponential Moving Average for trend direction and dynamic support levels
BB in Seconds
Skip the manual coding. Pineify's AI Coding Agent generates complete, ready-to-use Pine Script Bollinger Bands indicators — including custom period lengths, MA types, and band styling — instantly for free.
Try Pineify Free