TradingView signal-processing lab

Voss Predictive Filter: Phase Lead and Forecast Limits

The Voss Predictive Filter applies weighted feedback to a band-limited signal. In the trading version presented by John Ehlers, a two-pole band-pass filter processes price first, then the Voss stage can move cyclic turning points earlier. This is a causal calculation using current and past data. Phase lead of a filtered cycle is not evidence that the next market price is known.

See the decision guide

Read the two-stage calculation in the correct order

Henning U. Voss describes the negative-group-delay feedback filter in his 2017 paper. Ehlers applies it after a band-pass filter in the August 2019 article A Peek Into The Future; the publisher supplies a public implementation. The equations below specify that trading construction. They do not reconstruct a protected TradingView script.

  • The most recent predictor value v[t−1] has weight 1; the oldest v[t−M] has weight 1/M. The sum uses past predictor outputs, not past band-pass values. Reversing those weights changes the filter.
  • For Predict 1, M = 3: v[t] = 3b[t] − v[t−1] − (2/3)v[t−2] − (1/3)v[t−3]. For Predict 3, M = 9 and the current band-pass multiplier is 6.
  • The band-pass output is centered around zero and retains input units. It removes the constant price level, so adding its Voss output to a chart as a future price target has no justification in this formula.
QuantityDefinition
InputsP = center period in bars; B = bandwidth; q = Predict setting; M = 3q
Coefficients, radiansF = cos(2π/P); G = cos(2πB/P); S = 1/G − sqrt(1/G² − 1)
Band-pass outputb[t] = (1 − S)/2 × (x[t] − x[t−2]) + F(1 + S)b[t−1] − Sb[t−2]
Voss outputv[t] = (M + 3)/2 × b[t] − Σ(j=1…M) ((M + 1 − j)/M) × v[t−j]

Compare the lead with the amplitude distortion

This original calculation uses x[n] = sin(2πn/20), 1,200 samples, P = 20 and B = 0.25. States start at zero and the first five band-pass outputs are zero. Results use samples 800 through 1199. A sine/cosine projection of the recursive output agrees with an independent complex transfer-function calculation within 1e−11. These are synthetic signal measurements, not trading results.

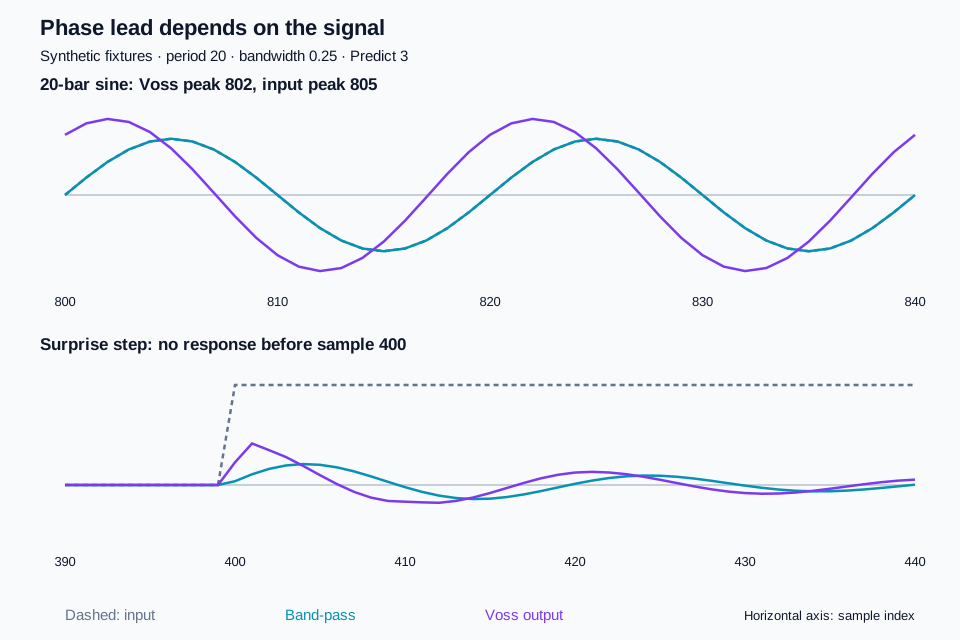
Synthetic sine and surprise-step responses. Voss peaks at sample 802 before the sine peak at 805, but has no output before the step at 400.
Original calculation at P = 20, B = 0.25 and Predict 3. Lines are plotted at their calculation timestamps with no horizontal offset. View original source
  • At the band-pass center frequency, its settled amplitude is 1 and phase is zero, so this fixture also measures lead relative to the input sine. That equivalence does not hold away from the center frequency.
  • Predict 3 moves the sampled peak three indices earlier here, but the continuous phase estimate is 2.903497 bars. The 35.28% amplitude increase is part of the result, not an improvement in forecast accuracy.
  • A single sine measures phase delay at one frequency. Group delay is minus the slope of phase versus angular frequency; it need not equal this phase-based bar shift. Do not report either as a fixed lead for all market movements.
Predict / orderPhase lead versus band-passSine amplitudeSampled peak near 805
Band-pass only0 bars1.000000805
1 / 31.103573 bars1.050318804
2 / 62.025668 bars1.159940803
3 / 92.903497 bars1.352752802

Voss numerical method

An independent check substitutes z = exp(−iω) into the difference equations. Hbp = [(1 − S)/2 × (1 − z²)] / [1 − F(1 + S)z + Sz²]. Hv = [(M + 3)/2] / [1 + Σ(j=1…M)((M + 1 − j)/M)zʲ]. The total response is Hbp × Hv. At ω = 2π/20, amplitude is its magnitude and the Voss-stage phase lead in bars is arg(Hv)/ω. This algebraic route does not iterate the time-domain script.

  • At the reference settings, F = 0.9510565163, G = 0.9969173337 and S = 0.9243904917. These coefficients provide a quick check for degrees-versus-radians mistakes.
  • To measure the sine output directly, calculate A = (2/400)Σv[n]sin(ωn) and C = (2/400)Σv[n]cos(ωn) over n = 800…1199. Amplitude = sqrt(A² + C²); phase = atan2(C, A). The measurement window contains 20 complete cycles.

Noise and jumps expose the cost of earlier turns

For the noise fixture, add 0.25sin(2πn/4) to the same 20-bar sine. This deterministic high-frequency disturbance makes the comparison reproducible. Measure the RMS difference between the noisy output and the clean-sine output over samples 800 through 1199. The input disturbance has RMS 0.176777; the band-pass alone reduces it to 0.007297.

  • The jump columns use a separate fixture: x[n] = 0 before index 400 and 1 from index 400 onward. Every output before 400 is exactly zero. At the first jump, b = (1 − S)/2 = 0.0378047542 and v = 6b = 0.2268285250 for Predict 3.
  • At index 410 the Predict 3 output is −0.166868 despite the input remaining at 1. This is ringing after a discontinuity. A later positive or negative turn can come from the filter response rather than a second price event.
  • The predictor leaves less disturbance than the raw input in this fixture, but more than the band-pass alone. Its RMS ratio to the band-pass is 7.6368 at Predict 3. This is one selected frequency, not a universal noise-amplification factor.
  • A narrower bandwidth can reject more unwanted frequencies while prolonging transients. A larger predictor order changes gain and phase together. Neither control supplies an independently adjustable future-price horizon.
PredictResidual disturbance RMSOutput at jump index 400Largest output in indices 400…439
10.0293690.1134140.214334 at 404
20.0394030.1701210.311357 at 401
30.0557240.2268290.415143 at 401

Run the original Pine v6 audit

Paste the complete script into Pine Editor. Keep period 20 and bandwidth 0.25, select the synthetic input, and compare completed-bar Data Window values at the stated Sample index. Change Predict between 1, 2 and 3 for the tables. Synthetic periods remain 20 and 4 bars when the filter period changes, so off-center tests remain possible.

  • Market mode accepts a continuous source and defaults to close. Missing input stops the script rather than inserting a zero price. Flat mode uses 100 and produces zero for both filter outputs.
  • The script uses current input and positive history offsets only. It does not shift plots left, request higher-timeframe data, place orders or estimate a confidence interval.
Original Pine implementation of the public equations with explicit test fixtures. Syntax validation and numerical verification are separate checks.pine
//@version=6
indicator("Voss phase-lead audit", overlay = false, precision = 6, max_bars_back = 100)
source = input.source(close, "Market source")
mode = input.string("20-bar sine", "Input", options = ["Market", "20-bar sine", "Sine plus noise", "Step", "Flat"])
period = input.int(20, "Band-pass period", minval = 10, maxval = 100)
bandwidth = input.float(0.25, "Bandwidth", minval = 0.1, maxval = 0.5, step = 0.05)
predict = input.int(3, "Predict setting", minval = 1, maxval = 3)
order = 3 * predict
x = switch mode
    "20-bar sine" => math.sin(2.0 * math.pi * bar_index / 20.0)
    "Sine plus noise" => math.sin(2.0 * math.pi * bar_index / 20.0) + 0.25 * math.sin(2.0 * math.pi * bar_index / 4.0)
    "Step" => bar_index < 400 ? 0.0 : 1.0
    "Flat" => 100.0
    => source
if na(x)
    runtime.error("Use a continuous input without missing values.")
f = math.cos(2.0 * math.pi / period)
g = math.cos(bandwidth * 2.0 * math.pi / period)
s = 1.0 / g - math.sqrt(1.0 / (g * g) - 1.0)
var float band = 0.0
var float voss = 0.0
band := bar_index < 5 ? 0.0 : 0.5 * (1.0 - s) * (x - x[2]) + f * (1.0 + s) * nz(band[1]) - s * nz(band[2])
float feedback = 0.0
for lag = 1 to order
    feedback += (order + 1.0 - lag) / order * nz(voss[lag])
voss := (order + 3.0) / 2.0 * band - feedback
plot(band, "Band-pass", color = color.aqua, linewidth = 2)
plot(voss, "Voss output", color = color.purple, linewidth = 2)
plot(mode == "Market" ? na : x, "Synthetic input", color = color.gray)
plot(x, "Input value", display = display.data_window)
plot(bar_index, "Sample index", display = display.data_window)
hline(0.0, "Zero")

Keep initialization and stability separate from signal quality

This port holds b at zero for zero-based indices 0 through 4, uses zero for unavailable predictor history and begins band-pass recursion at index 5. That is a declared startup convention; different platform histories and seeds can produce different early values. Five seed bars do not establish a settled filter. The tables deliberately measure much later.

  • Predictor stability concerns decay of internal disturbances; forecast validity concerns the input spectrum and whether its structure persists. These are different claims.
  • Synthetic samples depend on bar_index, so loading earlier chart history shifts their displayed timestamps. Reproduce by Sample index. Chart parity with another author, all parameter combinations and trading profitability have not been established by these fixtures.
ConstraintReason and consequence
P from 10 to 100; B from 0.1 to 0.5These example bounds keep 0 < G < 1 and 0 < S < 1. The band-pass denominator has poles inside the unit circle. They are implementation bounds, not optimized trading settings.
Predict from 1 to 3Orders 3, 6 and 9 give bounded audit choices. The Voss paper studies stability of the recurrence; stability does not imply useful phase lead or small distortion at every frequency.
More loaded historyRepeat at the same later timestamps and compare within a chosen tolerance. Narrow bandwidth and long period can require substantially more warmup than the reference settings.
Open market barClose and the current outputs can change on each update. Pine rollback recomputes from committed history; this script does not accumulate ticks with varip. Use bar-close confirmation for a separately defined alert.

Choose the filter by the quantity you need

Voss, Kalman and Roofing filters answer different modeling questions. Matching chart colors or visual smoothness does not make their outputs interchangeable.

MethodPurposeWhat this page does not infer
Voss after band-passApply fixed delayed feedback to advance selected cyclic components.A calibrated estimate of the next close or a guaranteed turning-point alert.
Kalman estimatorUpdate a state estimate using a chosen transition model and process/measurement uncertainty.That its covariance or model assumptions are supplied by a Voss recurrence.
Ehlers Roofing FilterCombine high-pass and low-pass filtering to isolate a useful frequency range.That spectral conditioning alone performs the Voss feedback calculation.

Give the coding agent an acceptance table

Ask the Pine Script AI Coding Agent to adapt this public recurrence with the same weights, startup and diagnostic plots. Supply the sine and step values as acceptance targets, then explicitly request a syntax check where available. Review the generated source and compare closed-bar outputs before adding alerts or strategy rules. The task needs public formulas, not copied proprietary indicator code.

  • For an alert, specify whether the event is a zero crossing, a Voss/band-pass crossing or a slope reversal, and whether it requires a closed bar. These are distinct conditions.
  • For a strategy, define exits, execution timing, position sizing and costs separately. A filter lead measurement contains no evidence about net returns.
Where Pineify fits

Pine Script AI Coding Agent

Draft and revise a public filter with explicit equations and diagnostic outputs. Request syntax checking and compare the result with the numerical fixtures.

Draft a Voss filter audit

Frequently asked questions

Educational signal-processing examples, not investment advice. Synthetic response measurements are not backtest or live performance results. Phase lead, numerical agreement and syntax validation do not establish trading profitability.

Sources and verification

Published by Pineify. Pineify is an independent product and is not affiliated with TradingView. Sources support the technical explanations; examples do not establish trading performance.