TradingView indicator calculations

Ehlers Roofing Filter: band-pass components

The Ehlers Roofing Filter combines a two-pole high-pass filter with a SuperSmoother. The first suppresses slow drift; the second attenuates fast fluctuations. This page uses Code Listing 2 of John Ehlers' 2013 paper Predictive Indicators, with periods 48 and 10. Its output is a filtered series around zero, not a smoothed estimate of the price level or a forecast. The response chart and synthetic fixture below make the period and initialization choices reproducible.

See the decision guide

Read the public two-stage recurrence

Let P be the input, H the high-pass output and R the final Roofing output. Brackets mean earlier bars. The table expresses trigonometric arguments in radians; the original EasyLanguage listing uses degrees. The example preserves its rounded constants 0.707, 1.414 and 3.14159 so that replacing them with square roots and a more precise pi does not silently change the reference.

  • At HP = 48 and LP = 10: α = 0.088513480, k = 0.913445179, c1 = 0.253135177, c2 = 1.158161019 and c3 = −0.411296196. These are rounded displays, not rounded calculation inputs.
  • The smoother consumes H, not the original price. Applying it to price would leave the slow drift that the high-pass stage was intended to suppress.
  • A moving average preserves a constant price level. This high-pass stage has zero response to a constant input and zero second difference for a linear ramp. A Kalman filter requires a state model and noise assumptions; it is not this fixed recurrence.
StageFormula
High-pass coefficientsθ = 0.707 × 2π / HP; α = (cos θ + sin θ − 1) / cos θ; q = 1 − α; k = (1 − α/2)²
High-pass recurrenceH = k(P − 2P[1] + P[2]) + 2qH[1] − q²H[2]
Smoother coefficientsa = exp(−1.414 × 3.14159 / LP); c2 = 2a cos(1.414π / LP); c3 = −a²; c1 = 1 − c2 − c3
Roofing recurrenceR = c1(H + H[1])/2 + c2R[1] + c3R[2]

See which cycle periods survive

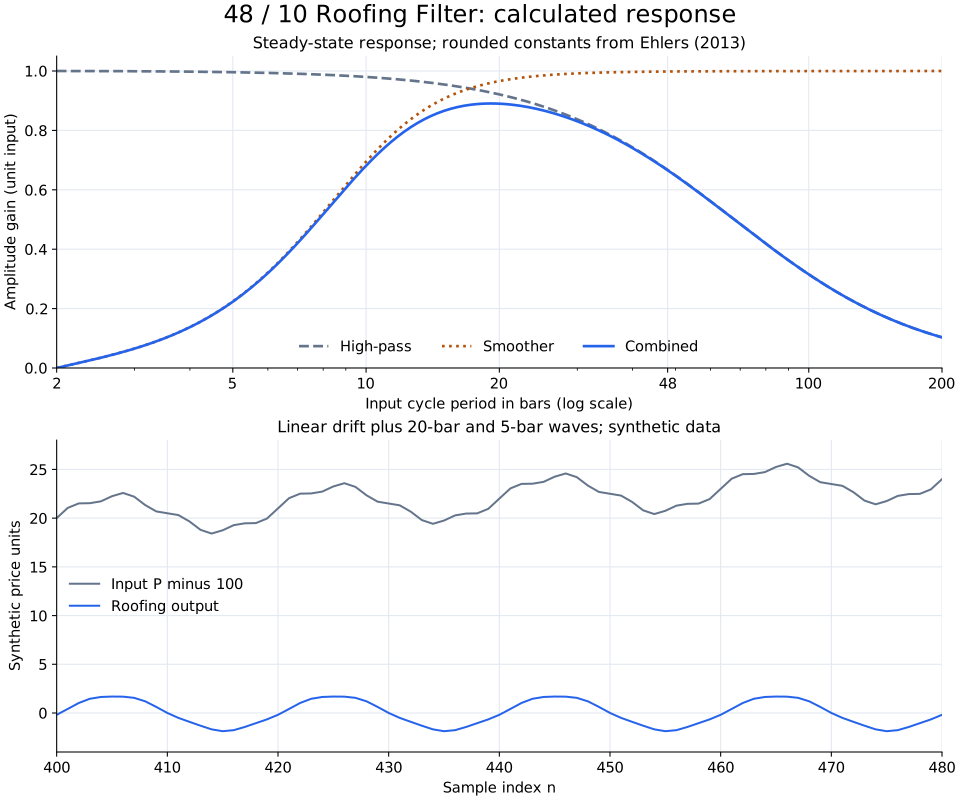
The upper chart plots steady-state amplitude gain against input period. Each component is a unit sine wave, so gain 0.89 means output amplitude 0.89 after startup effects decay. The combined gain is the product of the two stage gains. This is a calculation from the stated coefficients, not an observed market spectrum or a trading performance chart.

Calculated gain curves for high-pass, smoother and combined Roofing filter, with a synthetic rising input before and after filtering.
Top: amplitude response at HP 48 and LP 10. Bottom: the synthetic fixture at samples 400 to 480; gray is input minus 100, blue is Roofing output. Numerical values follow below. View original source
  • For an independent frequency check, put z = exp(−i2π/T), H(z) = k(1 − z)² / (1 − 2qz + q²z²), and S(z) = c1(1 + z) / [2(1 − c2z − c3z²)]. The last column is |H(z)S(z)| at period T.
  • A 100-bar component remains at about 31.5% of its original amplitude. If that input component is ten times larger than the 20-bar component, its output can still dominate. Filtering does not guarantee a zero sample mean or a dominant tradable cycle.
  • The chart shows amplitude, not phase. The recurrence also changes phase, so peaks and zero crossings need not stay on their original bars.
Input periodHigh-pass gainSmoother gainCombined
5 bars0.9959540.2241360.223229
10 bars0.9800940.6949540.681120
20 bars0.9212540.9660990.890022
48 bars0.6670520.9983440.665947
100 bars0.3153430.9997850.315275

Choose periods as a frequency range

A period counts chart bars. HP 48 means a different elapsed duration on a five-minute chart and a daily chart. Increasing HP admits slower components; increasing LP suppresses more of the short-period components. Keep LP shorter than HP when specifying the intended band, then test the response instead of assuming a setting is optimal for a symbol.

  • The sample code restricts HP to at least 4 and LP to at least 3, and rejects LP ≥ HP. These are explicit implementation limits, not a claim that every public Roofing script uses the same controls.
  • Periods near each other leave a narrower, more attenuated response. Changing one input also changes the waveform and crossing times, so carry those settings into any alert specification.
  • Document chart type, source, session and timeframe. Standard close and Heikin Ashi close are different inputs even if the indicator settings match.

Remove known drift from a synthetic signal

Use P[n] = 100 + 0.05n + 2 sin(2πn/20) + 0.4 sin(2πn/5), starting at n = 0. This invented series contains a linear rise, a 20-bar cycle and a smaller 5-bar cycle. Set H and R to zero at n = 0 and 1, then apply both recurrences from n = 2. The chart shows the price minus its constant 100 offset so the rising baseline remains visible.

  • From n = 400 to 420 the input rises by 1. Both waves return to the same phase, while the Roofing output repeats to six decimals. The filter rejects the linear component under the stated zero-seed convention.
  • The expected steady amplitudes are 2 × 0.890022 = 1.780044 for the 20-bar wave and 0.4 × 0.223229 = 0.089292 for the 5-bar wave. Their phase-shifted sum explains why the table is not a pure sine wave.
  • A market trend is rarely an exact linear ramp. Curvature, gaps and abrupt price changes have other frequency components and can appear in the output. The synthetic result therefore cannot establish that a real trend has been completely removed.
nInput PHigh-pass HRoofing R
400120.0000001.043107−0.183561
405122.2500001.6029021.689276
410120.500000−0.9419550.007135
415118.750000−1.501750−1.865701
420121.0000001.043107−0.183561

Declare initialization and missing-data behavior

The Pine example uses zero states for the first two samples and calculates continuously thereafter. This is an explicit port convention; the paper's recurrence alone does not specify how every charting platform supplies its initial history. Hiding the first 200 bars affects display and alerts, not the internal calculation.

  • The high-pass homogeneous response has a repeated root q, approximately 0.911487 at HP 48. Startup differences can contain (A + Bn)qⁿ; two samples are enough to evaluate the recurrence but do not prove convergence.
  • The 200-bar gate is a demonstration default, not a universal tolerance. Longer periods retain startup effects longer. Load more earlier bars and compare the same later timestamps before accepting numerical agreement.
  • Use a continuous finite source. This example deliberately does not replace missing source values with zero. A missing value propagates into recursive state; correct the input or explicitly implement and document a reset/reseed policy.
  • A flat input gives zero with these seeds. A downstream stochastic normalization can then have a zero high-minus-low denominator. Define that separate indicator's fallback instead of dividing by zero.

Audit the filter in Pine Script v6

Paste the indicator into Pine Editor. Enable the synthetic option to reproduce the table, keep periods 48 and 10, and inspect Input, High-pass output, Roofing output and Sample index in the Data Window on completed bars. The sample disables alerts in synthetic mode. Switch back to a market source before creating alerts.

  • The code calculates on each update and exposes the two filter plots after the warm-up and confirmation gate. The current market close can change before the bar closes; barstate.isconfirmed gates events on the current chart timeframe.
  • An upward zero crossing requires R > 0 now and R[1] ≤ 0. A crossing of R above R[1] is a different event: a change in filtered slope. Do not interchange them when comparing scripts.
  • Use Once Per Bar Close when creating the TradingView alert. A confirmed crossing is not proof of a price reversal. On choppy data, crossings can reverse quickly; after a price jump, recursive filters can produce a decaying oscillation.
Public-formula implementation with explicit startup, diagnostic plots and chart-bar-close zero-crossing conditions. It does not place strategy orders.pine
//@version=6
indicator("Roofing Filter 2013 calculation audit", overlay = false, precision = 6)
hpPeriod = input.int(48, "High-pass period", minval = 4)
smoothPeriod = input.int(10, "Smoother period", minval = 3)
source = input.source(close, "Market source")
useFixture = input.bool(false, "Use synthetic drift and cycles")
warmup = input.int(200, "Hide first bars", minval = 2)
if smoothPeriod >= hpPeriod
    runtime.error("Smoother period must be shorter than high-pass period.")
n = bar_index
p = useFixture ? 100.0 + 0.05 * n + 2.0 * math.sin(2.0 * math.pi * n / 20.0) + 0.4 * math.sin(2.0 * math.pi * n / 5.0) : source
theta = 0.707 * 2.0 * math.pi / hpPeriod
alpha = (math.cos(theta) + math.sin(theta) - 1.0) / math.cos(theta)
q = 1.0 - alpha
a = math.exp(-1.414 * 3.14159 / smoothPeriod)
c2 = 2.0 * a * math.cos(1.414 * math.pi / smoothPeriod)
c3 = -a * a
c1 = 1.0 - c2 - c3
float hp = 0.0
float roof = 0.0
if n >= 2
    hp := math.pow(1.0 - alpha / 2.0, 2) * (p - 2.0 * p[1] + p[2]) + 2.0 * q * hp[1] - q * q * hp[2]
    roof := c1 * (hp + hp[1]) / 2.0 + c2 * roof[1] + c3 * roof[2]
up = ta.crossover(roof, 0.0)
down = ta.crossunder(roof, 0.0)
ready = n >= warmup and barstate.isconfirmed
plot(ready ? roof : na, "Roofing output", color = color.blue, linewidth = 2)
plot(ready ? hp : na, "High-pass output", color = color.gray)
hline(0.0, "Zero")
plot(p, "Input", display = display.data_window)
plot(n, "Sample index", display = display.data_window)
alertcondition(ready and up and not useFixture, "Roof crosses above zero", "Roofing output crossed above zero on a confirmed bar")
alertcondition(ready and down and not useFixture, "Roof crosses below zero", "Roofing output crossed below zero on a confirmed bar")

Give Pineify a verifiable implementation request

Ask the Pine Script AI Coding Agent to draft or review this public 2013 recurrence with the exact constants, two period inputs, zero seeds, continuous calculation and confirmed-bar conditions. Include the synthetic formula and table, and request intermediate Data Window values. Review the source, run a syntax check and compare numbers in TradingView before enabling alerts.

  • A public indicator name does not establish its formula. The everget TradingView listing identifies an Ehlers source and records a correction to the SuperSmoother high-pass input. Check the author, version and actual source when comparing implementations.
  • Provide an algorithm or source you may use. This workflow does not reconstruct protected code. A successful syntax check does not prove numeric agreement, market prediction or profitability.
  • Strategy entries, exits, position size, fees, slippage and fill timing require separate rules. This filter specification alone does not define a tradable system.
Where Pineify fits

Pine Script AI Coding Agent

Draft or review the public Roofing Filter recurrence, initialization and confirmed-bar conditions, with intermediate outputs for numerical comparison.

Draft a Roofing Filter script

Frequently asked questions

Educational information, not investment advice. Synthetic calculations describe filter behavior, not historical or live trading performance. Parameter choices, zero crossings and syntax validation do not guarantee returns.

Sources and verification

Published by Pineify. Pineify is an independent product and is not affiliated with TradingView. Sources support the technical explanations; examples do not establish trading performance.