TradingView indicator comparisons

WMA vs EMA on TradingView: finite weights vs recursive smoothing

WMA gives the latest N prices linearly decreasing weights and drops older prices completely. EMA updates recursively, so an old price contribution decays exponentially. With the usual EMA factor 2 / (N + 1), both methods give the newest price exactly the same weight at equal lengths. Their later responses differ: WMA forgets a price spike after N bars, while EMA retains a fading tail. Neither weighting method guarantees more stable crosses or better trades.

See the decision guide

Linear weights end; exponential weights keep shrinking

Let age k = 0 mean the newest observation. For a complete series and positive integer length N, WMA assigns weight (N − k) / [N(N + 1)/2] for ages 0 through N − 1, then zero. EMA updates as alpha × current close + (1 − alpha) × previous EMA, where alpha = 2 / (N + 1). A past input has coefficient alpha × (1 − alpha)^k. An initialized EMA also carries a shrinking contribution from its seed.
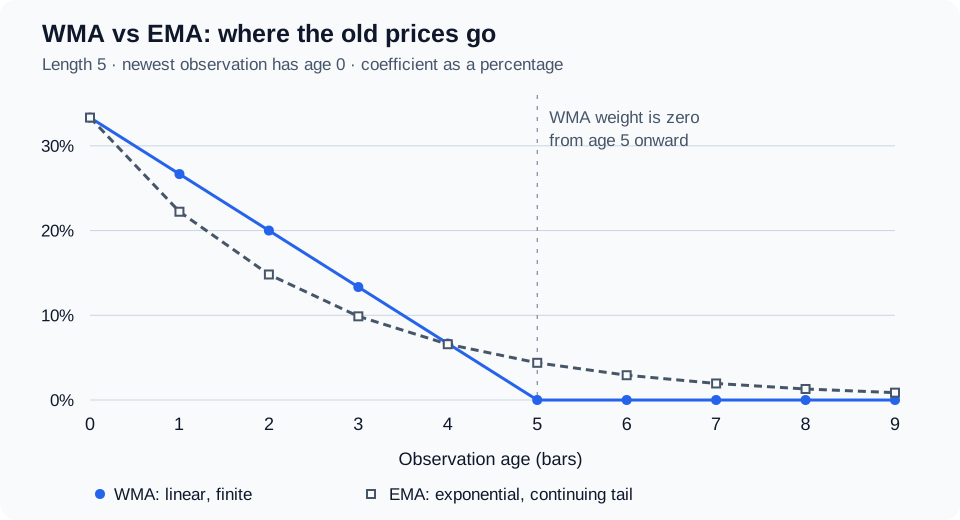
Length-five weights by age: WMA falls linearly from 33.333 percent to zero at age five; EMA decays exponentially and remains positive beyond age five.
Calculated length-5 input coefficients. Markers are discrete observations; connecting lines guide the eye. EMA continues beyond the plotted history. View original source
  • The newest WMA weight is N / [N(N + 1)/2] = 2 / (N + 1), exactly the usual EMA alpha. Describing one as always reacting more strongly to the newest price is incorrect at equal lengths.
  • The five WMA weights sum to 1. The latest five EMA coefficients sum to 1 − (2/3)^5 = 0.868313. The remaining 0.131687 belongs to older history, or to the previous initialized state when only five updates are expanded.
  • At N = 1, both equal the current source. Zero and negative lengths are outside this comparison. These calculations assume a complete series; do not replace missing prices with zero.
Age in barsWMA (5) weightEMA (5) coefficient
0: newest33.333%33.333%
126.667%22.222%
220.000%14.815%
313.333%9.877%
4: oldest WMA input6.667%6.584%
5: outside WMA window0%4.390%
All ages 5 and older, combined0%13.169% in the infinite-history model

A single abnormal close: follow it out of the window

This is a synthetic calculation, not a market backtest. Start with five closes of 100 and seed EMA at 100. Use length 5 for both. Bar 1 closes at 115, then every later bar closes at 100. The spike is 15 units above the baseline. Its WMA contribution is 15 × (6 − t)/15 for bars t = 1 through 5, then zero. Its EMA contribution is 5 × (2/3)^(t − 1). Round only the displayed values.

  • For bar 2, WMA = (5 × 100 + 4 × 115 + 3 × 100 + 2 × 100 + 100) / 15 = 104. EMA = (1/3) × 100 + (2/3) × 105 = 103.333333.
  • From bar 5 to bar 6, WMA loses the final one-unit contribution from the spike. This is the last equal decrement in its linear decay, not an extra large discontinuity. EMA loses about 0.329218 units on that update and still holds a tail.
  • A bad data print and a real one-bar price jump have the same arithmetic effect if the input prices match. Check the data feed before interpreting either as a trading event. Correcting historical data can change both lines.
Bar after initializationCloseWMA (5)EMA (5)
0: initialized100100.000100.000
1: spike arrives115105.000105.000
2100104.000103.333
3100103.000102.222
4100102.000101.481
5: spike is oldest WMA input100101.000100.988
6: spike leaves WMA100100.000100.658
7100100.000100.439
8100100.000100.293

Crossover stability depends on which lines you compare

For a WMA/EMA up cross, require current WMA > current EMA and previous WMA ≤ previous EMA. Reverse the inequalities for a down cross. In the spike sample, WMA crosses above EMA on bar 2 and below it on bar 6. The second cross occurs while closes remain 100: the two filters are forgetting the same old spike differently. It is not evidence of a fresh price decline.

  • Price crossing its own average is a different rule. Define an up cross as current close > current average and previous close ≤ previous average. Both methods give an up cross on bar 1 and a down cross on bar 2. WMA equaling price on bar 6 is not a new cross under these strict current-bar inequalities.
  • For a range test, reset both to 100 and use closes 102, 98, 102, 98, 102, 98, 102, 98. Both produce one initial price up cross and seven later direction changes. On bar 5, WMA is 100.400 and EMA is 100.453; on bar 6, they are 99.600 and 99.635. Different values do not prevent identical whipsaws.
  • Closed-bar evaluation removes decisions based on temporary intrabar crosses, but every cross in these examples already uses completed closes. A minimum separation or persistence rule may reduce activity while delaying signals. Test that changed rule separately.

Choose a memory rule, then compare it on TradingView

WMA fits a specification that must exclude all observations older than N bars. EMA fits a specification that should keep older information with a diminishing influence. These are implementation choices, not proof of a trading edge. Equal length controls the input setting but does not make the two filters identical in smoothness or effective memory.

  • Add the built-in Weighted Moving Average and Exponential Moving Average to one standard candlestick chart. Set both lengths to 5, use Close, keep offsets at zero, and compare the primary average plots rather than extra smoothing lines.
  • Record symbol, exchange feed, timeframe, session, adjustments and loaded history. Inspect values on the same closed candle. EMA needs a starting value, so differing history or initialization can explain a mismatch across platforms.
  • Select trend and range periods before assessing results. Keep the crossing definition fixed and record both the count of signals and how many reverse within your chosen horizon. Reserve later data for a separate check.
  • If you convert signals into a strategy, hold position size, entry and exit logic, commission, slippage and fill timing fixed. A calculated cross is not an executed trade, and fewer crosses do not establish higher returns.

Specify the comparison before asking for Pine Script

The Pine Script AI Coding Agent can draft code from your written rules. Specify the source, length, WMA/EMA selection, plotted outputs and exact crossing inequalities. Include whether signals require a closed candle and how orders should fill. Request a syntax check, then inspect the calculations and timestamps in TradingView.

  • Use the spike table as an expected-output fixture for a synthetic test. A syntax check addresses supported compilation errors; it does not prove that the code matches the fixture or that a trading rule is profitable.
  • The workflow uses rules you can describe and review. It does not promise access to proprietary scripts, account migration or automatic trade execution.
Where Pineify fits

Pine Script AI Coding Agent

Draft your specified WMA or EMA rules as Pine Script, request a syntax check, and review the output before testing it on TradingView.

Draft my moving-average rules

Frequently asked questions

Educational comparison, not investment advice. Numerical examples use synthetic prices and calculated filter responses, not backtests or live results. Neither average predicts future prices or guarantees returns. Review generated code and execution assumptions independently.

Sources and verification

Published by Pineify. Pineify is an independent product and is not affiliated with TradingView. Sources support the technical explanations; examples do not establish trading performance.