TradingView chart patterns

Diamond bottom pattern: verify the base before the breakout

A diamond bottom pattern is a potential reversal base after a decline. Swings first expand into higher highs and lower lows, then contract into lower highs and higher lows. A bullish interpretation needs a break above the descending upper boundary. The name describes the location and shape, not a guaranteed upward outcome. This guide requires a completed close above that line and records volume separately.

See the decision guide

Follow a declining market into an expanding base

This original diagram uses invented prices and bar numbers on an arithmetic scale. The decline arrives before L1. L2 undercuts L1 while H2 exceeds H1, so both edges widen. The next two low-high pairs stay inside those extremes. That contraction supplies the descending resistance line used for an upside confirmation. The bottom is a multi-swing base, not one bullish candle.
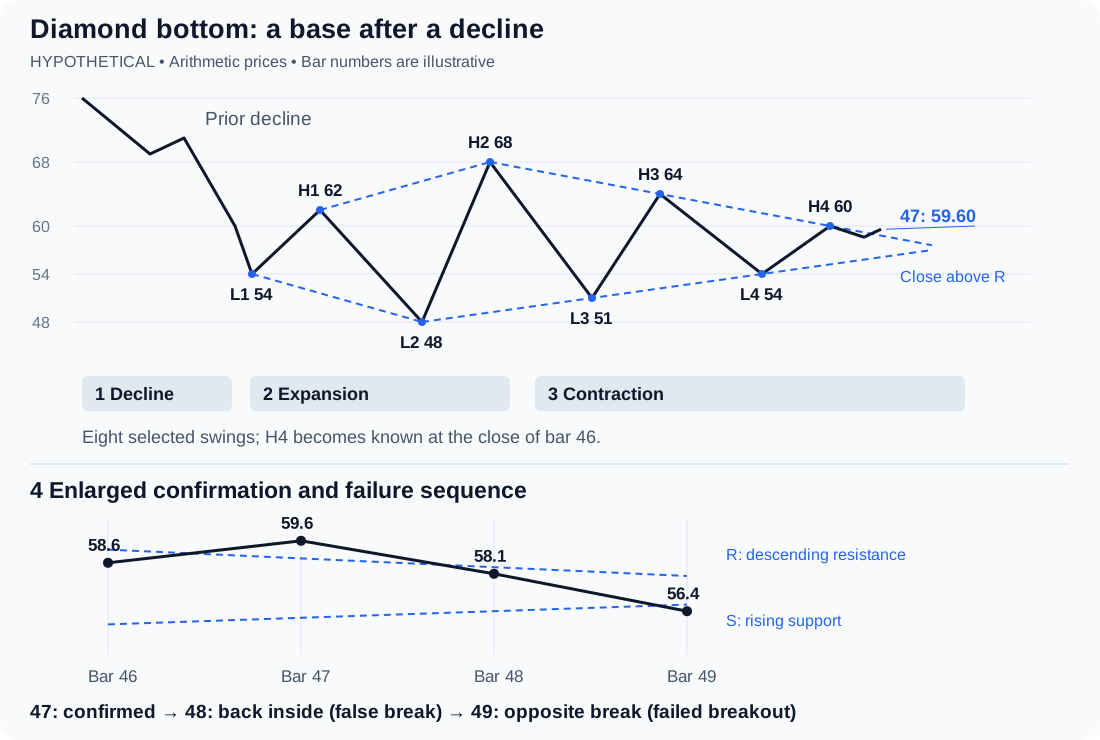
Hypothetical diamond bottom: a prior decline enters widening lows and highs, followed by narrowing swings; a close at bar 47 confirms above resistance, then closes at 48 and 49 show a false breakout and opposite break.
Original teaching example. The lower panel enlarges bars 46 to 49 to separate confirmation, return inside and the opposite break. All prices are hypothetical. View original source
StageLow: bar / priceHigh: bar / price
First swing pairL1: 10 / 54H1: 14 / 62
Expansion extremesL2: 20 / 48H2: 24 / 68
First narrower pairL3: 30 / 51H3: 34 / 64
Second narrower pairL4: 40 / 54H4: 44 / 60

Turn the visual outline into a review rule

Bulkowski describes the broadening-to-narrowing sequence, but a repeatable review also needs explicit swing selection and tolerances. The following choices belong to this teaching example. They are not universal diamond requirements or TradingView indicator settings. Use positive prices and standard candles from one symbol, timeframe and session setting.

  • The high at bar 34 is exactly on the H2-H4 line; the low at bar 30 is exactly on the L2-L4 line. A low of 51.50 at bar 30 would miss this chosen tolerance.
  • Reject a candidate if completed closes already crossed its applicable edges between the selected anchors or during the final confirmation delay. Do not redraw the lines to absorb a break.
  • Two anchors determine each line, so the extra right-side touches test the fit. A detector also needs a fixed policy for overlapping candidates; this example reviews one labeled candidate at a time.
DecisionIllustrative ruleExample result
Declining contextClose before L1 is at least 10% below the close nine bars earlierClose 0 = 76; close 9 = 60; decline = 21.05%
Swing selectionEach low is strictly below two lows on each side; each high strictly above two highs on each side; reject ties or a bar qualifying as bothH4 at bar 44 is known only after bar 46 closes
Expansion then contractionL2 < L1 and H2 > H1; then L2 < L3 < L4 and H2 > H3 > H448 < 54; 68 > 62; 48 < 51 < 54; 68 > 64 > 60
Touch toleranceIntermediate right-edge touches may deviate by at most 2% of total heightHeight = 68 - 48 = 20; tolerance = 0.40
Available windowFreeze anchors after H4 confirmation; evaluate subsequent closes while upper resistance remains above lower supportFirst eligible close is bar 47; last is bar 50

Calculate the breakout line and volume separately

Resistance joins H2 at bar 24 and price 68 to H4 at bar 44 and price 60. Its value is R(t) = 68 - 0.4 × (t - 24). Support joins L2 and L4: S(t) = 48 + 0.3 × (t - 20). At bar 47, resistance is 58.80 and support is 56.10. These lines meet at bar 50.86; stop evaluating new breaks before that intersection.

  • Define the volume baseline as the mean of the previous 20 completed bars, excluding the breakout bar. In this example they total 2,000,000 shares. The 1.50 threshold is an assumption for comparison, not evidence of a profitable filter.
  • A high of 59.60 but a close of 58.70 at bar 47 does not pass the close rule. If the close passes but volume is only 90,000 shares, record a price break with relative volume 0.90; it fails the optional volume filter without erasing the price event.
  • Use comparable sessions and the same volume units. Missing or zero baseline volume makes the ratio unavailable. A daily share-volume example cannot be transferred unchanged to tick volume or an intraday opening bar.
  • An entry would need separate execution rules. A close of 59.60 does not establish the next available fill, and the 78.80 projection does not account for intervening resistance, fees or slippage.
ObservationCalculationInterpretation
Previous close, bar 4658.60 ≤ R(46) = 59.20Still inside when the final swing becomes known
Current close, bar 4759.60 > R(47) = 58.80First eligible close above resistance
Breakout volume180,000 shares / 100,000 prior average = 1.80Above the chosen 1.50 relative-volume threshold
Optional height projectionR(47) + 20 = 78.80Geometric reference only; no target-hit probability

Keep confirmation, failure and invalidation distinct

An upward close confirms only the observed break. In the illustrated continuation, bar 48 closes at 58.10, below R(48) = 58.40 but above S(48) = 56.40. Bar 49 then closes at 56.40, below S(49) = 56.70. The first return is a false breakout under this convention; the later opposite break is a failed breakout. Preserve both events when reviewing the setup.

  • A retest that stays above resistance differs from a close back inside. If a retest is required, set its time limit and tolerance before inspecting the outcome; it may never occur.
  • A stop at the last swing low and a stop below the entire formation expose different amounts of capital. Neither prevents a worse fill through a gap. Record the stop, position size and exit horizon before evaluating trades.
Path from the same frozen candidateRuleRecorded state
No upward break; bar 47 closes at 55.9055.90 < S(47) = 56.10Bullish candidate invalidated before confirmation
Closes remain between both edges through bar 50No eligible close outside either boundaryExpired at the line intersection; no breakout
59.60 at bar 47, then 58.10 at bar 48Above resistance, then back below itConfirmed, then false breakout
After that return, 56.40 at bar 49Close below the opposite boundaryFailed breakout with an opposite break

A thin-market diamond can pass a volume ratio and still mislead

The SEC warns that small trades can have a large percentage price impact in low-volume microcap stocks. The following separate hypothetical stock shows why relative volume alone cannot resolve that problem. A few isolated prints can define an attractive outline without demonstrating that meaningful size could trade near the plotted prices.

  • Set liquidity exclusions before collecting examples. One possible review policy rejects a candidate when any selected pivot has a zero-volume bar in its five-bar neighborhood or the observed spread exceeds 1% of the midpoint. These are teaching thresholds, not a market-wide standard.
  • A historical OHLCV screenshot cannot establish the bid-ask spread or order-book depth at the break. If quotes are unavailable, mark the execution check unknown instead of assuming a narrow spread.
  • Inspect isolated long wicks, session gaps and repeated unchanged closes against the underlying data. Low activity is a reason to investigate the outline, not proof that every diamond in that instrument is false.
Thin-market observationCalculationReview consequence
Previous 20 bars average 1,000 shares; breakout bar trades 2,000Relative volume = 2.00Passes the example 1.50 filter, but absolute activity remains small
Resistance 2.10; last trade closes at 2.12Break distance = 0.02A price confirmation exists under the close rule
Contemporaneous bid 1.98; ask 2.22Spread = 0.24; midpoint = 2.10; spread / midpoint = 11.43%The spread is twelve times the break distance; 2.12 is not an executable buy quote
Several bars around a selected touch have zero volumeNo participation evidence for those intervalsFlag the touch for source-data review; do not count repeated stale prices as independent tests

Review the screenshot, then specify what a script must know

On TradingView, retain the prior decline, volume pane, symbol, timeframe and scale in the screenshot. Label L1 through H4 and both right-side lines. The official All Chart Patterns list checked on October 17, 2026 does not include Diamond; community detectors can use different rules. A pivot marker drawn on bar 44 must not be mistaken for a signal available on that bar.

  • Use AI Chart Analysis to review the labeled screenshot and ask whether expansion precedes contraction. Check its interpretation against the numerical anchors; image analysis cannot verify hidden candles or historical liquidity.
  • Give Pine Script AI Coding Agent the swing definition, confirmation delay, 0.40 touch tolerance, line equations, expiry time and optional volume filter. Request separate candidate, price-break, volume-pass and failure states rather than one unexplained buy label.
  • Review generated code, validate its Pine syntax and compare events with manually labeled cases before testing any trading rules. Include low-volume exclusions and failed breaks; this page provides no measured recognition accuracy.
Where Pineify fits

AI Chart Analysis

Upload a screenshot with the prior decline, labeled swings and volume pane for a review of the visible candidate structure.

Also useful: Pine Script AI Coding Agent. Turn explicit swing, tolerance, volume and confirmation rules into a Pine Script draft for inspection and testing.

Review a chart screenshot

Frequently asked questions

Educational information, not investment advice. Prices, volumes, spreads and thresholds are hypothetical. This page reports no backtest, live returns or detection accuracy. Pattern confirmation does not guarantee a reversal or an executable price.

Sources and verification

Published by Pineify. Pineify is an independent product and is not affiliated with TradingView. Sources support the technical explanations; examples do not establish trading performance.