TradingView chart patterns

Diamond top pattern: expansion, contraction and the break

A diamond top pattern is a potential bearish reversal after an advance. Its swings first widen, with higher highs and lower lows, then narrow, with lower highs and higher lows. Four boundary lines outline the diamond. A bearish interpretation needs a defined break below the lower right boundary; the shape alone does not confirm a reversal. This guide uses a completed close below that rising support line.

See the decision guide

Read the diamond in stages

The diagram is an invented price path on an arithmetic scale, not a market screenshot or a backtest. H1 to H2 and L1 to L2 define the expanding half. H2 to H4 and L2 to L4 define the contracting half, with H3 and L3 as additional touches. The prior rise belongs outside the diamond. Unequal left and right durations do not by themselves reject the shape.
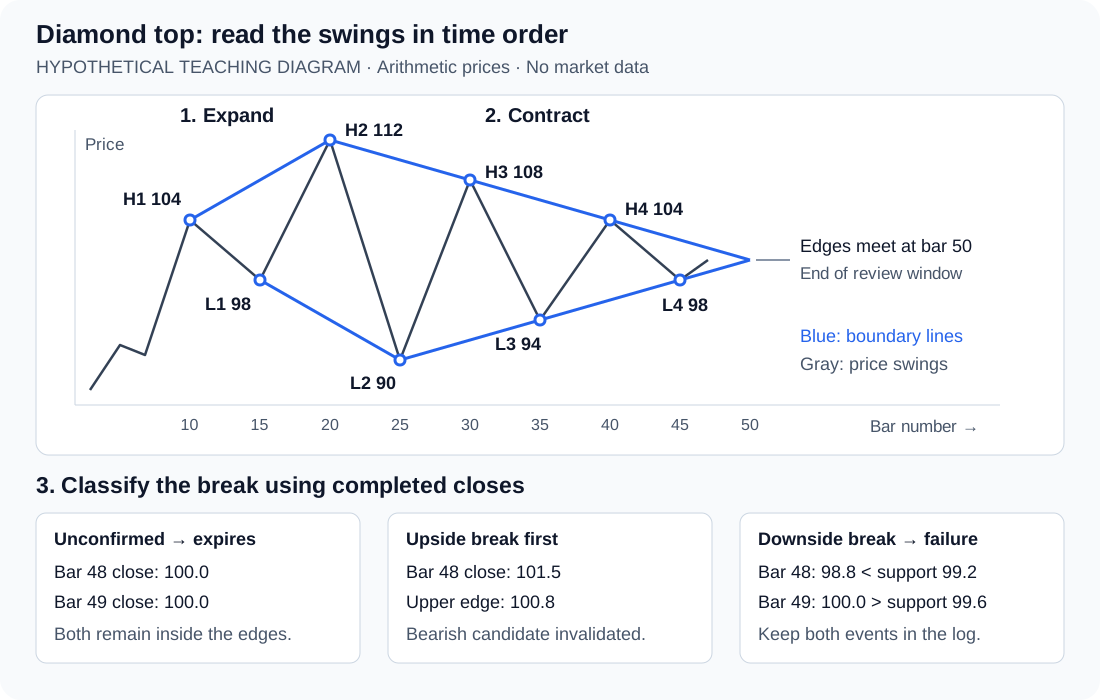
Hypothetical diamond top with eight alternating swings, expanding left boundaries, contracting right boundaries, and separate unconfirmed, upside-break and failed-break outcomes.
Original teaching diagram. Numbered bars and prices are hypothetical; the outcome cards show alternative paths after the same candidate. View original source
StageHigh touches: bar / priceLow touches: bar / price
ExpansionH1: 10 / 104; H2: 20 / 112L1: 15 / 98; L2: 25 / 90
ContractionH3: 30 / 108; H4: 40 / 104L3: 35 / 94; L4: 45 / 98

Make touches and tolerances explicit

The following review protocol is a custom teaching example, not a universal definition or a TradingView detector setting. Assume eight alternating swings have been selected in time order. Each high must exceed the highs of the two bars on either side; each low must be below the lows of the two bars on either side. Reject ties and bars that qualify as both. A swing is usable only after its second following bar closes.

  • H3 is exactly on the line through H2 and H4; L3 is exactly on the line through L2 and L4. A low at 94.5 on bar 35 would miss this chosen tolerance because 0.5 > 0.44.
  • Two points define a line, so the left edges alone provide no independent fit check. More touches can be required, but they change the candidate sample and the time needed to recognize it.
  • Freeze the eight selected swings and all four lines when the candidate becomes eligible. Reject a historical formation if any completed close between its selected endpoints already lay outside its applicable boundaries. Do not widen lines after seeing a losing break.
CheckExample ruleResult for the diagram
Prior advanceClose before H1 must exceed the close 9 bars earlierClose 9 = 102; close 0 = 90: passes
ExpansionH2 > H1 and L2 < L1112 > 104 and 90 < 98
ContractionH2 > H3 > H4 and L2 < L3 < L4112 > 108 > 104; 90 < 94 < 98
Touch countTwo touches per left edge; three per right edge, including shared extremesEight distinct swings; H2 and L2 each belong to two edges
Touch toleranceIntermediate right-edge touch is within 2% of total height DD = 112 - 90 = 22; allowance = 0.44
Time windowAfter L4 is confirmed, but before the right edges intersectEligible from bar 47; intersection at bar 50

Calculate the rising confirmation line

The lower right boundary plays the confirmation role sometimes called a neckline. It need not be horizontal. In this example, use L2 at bar 25 and price 90, and L4 at bar 45 and price 98. At bar t, support is S(t) = 90 + 0.4 × (t - 25). The upper right boundary is U(t) = 112 - 0.4 × (t - 20). These equations use bar spacing and arithmetic prices.

  • Require the previous close to be at or above S(t - 1), and the current completed close to be below S(t). At bar 48, 100.0 ≥ 98.8 and 98.8 < 99.2 both pass.
  • A wick below 99.2 with a close at 99.4 does not confirm at bar 48. An intrabar alert would test a different event.
  • Using L4 price 98 as a flat neckline would miss this example break. Recalculate the sloping line at each bar without changing its anchors.
  • If projecting one full height from the boundary at the break, the reference is 99.2 - 22 = 77.2. This is a chosen geometric projection, not a forecast, target-hit probability or evidence of a profitable trade.
BarS(t)U(t)Hypothetical close and interpretation
4798.8101.2100.0: inside; L4 is now known
4899.2100.898.8: first eligible close below support
4999.6100.4100.0: support reclaimed; failed-break event
50100.0100.0Edges intersect; this example stops evaluating the candidate

Separate an unfinished shape from a failed breakdown

Use the same frozen candidate for each alternative below. Before confirmation, a completed close above U(t) invalidates the bearish setup. If neither edge is broken before bar 50, it expires. After a downside confirmation, this example records failure on the first later close back above S(t), while the two edges remain separate. A different failure rule needs a different outcome label.

  • An optional retest rule changes the entry sample. Specify its duration, permitted distance from support and required closing side before reviewing results; some declines never retest.
  • A pattern event is not a complete trade. Entry timing, position size, stop orders, holding period, commissions and slippage still need rules. A close-based failure event is not a guaranteed fill price.
  • Keep invalidated, expired and failed candidates in the log. Saving only intact diamonds or successful declines cannot establish a success rate.
PathObserved closesClassification
Still insideBar 48: 100.0; bar 49: 100.0No break; candidate expires at bar 50
Upside break firstBar 48: 101.5 > U(48) = 100.8Bearish candidate invalidated before confirmation
Downside break, then reclaimBar 48: 98.8 < 99.2; bar 49: 100.0 > 99.6Confirmed at 48, failed at 49; retain both events

Review the candidate on TradingView without hindsight

Use a chart with the symbol, timeframe and price scale visible. Mark the eight selected swings, draw the four edges, and advance the chart one bar at a time through the right half. TradingView documents that pivot markers placed on past bars can hide when the script first knew the pivot. Here, L4 at bar 45 is usable only at the close of bar 47.

  • Keep swing time, swing-confirmation time and breakout time in separate fields. A breakdown before the final required pivot becomes known cannot be presented as an earlier signal from these rules.
  • Record standard candle prices and the chart scale. The arithmetic line equations on this page do not reproduce straight lines drawn in logarithmic price space.
  • TradingView's official All Chart Patterns list, checked on October 17, 2026, does not list Diamond. This is a manual review example, not a claim that a built-in diamond detector exists; community scripts may use other rules.

Use Pineify to review the picture, then specify the detector

Upload a screenshot to AI Chart Analysis with the full prior advance, visible symbol and timeframe, and your H1 to L4 labels. Ask it to explain whether expansion precedes contraction and which right-side boundary price has crossed. Compare the response against the plotted prices; a screenshot review does not verify every historical candle or measure detection accuracy.

  • For a scripted version, give Pine Script AI Coding Agent the swing definition, tie handling, eight-touch requirement, 0.44 example tolerance, eligibility time, line equations and expiry rule. Specify how a rolling detector chooses between overlapping candidates before requesting code.
  • Check generated code and its syntax, then compare its marked events with a fixed set of manually labeled examples. Include upside breaks, early breaks and support reclaims in that sample.
  • The numerical settings on this page are teaching assumptions. No measured win rate, preferred market or best timeframe is established.
Where Pineify fits

AI Chart Analysis

Upload a labeled chart screenshot for a second reading of the candidate structure. Review the response against the visible swings and confirmation line.

Also useful: Pine Script AI Coding Agent. Turn specified swing, tolerance and confirmation rules into a Pine Script draft for inspection and testing.

Review a chart screenshot

Frequently asked questions

Educational information, not investment advice. All prices, bar numbers and thresholds are hypothetical. This page reports no backtest, live results or recognition accuracy. Pattern confirmation does not guarantee a reversal or profit.

Sources and verification

Published by Pineify. Pineify is an independent product and is not affiliated with TradingView. Sources support the technical explanations; examples do not establish trading performance.