TradingView chart patterns

Butterfly harmonic pattern: measure the extension beyond X

A Butterfly harmonic pattern is a five-point XABCD reversal candidate whose final point D extends beyond X. Its characteristic B retracement is near 0.786 of XA. A bullish candidate finishes below X; a bearish candidate finishes above it. The ratios identify a structure to examine, but neither a price touch nor a completed drawing proves that a reversal will follow.

See the decision guide

Name the Butterfly definition you are testing

Scott Carney's ideal Butterfly description centers on a 0.786 B retracement and a 1.27 XA extension, with AB=CD relationships. His Volume 3 diagram shows C retracements from 0.382 to 0.886 and BC extensions from 1.618 to 2.24. TradingView's drawing guide instead lists AD/XA extensions of 1.272 or 1.618. Those are distinct conventions, not one continuous acceptance range.

  • The BF-1 worksheet below selects the 1.27 XA branch and an alternate CD/AB target of 1.27. It is a custom arithmetic specification, not a complete implementation of either source or a TradingView detector.
  • A 1.618 XA candidate fails BF-1 even if another published definition accepts it. Name that alternative separately instead of widening BF-1 after seeing the result.
  • The 1.27 and 1.272 labels differ by 0.002 of XA. That difference is small but explicit; use the selected target consistently in calculations.
Keep every ratio denominator explicit

All leg lengths below are absolute price differences. For the bullish order, X is a low, A is a high, B is between X and A, C is between B and A, and D is below X. Reverse those directions for a bearish candidate. Require chronological X, A, B, C, D anchors and reject zero-length denominators before checking ratios.

  • BF-1 uses absolute ratio tolerances of 0.010 around B=0.786 and D=1.270, and 0.020 around CD/AB=1.270. These are teaching choices, not default settings or optimized values.
  • An absolute error of 0.010 means one percentage point of the denominator. It is not a 1% relative error in the target ratio. The C and BC intervals above receive no additional tolerance.
  • Use numeric prices consistently. Screen angles, diagonal lengths and switching between wick and close prices can change what the drawing appears to match.
TestPrice formulaBF-1 inclusive allowance
B retracement|A - B| / |A - X|0.776 to 0.796
C retracement|C - B| / |A - B|0.382 to 0.886
D extension|A - D| / |A - X|1.260 to 1.280
BC extension|C - D| / |C - B|1.618 to 2.240
Alternate AB=CD|C - D| / |A - B|1.250 to 1.290

Recalculate an original bullish example

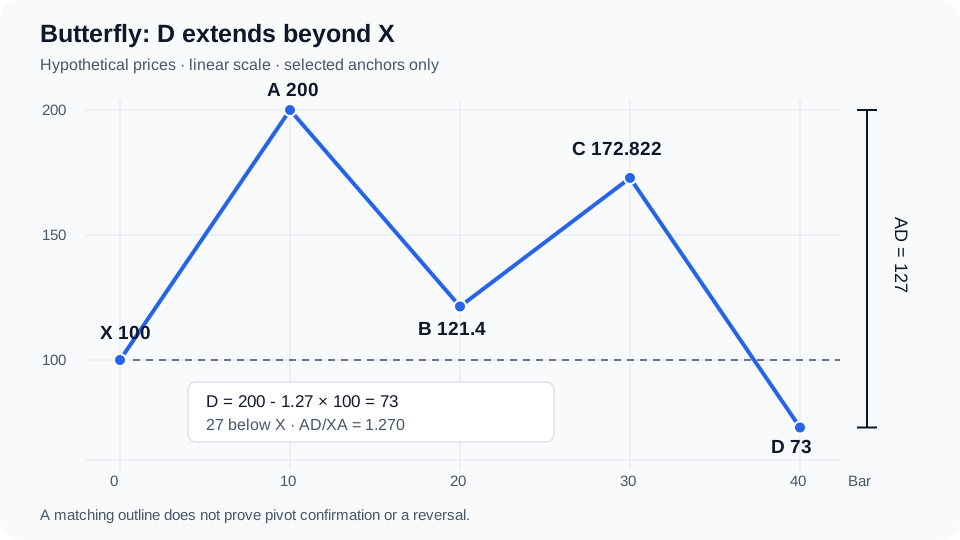
Use hypothetical points X=100 at bar 0, A=200 at bar 10, B=121.4 at bar 20, C=172.822 at bar 30 and D=73 at bar 40. The path between these anchors is unspecified, so the coordinates alone cannot prove that any point is a confirmed candle pivot. The chart illustrates the price geometry only.

Hypothetical bullish Butterfly with X at 100, A at 200, B at 121.4, C at 172.822 and D at 73 below the X baseline
Original hypothetical illustration. Prices use a linear vertical scale; bar positions are evenly spaced. No market data or forecast is shown. View original source
  • The bullish D projection is A - 1.27 × (A - X) = 200 - 127 = 73. Starting at X and subtracting 127 would produce -27, which uses the wrong anchor.
  • For a bearish Butterfly harmonic pattern, mirror each price with 300 - price: X=200, A=100, B=178.6, C=127.178, D=227. All five absolute ratios remain the same; D now lies above X.
  • Compare unrounded ratios with the acceptance bounds. The displayed six-decimal values are for reading, not a replacement for the underlying calculations.
MeasurementCalculationResult
AB/XA78.6 / 1000.786: passes
BC/AB51.422 / 78.60.654224: passes
AD/XA127 / 1001.270: passes
CD/BC99.822 / 51.4221.941231: passes
CD/AB99.822 / 78.61.270: passes

Keep failed measurements in the worksheet

Every BF-1 test must pass. A pleasing outline cannot compensate for a failed ratio, and changing one anchor can alter several measurements at once. These alterations start from the same hypothetical example.

  • Freeze the point-selection rule before studying outcomes. Record pivot strength, overlapping-candidate handling, instrument, timeframe and session settings with the ratios.
  • If you choose a different tolerance, assign a new rule version and retain the old results. No success rate can be inferred from this single constructed example.
ChangeRecalculationDecision
B becomes 125AB/XA = 75/100 = 0.750Reject: B is too shallow
D becomes 70AD/XA = 130/100 = 1.300Reject: D exceeds the selected band
D becomes 74AD/XA = 126/100 = 1.260D is on the accepted boundary; all other tests still pass
D becomes 74.01AD/XA = 125.99/100 = 1.2599Reject: just outside the D band

Compare D with Gartley without relabeling the same points

Carney's Gartley uses B near 0.618 of XA and D near a 0.786 retracement. The position of D therefore distinguishes an internal retracement from the Butterfly extension. Each pattern still needs its own remaining checks.

  • The identical price 121.4 plays different roles in this comparison: Gartley D and Butterfly B. Check the point label before interpreting a Fibonacci level.
  • These are reference prices, not two complete patterns using identical intermediate anchors. A Gartley that breaks below X does not automatically pass Butterfly rules.
Same initial XA: 100 to 200Gartley referenceButterfly BF-1 target
B target price200 - 0.618 × 100 = 138.2200 - 0.786 × 100 = 121.4
D target price200 - 0.786 × 100 = 121.4200 - 1.270 × 100 = 73
Position of bullish DAbove X=100, inside XABelow X=100, outside XA

Separate D confirmation, candidate failure and a protective stop

For a timing exercise, require a low pivot to be strictly lower than the lows of three completed bars on each side; reject ties and mirror the test for high pivots. Assume X through C already qualify. D at bar 40 becomes eligible only at the close of bar 43. A label drawn at bar 40 must disclose that later availability time.

  • For this exercise, evaluate confirmation from bar 43 through bar 52 inclusive; a close equal to 77 fails, and the candidate expires after bar 52. These timing rules are separate from the harmonic ratios.
  • Mirror the bearish filter: wait for a close below the D-candle low, and invalidate a waiting candidate if a later bar has a high above D.
  • A protective order is a separate execution rule. An illustrative bullish stop at 72 is one price unit below D=73; it is not derived from BF-1 geometry and is not a universal Butterfly stop. Gaps and slippage can produce a worse fill.
  • Do not keep moving D or widening the stop to preserve a failed signal. Entry timing, position sizing, exits and costs need separate rules before any backtest has a trade outcome to measure.
Hypothetical eventBF-1 timing exercise
Bar 40 reaches D=73Provisional endpoint; the three future bars are unknown
Bar 42 reaches 72.9Reject the proposed bar-40 D pivot
Bar 43 closes and all pivot/ratio checks passFreeze the candidate and its D-candle high, assumed to be 77
Eligible close exceeds 77, with no lower lowAn optional confirmation filter passes
Before confirmation, any completed bar has a low below 73Invalidate before evaluating a close above 77 on the same bar

Review the anchors in TradingView and Pineify

Use the TradingView XABCD drawing tool to mark the selected swings. Its Coordinates controls accept bar numbers and prices. Save the chart before later candles reveal the outcome, and keep the numeric worksheet alongside the screenshot.

  • For AI Chart Analysis, upload a readable screenshot with the symbol, timeframe, XABCD labels and price scale visible. Use the response as a second visual review; independently verify exact ratios and any suggested price levels.
  • For Pine Script AI Coding Agent, provide the named ratio convention, pivot selection, tolerance bounds, confirmation window and invalidation precedence. Ask for measured ratios, rejection reasons and separate pivot/confirmation timestamps, then inspect and test the generated draft.
  • A screenshot analysis does not guarantee precise Butterfly recognition or target prices. Syntax validation of a future script would check syntax, not detection accuracy or profitability.
Where Pineify fits

AI Chart Analysis

Upload an annotated candidate for a visual review. Keep the exact price worksheet beside the response and verify the measurements yourself.

Also useful: Pine Script AI Coding Agent. Turn a versioned Butterfly rule sheet into a Pine Script draft for inspection, syntax validation and testing.

Review an annotated chart

Frequently asked questions

Educational information, not investment advice. Prices, BF-1 tolerances and confirmation rules are hypothetical. No market test, success rate or return is claimed. Pattern completion, confirmation and AI review do not guarantee a reversal or profit.

Sources and verification

Published by Pineify. Pineify is an independent product and is not affiliated with TradingView. Sources support the technical explanations; examples do not establish trading performance.