TradingView chart patterns

Three drives pattern: ratios, timing and confirmation

The three drives pattern is a harmonic reversal candidate with three successive pushes in one direction, separated by two retracements. Its price ratios and timing must fit the chosen definition. Three lows or highs alone are insufficient, and completion of the third drive does not establish that price has reversed.

See the decision guide

Choose a definition before moving the anchors

TradingView labels the drive ends 1, 2 and 3, with retracement ends A and C. Its drawing guide describes 0.618 or 0.786 retracements and 1.272 or 1.618 extensions, with shallower retracements possible in strong trends. It calls for similar durations between the two retracements and between drives 2 and 3, and advises rejecting gapped or poorly symmetrical formations.

  • This page uses an illustrative TD-1 specification: both retracements target 0.618 and both extensions target 1.272. It excludes the other published variants so its calculations have one reproducible meaning.
  • TD-1 accepts absolute ratio error of at most 0.020. Its inclusive bands are 0.598 to 0.638 and 1.252 to 1.292. These are chosen research thresholds, not TradingView defaults or optimized settings.
  • Use one instrument, timeframe, session setting and price scale. Calculate with numerical price differences; the diagonal length of a drawn line is not a Fibonacci ratio.
Recalculate a bullish candidate

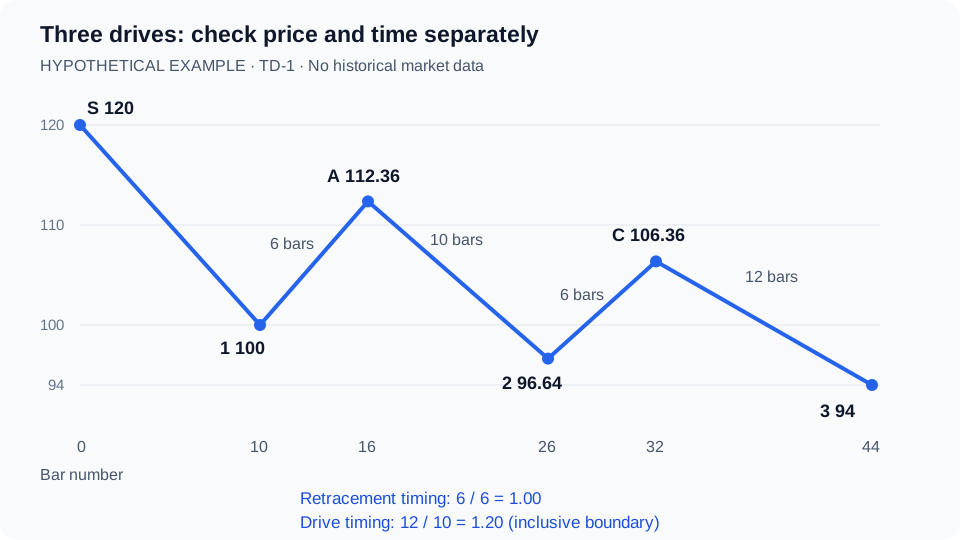
The following prices and bar positions are invented for arithmetic practice. S is the starting high of the first drive, included as a measurement reference. The ordered points are S=120 at bar 0, 1=100 at bar 10, A=112.36 at bar 16, 2=96.64 at bar 26, C=106.36 at bar 32 and 3=94 at bar 44. Treat the intervening candles as unspecified; these coordinates alone cannot prove a pivot or a gap-free path.

Hypothetical bullish three drives sequence with three falling drive lows, two retracements and corresponding bar durations
Original arithmetic illustration, not market data. Horizontal positions follow the example bar numbers; the table supplies exact ratios. View original source
  • Use absolute endpoint differences for the mirrored bearish case. Reject zero-length legs and any sequence that fails the required alternating directions or successive new extremes.
  • Do not divide the distance from low 2 to low 3 by the previous drive. The extension denominator here is the retracement from 2 to C.
  • If only point 3 changes to 92, the final extension becomes 14.36 / 9.72 = 1.4774. The three lower lows remain visible, but TD-1 rejects the ratio.
MeasurementCalculation using price differencesTD-1 result
First retracement(112.36 - 100) / (120 - 100)0.6180: passes
Drive 2 extension(112.36 - 96.64) / (112.36 - 100)1.2718: passes
Second retracement(106.36 - 96.64) / (112.36 - 96.64)0.6183: passes
Drive 3 extension(106.36 - 94) / (106.36 - 96.64)1.2716: passes

Make the time tolerance measurable

TD-1 measures time in elapsed chart bars, using endpoint bar-number differences. For each pair of corresponding legs, require max(duration 1, duration 2) / min(duration 1, duration 2) ≤ 1.20. Durations must be positive. This means the longer leg may be at most 20% longer than the shorter leg; it is not a percentage of their average.

  • Evaluate both time comparisons independently. Matching retracement durations cannot offset unequal drive durations.
  • For a six-bar reference leg, integer durations 5, 6 and 7 pass; 4 and 8 fail. This follows from the same symmetric max/min rule.
  • Bar counts across overnight closures are not elapsed clock time. Keep the session fixed, and do not carry these thresholds unchanged onto tick or range charts.
  • Do not stretch the permitted duration after seeing point 3. A different threshold is a different detector version and needs a separate record.
Pair or boundary caseDuration calculationDecision
Retracements 1→A and 2→C16 - 10 = 6; 32 - 26 = 66 / 6 = 1.00: passes
Drives A→2 and C→326 - 16 = 10; 44 - 32 = 1212 / 10 = 1.20: boundary passes
Same prices, point 3 delayed to bar 4510 bars and 13 bars13 / 10 = 1.30: fails
Same prices, point 3 advanced to bar 4010 bars and 8 bars10 / 8 = 1.25: fails

Separate a third-drive touch from confirmation

For an illustrative pivot rule, require each selected low to be strictly below the lows of the three completed bars on either side, and each high to be strictly above the corresponding highs; reject ties. A point 3 low at bar 44 is first eligible at the close of bar 47. TradingView documents how placing a pivot label on an earlier bar can conceal when that information became available.

  • For this extra confirmation example, freeze the third-pivot candle high at 96 and wait from bar 47 through bar 56 inclusive. Accept the first completed close above 96; expire after bar 56 if none qualifies. A close exactly at 96 does not pass.
  • For a bearish three drives pattern, mirror the directions: higher drive highs, confirmation below the saved third-pivot candle low, and invalidation above its high.
  • If coding this specification, retain consecutive alternating confirmed pivots, keep the more extreme pivot when two consecutive pivots have the same type, and reject a bar that qualifies as both types. Freeze a candidate at eligibility and consume it after confirmation, invalidation or expiry.
  • These confirmation and expiry choices are separate from the harmonic definition. A later reversal can still fail after a qualifying close; profitability also requires explicit entries, exits, sizing and trading costs.
Hypothetical eventTD-1 interpretation
Bar 44 touches 94, but bar 46 reaches 93.90The proposed third pivot fails. Do not retain its earlier label as a confirmed event.
Bar 47 closes with all pivot, price and time checks passingThe geometry qualifies at bar 47. A price touch at bar 44 was only a projection.
After eligibility, a completed bar has a low below 94Invalidate the saved bullish candidate before evaluating any confirmation condition on that bar.
Assume the third-pivot candle high was 96; eligible close rises above 96A separate close-based confirmation condition passes, provided no earlier invalidation occurred.

Draw and review the candidate in TradingView

Select the Three Drives Pattern drawing tool and align its anchors with the chosen swings. Use its Coordinates controls to check bar positions and prices. Keep S visible so the first retracement has a defined denominator. Save the candidate before later candles reveal its outcome.

  • Attach a worksheet containing the symbol, timeframe, session, point prices, bar numbers, ratio version and both timing comparisons. A screenshot alone is too imprecise to verify the tolerance boundaries.
  • For Pineify AI Chart Analysis, upload a readable screenshot with the symbol, timeframe and selected points marked. Use the visual review alongside the worksheet; independently check exact prices and bar counts.
  • For Pine Script AI Coding Agent, provide TD-1 or your own versioned rules, including pivot selection, tolerance inclusivity and invalidation precedence. Request measured ratios, rejection reasons and separate pivot/eligibility timestamps. Validate and replay the generated code before using its alerts.
Where Pineify fits

AI Chart Analysis

Upload your annotated chart for a visual second review. Keep the exact ratio worksheet beside the result; image analysis does not establish that every TD-1 condition passed.

Also useful: Pine Script AI Coding Agent. Turn your point-selection, ratio tolerance and confirmation rules into a Pine Script draft for inspection and testing.

Review an annotated chart

Frequently asked questions

Educational information, not investment advice. Prices, durations and TD-1 thresholds are hypothetical. No historical test, detection accuracy or return is claimed. Pattern confirmation does not guarantee a reversal or profit.

Sources and verification

Published by Pineify. Pineify is an independent product and is not affiliated with TradingView. Sources support the technical explanations; examples do not establish trading performance.