TradingView chart patterns

Bat harmonic pattern: check the shallow B and internal D

A Bat harmonic pattern is a five-point XABCD reversal candidate with a shallow B retracement and a deep D retracement that remains inside XA. Scott Carney identifies D near 0.886 of XA, with B below 0.618. A bullish candidate ends above X; a bearish candidate ends below X. Matching ratios locate a possible reversal area, but a completed shape alone does not confirm a trade.

See the decision guide

Published Bat rules need a stated convention

Carney's Bat description prefers B at 0.382 or 0.50, places D at 0.886, permits CD/BC from 1.618 to 2.618, and requires CD at least as long as AB, often 1.27 times AB. TradingView's XABCD drawing guide lists B as 0.382 or 0.500, C as 0.382 or 0.886, and CD/BC as 1.618 or 2.618. Its Bat list omits the D/XA test.

  • The word or does not define a continuous interval. Preserve the distinction when comparing a drawing, a worksheet and an indicator.
  • BAT-1 below is an illustrative specification with its own continuous C interval and explicit tolerances. It is not a reproduction of a TradingView detector or a complete statement of either source.
  • Reject zero-length legs and require anchors in time order before testing ratios. For a bullish candidate, require X < D < B < C < A; reverse the price inequalities for a bearish candidate.
Use the BAT-1 worksheet without changing its bounds

All differences in this worksheet use absolute prices. BAT-1 selects a narrow B band around 0.50 and an extended CD leg around 1.27 AB. Every row must pass. The C interval is an explicit teaching choice between the two endpoints in the drawing guide, not a claim that its text specifies a range.

  • The B and D allowances are absolute ratio errors of 0.010, not 1% relative errors. The CD/AB allowance is 0.020 around 1.270. These settings are not optimized parameters.
  • Use the same wick or close convention throughout. Measure numeric prices rather than the diagonal length of a line on the screen.
MeasurementFormulaBAT-1 inclusive bounds
B retracement|A - B| / |A - X|0.490 to 0.510
C retracement|C - B| / |A - B|0.382 to 0.886
D retracement|A - D| / |A - X|0.876 to 0.896
BC projection|C - D| / |C - B|1.618 to 2.618
Extended CD leg|C - D| / |A - B|1.250 to 1.290

Recalculate a bullish Bat harmonic pattern

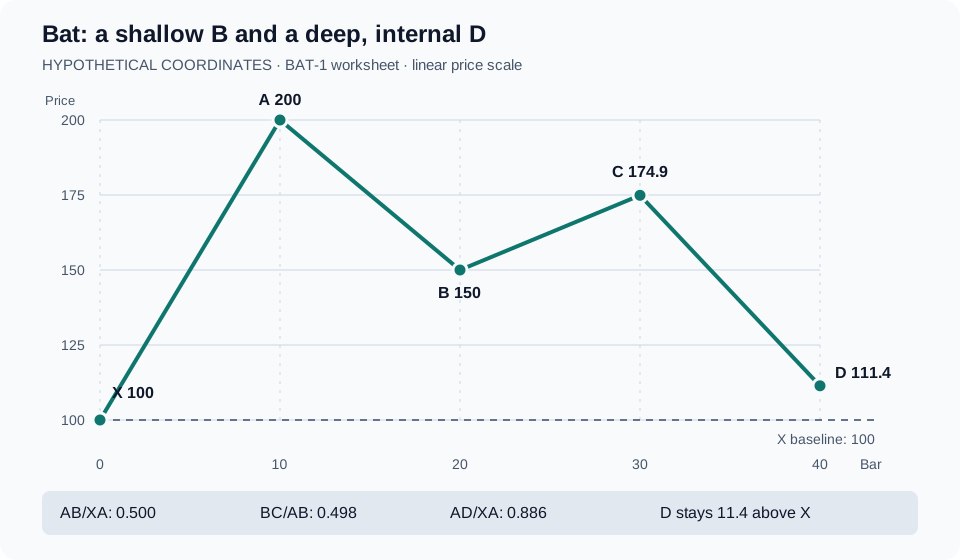
Assume X=100 at bar 0, A=200 at bar 10, B=150 at bar 20, C=174.9 at bar 30 and D=111.4 at bar 40. These are constructed coordinates, not market data. They give XA=100, AB=50, BC=24.9, CD=63.5 and AD=88.6. The intervening candles are unspecified, so the drawing proves geometry only.

Hypothetical Bat coordinates X 100, A 200, B 150, C 174.9 and D 111.4 on a linear price axis, with D above X
Original hypothetical worksheet. D remains 11.4 price units above X; no future reversal is drawn. View original source
  • The D projection starts at A: 200 - 0.886 × 100 = 111.4. Measuring 88.6 upward from X would give 188.6, which is a different level.
  • A strict endpoint variant with tolerance 0.010 around C=0.382 or 0.886 rejects C=0.498. A tolerance of 0.010 around CD/BC=1.618 or 2.618 also rejects 2.550201. Passing BAT-1 does not imply passing that variant.
  • For a bearish Bat harmonic pattern, mirror every price using 300 - price: X=200, A=100, B=150, C=125.1, D=188.6. The absolute ratios stay unchanged and D is below X.
  • Retain full precision for acceptance decisions. Six-decimal display values are rounded for reading.
CheckCalculationBAT-1 result
B50 / 100 = 0.500Pass
C24.9 / 50 = 0.498Pass
D88.6 / 100 = 0.886Pass
BC projection63.5 / 24.9 = 2.550201Pass
CD versus AB63.5 / 50 = 1.270Pass

Reject failed geometry before asking for confirmation

Change one point in the original example while keeping the others fixed. A single failed check rejects that BAT-1 candidate; passing the D test cannot rescue a failed B or C. Each changed coordinate requires recalculating all affected ratios.

  • The D-only price band is 110.4 to 112.4 for this XA. Being inside that band is necessary for BAT-1 but not sufficient for all five tests.
  • A move through X fails this internal retracement specification. Do not preserve the old candidate by renaming it after seeing the move; another pattern requires its own anchor and ratio checks.
Hypothetical changeDecisive calculationDecision
B=138.2AB/XA = 61.8/100 = 0.618Fails the selected shallow-B band
C=195BC/AB = 45/50 = 0.900Fails the C interval
D=109AD/XA = 91/100 = 0.910Fails the D band, although still above X
D=100AD/XA = 100/100 = 1.000Fails the D band and strict internal ordering

Compare Bat, Gartley and Butterfly at the same XA

Using X=100 and A=200 isolates the difference in reference levels. Carney's Gartley uses B=0.618 and D=0.786; his ideal Butterfly centers on B=0.786 and D=1.27. TradingView also lists Butterfly D alternatives of 1.272 or 1.618. The table uses the 1.27 branch solely for comparison.

  • These rows are reference levels, not complete patterns sharing the same C. A shallower B and a deeper internal D distinguish this Bat example from the Gartley row.
  • For the bearish mirror, internal D levels lie below X and the Butterfly extension lies above X.
ReferenceB priceD priceD location
Bat BAT-1 center150111.4Inside XA, above X
Gartley reference138.2121.4Inside XA, above X
Ideal Butterfly reference121.473Outside XA, below X

Confirm the D pivot before evaluating a price trigger

For this timing exercise, require a low pivot to be strictly below the lows of two completed bars on each side, rejecting ties. Assume X through C have already qualified. D at bar 40 is therefore provisional until bar 42 closes. A historical label at bar 40 must retain bar 42 as its first eligible confirmation time.

  • The strict retest rejection, trigger and expiry are teaching choices separate from the harmonic definition. A close equal to 115 does not pass. Keep the original D fixed while evaluating this waiting candidate.
  • For the bearish mirror, require a high pivot, then a close below its candle low; invalidate if price retests or exceeds D before triggering.
  • A trade stop is a separate execution decision. Pattern failure does not specify position size, an order fill or a maximum realized loss. Define entry timing, exits, costs and slippage before testing a trading strategy.
EventBAT-1 timing exercise
Bar 40 low reaches 111.4Projected D touched; no confirmed pivot yet
Bar 41 or 42 low is 111.4 or lowerReject the proposed bar-40 pivot
Bar 42 closes with both right-side lows above 111.4Accept the pivot if left-side and ratio tests also pass
Bars 43 to 47 close above 115Optional price trigger, assuming the D-candle high was 115
Any bar after D reaches 111.4 or lower before the triggerInvalidate first, even if that bar closes above 115
No trigger by the close of bar 47Expire the candidate

Review the measured candidate in TradingView and Pineify

Place the five points with the TradingView XABCD drawing tool and enter their bar and price coordinates. Save the symbol, timeframe, swing-selection rule and worksheet with the chart. A manual drawing can display your chosen anchors without proving that an objective detector would select them.

  • Upload an annotated screenshot to AI Chart Analysis with the symbol, timeframe and price scale visible. Use the response to review the candidate structure, and verify every exact ratio from the price worksheet.
  • Give Pine Script AI Coding Agent the named ratio convention, pivot rule, tolerance bounds, invalidation precedence and confirmation window. Request measured ratios and separate pivot/confirmation timestamps in the draft.
  • Review and syntax-check any generated script before replaying it on historical bars. Screenshot review and successful compilation do not establish recognition accuracy or profitable trading rules.
Where Pineify fits

AI Chart Analysis

Upload an annotated Bat candidate for a visual review, then compare the response with your numeric worksheet.

Also useful: Pine Script AI Coding Agent. Turn your chosen ratios and confirmation rules into a Pine Script draft for inspection and testing.

Review an annotated chart

Frequently asked questions

Educational information, not investment advice. All prices, BAT-1 bounds and confirmation events are hypothetical. No backtest or recognition accuracy is claimed. A matching structure, confirmed pivot or AI review does not guarantee a reversal or profit.

Sources and verification

Published by Pineify. Pineify is an independent product and is not affiliated with TradingView. Sources support the technical explanations; examples do not establish trading performance.