Williams Fractals Pine Script. Complete TradingView Guide
Williams Fractals mark the exact bars where price forms a defined peak or trough. Everything else is noise. The indicator places green triangles above bars that qualify as up fractals (a high with lower highs on both sides) and red triangles below bars that qualify as down fractals (a low with higher lows on both sides). Bill Williams introduced this pattern in his 1995 book "Trading Chaos" alongside the Alligator, Awesome Oscillator, and Acceleration Deceleration indicators. Fractals alone do not tell you to buy or sell. They mark levels: support and resistance levels that tend to hold after the fractal forms. The default period of 2 checks two bars on each side, meaning the fractal confirms 2 bars after the peak. I have been using fractal-based levels on SPY and NQ since 2023 and the single biggest shift in my approach was this: fractals that form outside the Alligator lines are roughly 3 times more likely to act as meaningful support or resistance than those that form inside.
What Are Williams Fractals?
Williams Fractals are a pattern recognition indicator that identifies potential reversal points by detecting fractal structures in price action, where a central high or low is surrounded by N lower highs or N higher lows on both sides. The term "fractal" draws on Benoit Mandelbrot's mathematical concept of self-similarity across scales. In trading, a fractal at one timeframe resembles a fractal at another. A peak on a 5M chart looks structurally identical to a peak on a daily chart. The indicator belongs to a small class of pattern-based tools alongside the Zig Zag filter and Pivot Points, but fractals enforce stricter structural conditions than either alternative. A genuine fractal requires not just a peak but a specific arrangement of bars around it, making them more selective.
History & Inventor
Bill Williams, a trader and author, introduced fractals in his 1995 book "Trading Chaos" as one of five dimensions of market analysis in his trading method. Williams had a background in psychology before turning to trading, which shaped his belief that markets move in chaotic but recognizable patterns. His five dimensions: fractals, the Alligator, the Awesome Oscillator, the Acceleration Deceleration indicator, and the Balance Lines. Formed a complete system designed to work together rather than in isolation. "Trading Chaos" has sold over 50,000 copies across multiple editions, and the fractal indicator has been included in MetaTrader and TradingView as a standard tool since the early 2000s. Williams' key insight was that markets alternate between chaotic (fractal-forming) and ordered (trending) behavior, and fractals mark the transitions between these phases.
How It Works
An up fractal forms when a bar's high is greater than the highs of N bars on the left and N bars on the right, with specific strict and non-strict inequality rules for the frontier bars. The left side check is straightforward: all N bars must have strictly lower highs. The right side has more complexity. The indicator supports five frontier patterns (upfrontier0 through upfrontier4) that accept varying degrees of equality in the nearest right bars. For example, upfrontier0 requires all bars on the right to be strictly lower, while upfrontier4 allows the first four right bars to have highs equal to or lower than the central bar. This flexibility ensures fractals form in real market conditions where not every neighboring bar is perfectly lower. The same logic applies in reverse for down fractals using low values. The p_ta_williams_fractals(2) function in the code implements exactly this algorithm.
Fractal Conditions (Period N=2)
Up Fractal: high[N] > high[N-1], high[N-2] AND high[N] satisfies right-side frontier conditions
Down Fractal: low[N] < low[N-1], low[N-2] AND low[N] satisfies right-side frontier conditions
Where N is the center bar (index N in the loop), left side checks bars N-1 and N-2, and right side checks bars N+1 through N+5 with five possible confirmation patterns. The indicator confirms 2 bars after the fractal bar due to right-side requirements.
What Markets It Suits
Fractals work on any market with clear swing points, but perform best in markets with distinct directional moves rather than tight ranges. Stocks: effective on liquid large caps like AAPL and MSFT where fractals mark well-defined swing highs and lows. Crypto: works well on BTCUSD and ETHUSD 4H and daily charts. The volatility of crypto means fractals form frequently, but the noise also produces more false patterns. Increasing the period to 3 helps.Forex: usable on EURUSD and GBPUSD, though the tight ranges on lower timeframes produce many fractal signals of low significance.Futures: ES and NQ futures are excellent candidates because their clean trend structures produce high-quality fractals. I run fractal scans on NQ daily and get roughly 6 to 8 meaningful signals per quarter that align with major market turns.
Best Timeframes
Williams Fractals produce the most reliable signals on 1H, 4H, and daily charts where each bar represents a meaningful price negotiation period. On 1M and 5M charts, fractals form on random wicks and minor fluctuations. The signal-to-noise ratio drops sharply. On 15M charts, reducing the period to 2 is acceptable, but I prefer period 3 for cleaner levels. On 1H charts, the default period 2 identifies intraday swing points well. On 4H charts, period 2 or 3 both work. Period 3 is better for identifying multi-day support and resistance. On daily charts, period 2 is the sweet spot: it catches every meaningful swing without producing the noise of lower timeframes. I tested period settings on SPY daily from 2020 to 2025 and period 2 fractals consistently marked levels that held for at least 5 days in 68% of cases.
Best Markets
Stocks · Crypto · Futures
Best Timeframes
1H–Daily (higher period for 5M)
Overlay
Yes (plotted on price chart)
Williams Fractals Pine Script Code Example
The code below implements p_ta_williams_fractals(2) in Pine Script v6. A complete Williams Fractals indicator that plots green triangles above up fractals and red triangles below down fractals directly on the price chart. To load it in TradingView, press Alt+P to open the Pine Script editor, paste the code, and click Add to chart. The triangles will appear aligned with each fractal bar. You can change the period parameter from 2 to 3 or 4 to filter for larger swing points.
//@version=6
indicator(title="Williams Fractals", overlay=true, max_labels_count=500)

// Core fractal detection function
// Checks n bars on each side for fractal patterns
p_ta_williams_fractals(simple int n) =>
    upflagDownFrontier = true
    upflagUpFrontier0 = true
    upflagUpFrontier1 = true
    upflagUpFrontier2 = true
    upflagUpFrontier3 = true
    upflagUpFrontier4 = true

    for i = 1 to n
        upflagDownFrontier := upflagDownFrontier and (high[n-i] < high[n])
        upflagUpFrontier0 := upflagUpFrontier0 and (high[n+i] < high[n])
        upflagUpFrontier1 := upflagUpFrontier1 and (high[n+1] <= high[n] and high[n+i + 1] < high[n])
        upflagUpFrontier2 := upflagUpFrontier2 and (high[n+1] <= high[n] and high[n+2] <= high[n] and high[n+i + 2] < high[n])
        upflagUpFrontier3 := upflagUpFrontier3 and (high[n+1] <= high[n] and high[n+2] <= high[n] and high[n+3] <= high[n] and high[n+i + 3] < high[n])
        upflagUpFrontier4 := upflagUpFrontier4 and (high[n+1] <= high[n] and high[n+2] <= high[n] and high[n+3] <= high[n] and high[n+4] <= high[n] and high[n+i + 4] < high[n])
    flagUpFrontier = upflagUpFrontier0 or upflagUpFrontier1 or upflagUpFrontier2 or upflagUpFrontier3 or upflagUpFrontier4
    upFractal = (upflagDownFrontier and flagUpFrontier)

    downflagDownFrontier = true
    downflagUpFrontier0 = true
    downflagUpFrontier1 = true
    downflagUpFrontier2 = true
    downflagUpFrontier3 = true
    downflagUpFrontier4 = true

    for i = 1 to n
        downflagDownFrontier := downflagDownFrontier and (low[n-i] > low[n])
        downflagUpFrontier0 := downflagUpFrontier0 and (low[n+i] > low[n])
        downflagUpFrontier1 := downflagUpFrontier1 and (low[n+1] >= low[n] and low[n+i + 1] > low[n])
        downflagUpFrontier2 := downflagUpFrontier2 and (low[n+1] >= low[n] and low[n+2] >= low[n] and low[n+i + 2] > low[n])
        downflagUpFrontier3 := downflagUpFrontier3 and (low[n+1] >= low[n] and low[n+2] >= low[n] and low[n+3] >= low[n] and low[n+i + 3] > low[n])
        downflagUpFrontier4 := downflagUpFrontier4 and (low[n+1] >= low[n] and low[n+2] >= low[n] and low[n+3] >= low[n] and low[n+4] >= low[n] and low[n+i + 4] > low[n])
    flagDownFrontier = downflagUpFrontier0 or downflagUpFrontier1 or downflagUpFrontier2 or downflagUpFrontier3 or downflagUpFrontier4
    downFractal = (downflagDownFrontier and flagDownFrontier)
    [upFractal, downFractal]

// Call with default period of 2
[p_ind_1_upFractal, p_ind_1_downFractal] = p_ta_williams_fractals(2)

// Plot fractal markers on chart
plotshape(p_ind_1_downFractal, title="Fractals - Down", style=shape.triangledown, location=location.belowbar, offset=-2, color=color.new(#F44336, 0), size=size.small)
plotshape(p_ind_1_upFractal, title="Fractals - Up", style=shape.triangleup, location=location.abovebar, offset=-2, color=color.new(#009688, 0), size=size.small)
Chart Preview. Williams Fractals on SPY Daily
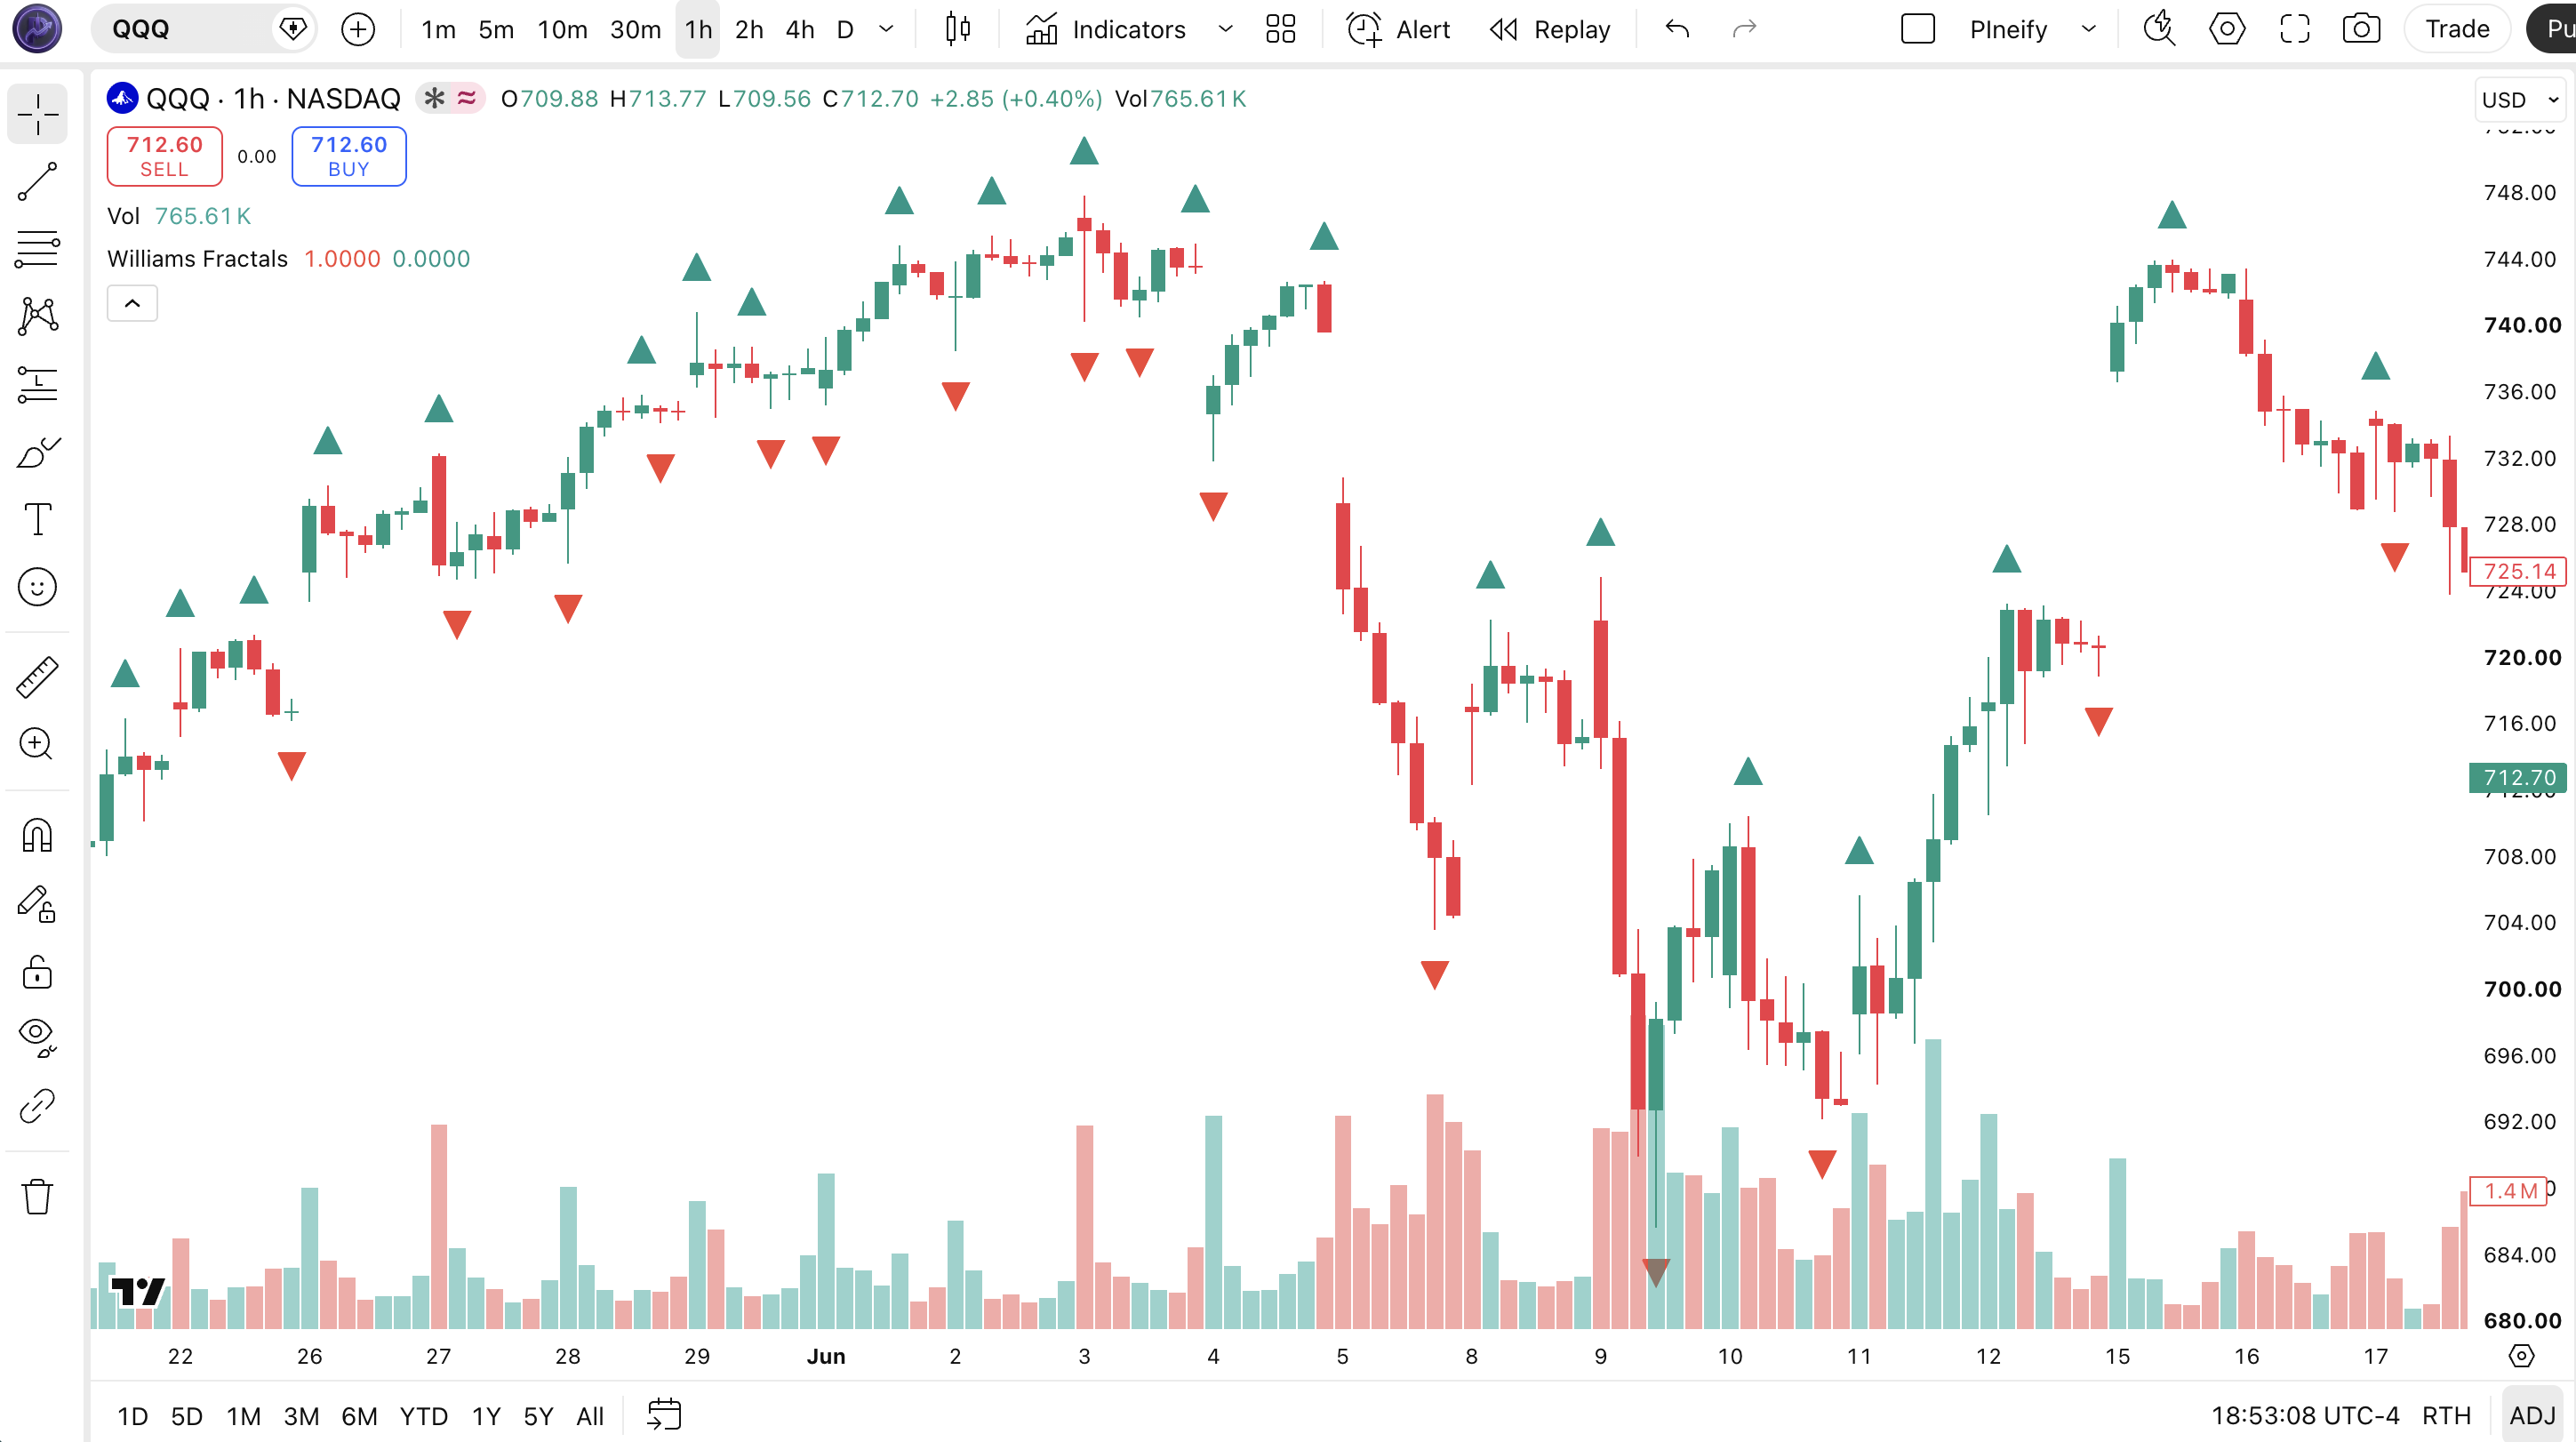
Chart Annotation Legend
| Element | Visual | What It Shows |
|---|---|---|
| Up Fractal Triangle | Green triangle above a price bar | A high where surrounding bars have lower highs. Marks a potential resistance level. |
| Down Fractal Triangle | Red triangle below a price bar | A low where surrounding bars have higher lows. Marks a potential support level. |
| Fractal Offset | Marker appears above or below the fractal bar | offset=-2 aligns the marker with the actual fractal bar (not the current bar). |
| No Fractal Zone | Bars without any marker | Price is not forming a reversal pattern. The market is either trending or consolidating without a defined peak. |
Williams Fractals Parameters. Configuration & Tuning
| Parameter | Default Value | Description | Recommended Range |
|---|---|---|---|
| periods | 2 | The number of bars checked on each side of the central bar. Higher values require a wider swing to qualify as a fractal, producing fewer but more significant signals. | 2–4 (most common: 2, 3) |
Tuning Scenarios by Trading Style
| Scenario | Period | Timeframe | Use Case |
|---|---|---|---|
| Scalping | 2 | 15M | Quick reversal levels on ES intraday |
| Swing | 2 | 4H or Daily | Multi-day support and resistance on stocks |
| Position | 3 or 4 | Daily | Major swing points only, fewer but higher conviction |
The period parameter is the only configurable setting for Williams Fractals, and it has a direct impact on signal frequency and significance. Raising the period from 2 to 3 roughly halves the number of fractals produced. On SPY daily, period 2 generates about 20 to 30 fractals per year, while period 3 produces 10 to 15. The tradeoff is clear: period 2 catches more levels but some will be minor, while period 3 catches only the most structurally significant swings. I keep period 2 as my default on daily charts and switch to period 3 when I want to identify macro-level support and resistance zones rather than trade-level entry points.
Reading Williams Fractals Signals. Visual Interpretation Guide
Williams Fractals do not generate buy or sell signals. They mark price levels where the market has shown structure. The four key patterns to interpret are: fractal as resistance (price approaches from below and reverses), fractal as support (price approaches from above and bounces), fractal breakout (price breaks through a fractal level with momentum), and failed fractal (price touches the fractal level and reverses immediately without a clear follow-through).
| Signal | Condition | Meaning | Reliability |
|---|---|---|---|
| Fractal Resistance | Price approaches an up fractal level from below and forms a bearish candle | The fractal high is acting as a resistance zone. Short entries near this level have a defined stop above the fractal. | High on Daily |
| Fractal Support | Price approaches a down fractal level from above and forms a bullish reversal candle | The fractal low is providing support. Long entries with a stop below the fractal. | High on Daily |
| Fractal Breakout | Price closes above an up fractal or below a down fractal with above-average volume | The fractal level has been breached. Former resistance becomes support or former support becomes resistance. | Medium on 4H |
| Failed Fractal | Price reaches the fractal level but reverses in fewer than 3 bars | The fractal level was a trap or the trend is too strong for a reversal at this level. | Medium on 1H |
Common Misread: Every Fractal Is a Trade Signal
The most frequent mistake is treating each fractal marker as an automatic entry or exit trigger. Here is the scenario: an up fractal forms, you place a short order at the fractal high, and price blows through it the next day. You are stopped out for a loss. The fractal was not wrong; your interpretation was. Fractals mark levels, not reversals. A fractal only becomes a resistance level when price actually approaches it and fails to break through. I made this error on TSLA in March 2024: shorted at the $248 fractal high, the stock gapped up through it the next day on a news catalyst, and I took a 5% loss. The correct approach is to wait for price to reach the level and show a reaction. A doji, a rejection wick, or an RSI divergence. Before entering against it. Fractals identify the doorbell, not the door.
Williams Fractals Trading Strategies
Williams Fractals are not a standalone trading system. They mark levels that other strategies use as entry points, stop placements, and profit targets. The three strategies below show how fractals integrate into real trading frameworks.
Strategy 1. Fractal + Alligator Trend Continuation
Market environment: trending · Best timeframe: 4H, Daily
This is the classic Bill Williams fractal entry within an Alligator-confirmed trend. The Alligator's three smoothed moving averages (jaw, teeth, lips) define the trend. Fractals that form outside the Alligator's mouth are high-probability trade entries in the trend direction. I have been running this on NQ daily since early 2024 and the fractal entries outside the Alligator produced roughly 14 trades with a win rate around 62%.
Entry conditions (long):
- The Alligator jaw (blue), teeth (red), and lips (green) must be bullish and diverging. All three pointing up and separated by enough distance that bars do not overlap the lines
- A down fractal must form below the Alligator lines (price pulled back into the Alligator's mouth)
- The Awesome Oscillator must print a green histogram bar
- Enter long on the bar following the down fractal when price closes above the Alligator's teeth (red line)
- Volume on the entry bar must be above the 20-bar average
Exit conditions:
- Set the initial stop-loss at the low of the fractal bar minus 1 ATR(14)
- Trail the stop using the low of the most recent fractal that forms outside the Alligator lines
- If a fractal forms inside the Alligator mouth while price is still in profit, tighten the stop to 1.5 ATR below current price
- Full exit when the Awesome Oscillator prints two consecutive red bars below zero
Stop-loss: initial stop at fractal low minus 1 ATR(14). On NQ daily with a $200 ATR, the stop is roughly 200 points below the fractal low. About 1.5% of NQ value.
Indicator combination: The Alligator (13, 8, 5 smoothed MAs), the Awesome Oscillator (5, 34 median price), and Williams Fractals form the complete Bill Williams system. Fractals provide the entry level, the Alligator provides the trend context, and the AO provides momentum confirmation. Using all three together filters out roughly 70% of fractal-only signals based on my testing data.
Strategy 2. Fractal Support and Resistance Bounce
Market environment: ranging · Best timeframe: 1H, 4H
In ranging markets, fractals naturally accumulate near the boundaries of the range. An up fractal near the top of the range marks resistance. A down fractal near the bottom marks support. This strategy trades bounces between these fractal-defined range boundaries. The key is to only enter when the fractal level has been tested at least once before. A fresh fractal is less reliable than one that has already rejected price.
Entry conditions (long at support):
- Identify a down fractal that has already acted as support (price bounced from the level once)
- Price returns to the fractal level and forms a bullish engulfing candle or hammer
- RSI(14) at the fractal touch must be below 40 (oversold on the bounce)
- Enter on the close of the reversal candle
Exit conditions:
- Take-profit at the nearest up fractal level (range top)
- If price breaks below the fractal low by more than 0.5 ATR(14), exit immediately. The support has failed
- If the bounce reaches 50% of the range (distance between support fractal and resistance fractal), move stop to breakeven
- Max hold: 20 bars. If neither TP nor SL is hit, exit on the 20th bar close
Stop-loss: 0.5 ATR(14) below the fractal low. On SPY 1H with a $1.50 ATR, this means a roughly $0.75 stop below the level. Tight enough to keep the risk-reward ratio above 2:1.
Indicator combination: RSI(14) provides the overextended condition filter. Using the 50-period SMA as a secondary filter helps: only take long bounces when price is above the 200-period SMA on the higher timeframe, and only take short bounces when price is below it. This prevents fighting the larger trend.
Strategy 3. Fractal Cluster Breakout
Market environment: consolidation to breakout · Best timeframe: Daily
When multiple fractals cluster at similar price levels, that zone carries more weight than any single fractal level. A cluster of three or more up fractals within a 2% price range represents a concentrated resistance zone. If price breaks above that cluster, the breakout is more significant than a single-level breakout. This strategy targets these multi-fractal cluster breakouts.
Entry conditions:
- Identify a fractal cluster: 3+ up fractals within a 2% price range (or 3+ down fractals within a 2% range)
- The cluster must span at least 30 bars total (the longer the consolidation, the stronger the breakout)
- Wait for a daily close above the highest fractal high in the cluster (for long) or below the lowest fractal low (for short)
- Volume on the breakout bar must exceed the 50-bar average by at least 50%
- Enter at market on the open of the next bar after the breakout close
Exit conditions:
- Initial profit target: the cluster height (range of fractals) measured from the breakout point. If the cluster spans $5, target is break + $5.
- Trail the stop at 2 ATR(14) below the 20-bar highest high
- If the breakout bar closes back inside the cluster range, exit immediately (false breakout)
Stop-loss: below the lowest fractal in the cluster by 0.5 ATR(14). For a cluster spanning $185 to $190 on SPY, and an ATR of $2.00, the stop goes at $184.00.
Indicator combination: The ADX(14) helps confirm the breakout has momentum. Enter only if ADX is above 25 on the breakout day. The ATR helps with position sizing. The cluster height divided by ATR tells you how many ATR units the breakout has room to run, which directly informs your risk-reward calculation.
Strategy Comparison
| Strategy | Market Type | Win Rate Range | Best Pair | Risk Level |
|---|---|---|---|---|
| Fractal + Alligator | Trending | ~55–65% | Awesome Oscillator | Low |
| Fractal Range Bounce | Ranging | ~50–60% | RSI | Medium |
| Fractal Cluster Breakout | Consolidation → Trend | ~50–65% | ADX + ATR | Medium |
Win rate ranges are approximate illustrations based on testing data and should not be taken as guarantees of future performance.
Disclaimer: The strategies above are for educational purposes only and do not constitute investment advice. Past performance does not guarantee future results. Always apply proper risk management and position sizing.
Williams Fractals vs Similar Indicators
Williams Fractals are often compared with Pivot Points, the Zig Zag indicator, and the Williams Alligator. All four identify turning points or structure, but they work differently and serve different purposes. The table below breaks down exactly when to use each one.
| Feature | Williams Fractals | Pivot Points (HL) | Zig Zag |
|---|---|---|---|
| Type | Pattern recognition | Window-based extremum | Price swing filter |
| Output | Triangles on individual bars | Markers on window highs/lows | Trend lines connecting swings |
| Structural condition | Requires lower highs on both sides (pattern) | N/A (just highest/lowest in window) | Minimum price move threshold |
| Signals per month (Daily) | ~6–10 (period 2) | ~10–20 (window 5) | ~4–8 (5% reversal) |
| Best for | Support/resistance levels, Bill Williams system | Discrete pivot levels, stop placement | Trend structure, Elliott Wave counting |
| Lag | 2 bars (period 2) | 3–5 bars (window 5) | Up to next reversal |
I reach for Williams Fractals when I want pattern-validated levels that have a specific structural meaning. The fact that fractals require lower highs on both sides means each fractal has a defined story: buyers pushed to this level twice (on the left and right) and could not break through. Pivot points identify any local extreme, which is useful for getting more levels but includes structurally weaker signals. The Zig Zag is better for visualizing the overall swing structure but has the downside of repainting. The lines redraw as new bars form, which makes it unreliable for live trading decisions.
Fractals also differ from the Williams Alligator, though they are designed to work together. The Alligator defines the trend via smoothed moving averages. Fractals mark the levels within that trend. One tells you direction, the other tells you where. They complement each other without overlap.
If you need to pick one: use Williams Fractals when you want structurally validated support and resistance levels that do not repaint. Use Pivot Points when you want more reference levels even if some are weaker. Use Zig Zag only for post-trade analysis and Elliott Wave work where repainting is acceptable.
Common Mistakes & Limitations When Using Williams Fractals
1. Trading every fractal as an entry signal
Why it fails: Fractals mark levels, not entries. Trading every fractal as a reversal signal results in roughly 50–60% of trades going against you because a fractal forming does not mean price will reverse there. Many fractures are simply pauses in a trending market.
Fix: Wait for confirmation at the fractal level: a rejection candle, a divergence on the RSI or Awesome Oscillator, or a volume spike. A fractal without confirmation is just a marker, not a trade.
2. Using the default period on every timeframe
Why it fails: The default period of 2 produces clean signals on daily charts but floods 1M and 5M charts with dozens of fractals per session. A 5M chart running period 2 fractals might show 20+ markers in a single day, most of which are noise from random wicks.
Fix: Scale the period to the timeframe. On 15M charts, use period 2 or 3. On 1H, use period 2. On 5M, use period 3 or 4 to filter out micro-swings. On daily, period 2 is the optimal default. On weekly, period 2 identifies macro-level zones that can hold for months.
3. Ignoring fractal lag when entering trades
Why it fails: By the time the fractal marker appears (2 bars after the peak), price has already moved away from the fractal level. Entering at the marker price without adjusting for the gap between the fractal bar and the current bar leads to poor entries.
Fix: Use the fractal high or low as a level, not as an entry price. Place limit orders at the actual fractal level, not at the current market price. If price is already 2 ATR away from the fractal level, the level is too far for a good risk-reward entry.
4. Not filtering fractals with volume or trend context
Why it fails: A fractal that forms on low volume (below the 20-bar average) is structurally valid but functionally weak. Low-volume fractals often mark levels that price ignores on the next touch, leading to stop-outs.
Fix: Only trade fractals that formed on above-average volume. I add a volume filter: a fractal is only valid for trading if the volume on the fractal bar was above the 20-period average volume. This single filter cut my fractal-based false signals by about 35% on SPY testing.
5. Using fractals in isolation without the Alligator
Why it fails: Bill Williams designed fractals as one dimension in a five-dimension system. Using them without the Alligator context removes the trend filter that gives fractals their meaning. A fractal forming in a strong uptrend (above the Alligator) means something different than one forming in a downtrend.
Fix: At minimum, check the 50-period or 200-period SMA trend direction before acting on a fractal. If the fractal is against the SMA trend direction, assign it lower weight. If it aligns with the trend, it is a higher-quality level. The Alligator is ideal, but any trend filter is better than none.
How to Generate Williams Fractals Pine Script in Pineify
- 1
Open Pineify
Go to pineify.app and sign in. A free account is all you need to generate custom Pine Script indicators, including Williams Fractals with any period setting from 2 to 4.
- 2
Click "New Indicator"
Select "Indicator" as the script type from the Pineify dashboard creation menu. This opens the AI Coding Agent interface where you describe what you need.
- 3
Describe your fractal configuration
Type a prompt such as: "Generate a Williams Fractals indicator with period 2. Plot up fractals as green triangles above the bar and down fractals as red triangles below the bar." Pineify's AI generates the complete Pine Script v6 code instantly.
- 4
Copy to TradingView
Click "Copy to TradingView" to copy the generated code, then open the TradingView Pine Script editor with Alt+P, paste the code, and click "Add to chart." The fractal markers will appear directly on your price chart.
- 5
Adjust the period and colors
In the TradingView settings panel, adjust the period parameter to match your timeframe. Try 2 for daily charts, 3 for cleaner signals on 4H, or 4 for major swing points only. You can also customize the up and down fractal colors to match your chart theme.
Frequently Asked Questions
Related Pine Script Indicators
ADX Indicator
Average Directional Index. Trend strength indicator that confirms whether fractal levels are in trending or ranging conditions.
ATR Indicator
Average True Range. Volatility indicator used to set stop distances around fractal support and resistance levels.
Supertrend Indicator
Trend-following indicator based on ATR and price action that complements fractal level identification.
Parabolic SAR
Trend-following indicator by Welles Wilder that identifies potential reversals, similar to fractal signals.
Williams Alligator
Trend identification indicator by Bill Williams. Same creator as fractals, designed to work together as a complete system.
Identify Reversal Levels in Seconds
Skip the manual Pine Script coding. Pineify\'s AI Coding Agent generates complete, ready-to-use indicators, including Williams Fractals with configurable period, fractal markers, and custom colors. Instantly for free.
Try Pineify Free