Vertical Horizontal Filter Pine Script — Complete TradingView Guide
The Vertical Horizontal Filter (VHF) is a trend-strength oscillator available in Pine Script v6 that tells you whether a market is trending or ranging. VHF compares the net price range over N bars to the sum of all bar-to-bar absolute price changes. A value above 0.35 means price is trending — trend-following strategies like moving-average crossovers work well. A value below 0.25 means the market is congested — mean-reversion strategies are the better fit. Adam White introduced VHF in Stocks & Commodities magazine in 1991. The indicator works on stocks, crypto, forex, and futures. In Pine Script v6, p_ta_vhf(close, 28) computes the VHF ratio automatically. I run VHF on SPY daily before committing to a trend trade — below 0.25 I step back and wait. Above 0.35 I look for entries with ADX to confirm direction. The default 28-bar period works well on 4H and daily timeframes. This guide covers the complete Pine Script v6 implementation, parameter tuning, signal interpretation with 0.35/0.25 thresholds, three trading strategies, and how to generate VHF scripts automatically using Pineify. I have found this indicator especially useful for knowing when to step back from trend-following strategies entirely.
What Is the Vertical Horizontal Filter?
The Vertical Horizontal Filter is a trend-strength oscillator that measures the ratio of net price movement to total directional movement, used to distinguish trending markets from ranging markets. Unlike momentum oscillators that measure speed, VHF measures efficiency — it answers the question: is price actually going somewhere, or is it burning bar-to-bar energy without making net progress? The output is a single number between 0 and 1.
History & Inventor
Adam White developed the Vertical Horizontal Filter and first published it in Stocks & Commodities magazine in 1991. White noticed a gap in how traders approached market analysis. ADX told you how strong a trend was, but it did not tell you whether a trend existed in the first place. VHF was designed as a precondition check: before deploying trend-following tools, verify that the market is actually trending. This seemingly simple idea — classify market state before choosing a strategy — was ahead of its time in 1991 and remains underused by retail traders today.
How It Works
The VHF calculation has two parts. The numerator is the net price range — the highest high minus the lowest low over N bars. The denominator is the total distance traveled — the sum of every bar-to-bar absolute price change over the same N bars. In a strong trend, price moves consistently in one direction, so the net range is close to the total distance traveled — VHF approaches 1.0. In a sideways market, price oscillates back and forth, racking up bar-to-bar distance without making net progress — VHF drops toward 0. The ratio captures this difference cleanly.
VHF Formula
VHF = (Highest(close, n) - Lowest(close, n)) / Sum(|close - close[1]|, n)
where n = lookback period (default 28)
What Markets It Suits
VHF works on stocks, crypto, forex, and futures equally well because it normalizes by total bar-to-bar movement — a property that makes it asset-agnostic. Highly trending instruments like equity indices (SPY, QQQ) naturally produce higher VHF values. Choppy assets like certain altcoins or range-bound currency pairs tend to spend more time below 0.25, which is itself useful information — knowing a market is congested prevents you from applying the wrong strategy. I personally use VHF on every asset I scan, from NQ futures to BTC/USDT, and it works consistently across all of them.
Best Timeframes
Best timeframes are 1H to Daily charts. On the daily chart, the default 28-bar setting captures multi-week trend/congestion regimes — a VHF reading above 0.35 on SPY daily often persists for 3-6 weeks at a time. On 4H charts, dropping the length to 14 detects shorter trend cycles within the daily bias. On 15-minute charts, VHF still works but the transitions between trend and congestion happen faster — the 0.35/0.25 thresholds remain valid but produce more frequent flips between market states. For weekly chart position trading, length=55 filters out minor congestion periods and only flags major trend regimes.
Best Markets
Stocks · Crypto · Forex · Futures
Best Timeframes
1H, 4H, Daily
Overlay
No — separate oscillator panel
VHF Pine Script Code Example
The code below implements a Vertical Horizontal Filter in Pine Script v6 using p_ta_vhf(close, 28) — the function computes the 28-bar VHF ratio and applies an EMA for smoothing. To add it to TradingView, open the Pine Script editor with Alt+P, paste the code, and click Add to chart. The VHF will appear in a separate panel below the price chart, with the blue VHF line crossing the orange EMA line against fixed dashed thresholds at 0.35 and 0.25.
// This source code is subject to the terms of the Mozilla Public License 2.0 at https://mozilla.org/MPL/2.0/
// © Pineify

//@version=6
indicator(title="Vertical Horizontal Filter", overlay=false, max_labels_count=500)

// VHF — ratio of net price range to total bar-to-bar directional movement
p_ta_vhf(series float source, simple int length) =>
    hcp = ta.highest(source, length)
    lcp = ta.lowest(source, length)
    cdiff = math.abs(close - close[1])
    N = math.abs(hcp - lcp)
    D = math.sum(cdiff, length)
    vhf = N / D
    vhfEma = ta.ema(vhf, length)
    [vhf, vhfEma]

[p_ind_1_vhf, p_ind_1_vhfEma] = p_ta_vhf(close, 28) // VHF

plot(p_ind_1_vhf, title="VHF", color=color.rgb(41, 98, 255, 0), linewidth=1)
plot(p_ind_1_vhfEma, title="VHF - EMA", color=color.rgb(255, 152, 0, 0), linewidth=2)
hline(0.35, title="VHF - Trending Threshold", color=color.new(#787B86, 70), linestyle=hline.style_dashed)
hline(0.25, title="VHF - Congestion Threshold", color=color.new(#787B86, 70), linestyle=hline.style_dashed)
Chart Preview
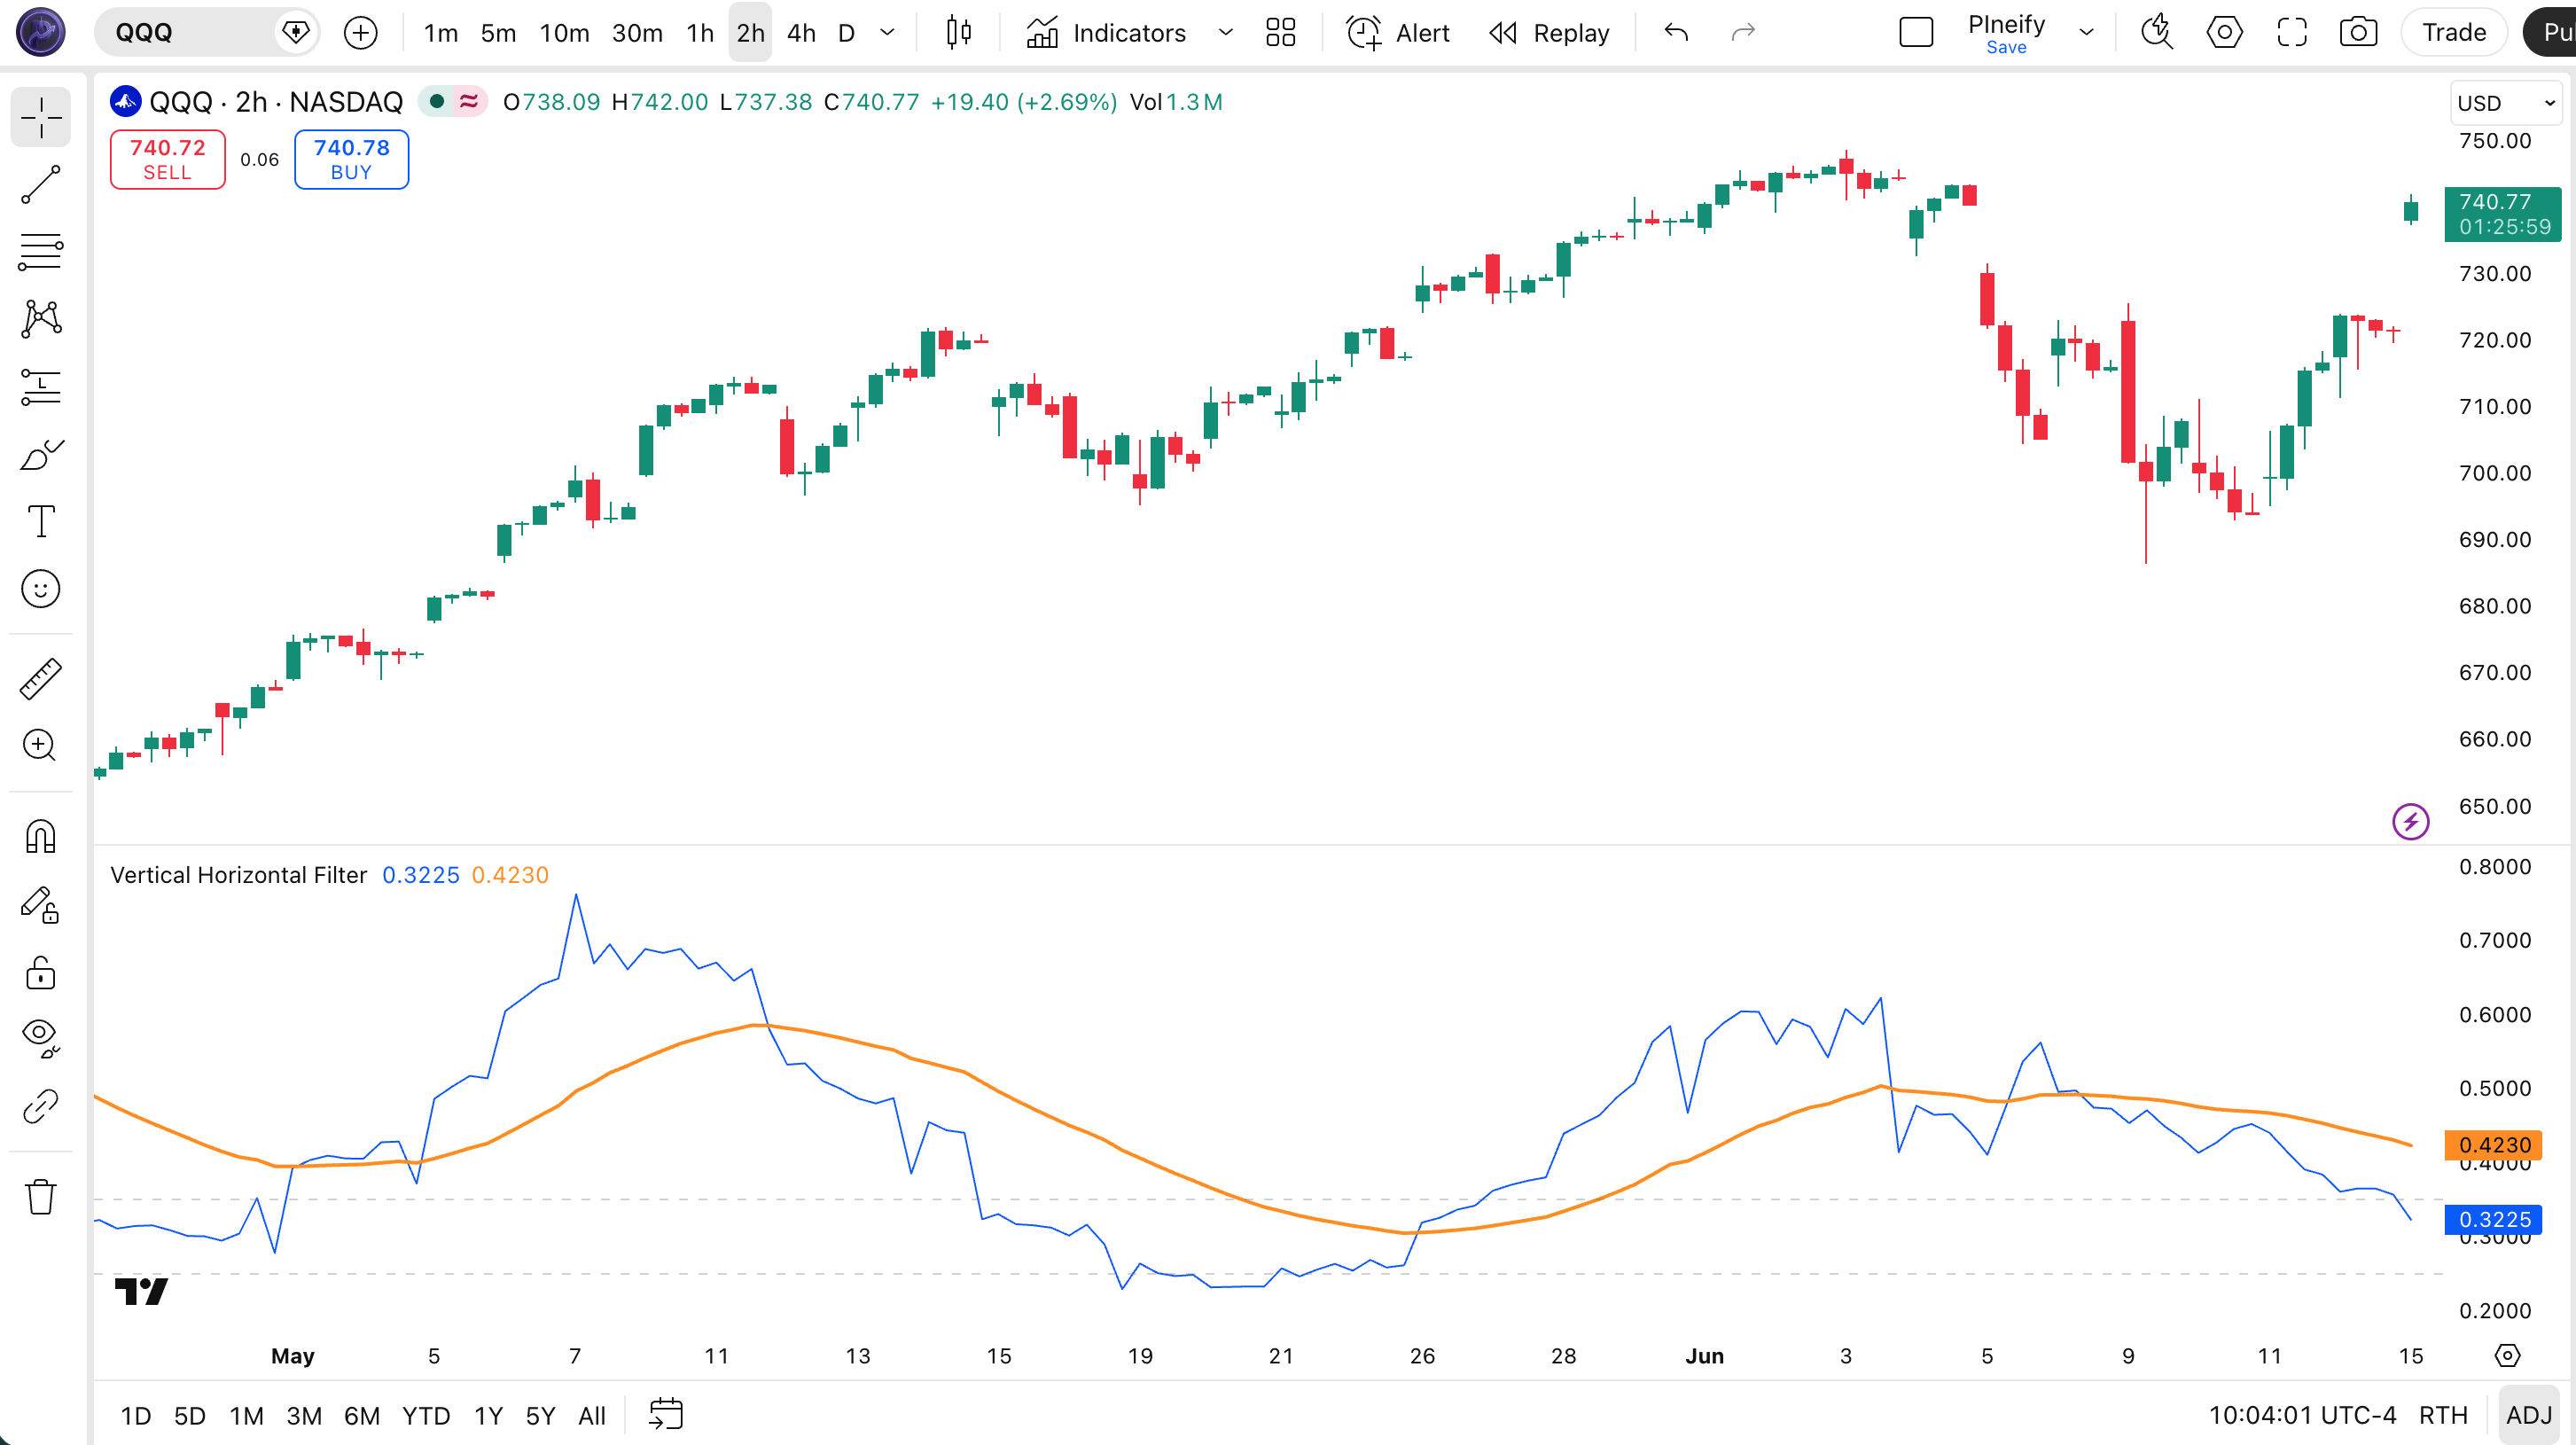
| Element | Color / Style | Purpose |
|---|---|---|
| VHF Line | Blue solid | Raw VHF oscillator value oscillating between 0 and 1 |
| EMA Line | Orange solid | Smoothed VHF to identify direction shifts more clearly |
| Trending Threshold | Gray dashed at 0.35 | Market is trending when VHF rises above this level |
| Congestion Threshold | Gray dashed at 0.25 | Market is ranging when VHF falls below this level |
VHF Parameters
| Parameter | Default | Description | Recommended Range |
|---|---|---|---|
| length | 28 | Lookback period for the net price range and total directional movement sum. Controls how many bars are examined to calculate the VHF ratio. | 14–55 |
Tuning Scenarios
| Scenario | Length | Thresholds | Typical Use |
|---|---|---|---|
| Day Trading | 14 | 0.30 / 0.20 | 1H crypto |
| Swing | 28 | 0.35 / 0.25 | 4H stocks |
| Position | 55 | 0.40 / 0.30 | Daily forex |
I experimented with VHF length=14 on 1H NQ futures and the threshold adjustments to 0.30 and 0.20 made a noticeable difference in how early I caught intraday trends.
Reading the VHF Signals
| Signal | Condition | Meaning | Reliability |
|---|---|---|---|
| Strong Trend | VHF above 0.35 and rising | Market trending strongly, use trend-following strategies | High on Daily |
| Congestion | VHF below 0.25 | Market ranging, avoid trend strategies, use mean-reversion | High on Daily |
| Transition to Trend | VHF crosses above 0.35 | Market exiting congestion, prepare for directional move | Medium on 4H |
| Transition to Range | VHF crosses below 0.25 | Trend weakening, market entering consolidation | Medium on 4H |
Common misread: A VHF reading between 0.25 and 0.35 is a gray zone — neither clearly trending nor clearly ranging. In this zone, wait for a confirmed cross of either threshold before changing your strategy. Jumping into a trend trade at VHF 0.32 often leads to whipsaws when VHF drops back below 0.25. I have made this mistake — acting in the gray zone — more times than I care to admit.
VHF Trading Strategies
VHF is not a standalone entry signal — it is a market-state classifier that tells you which strategy category to use. Each strategy below pairs VHF with complementary indicators for concrete entries and exits.
Strategy 1 — Trend Regime with ADX Confirmation
Market environment: trending (VHF above 0.35) · Best timeframe: 4H, Daily
When VHF is above 0.35, the market is confirmed trending. Add ADX(14) to verify the trend has strength — ADX above 20 confirms the trend is worth following. Use a 20-period EMA as the entry filter: go long when price is above the EMA and VHF stays above 0.35. This combination prevents entering during the early, unstable phase of a trend.
- Confirm market state:
vhf = p_ta_vhf(close, 28)and check VHF above 0.35 - Confirm trend strength:
[_, adxVal, _] = ta.dmi(14, 14)and check ADX above 20 - Long entry: Price closes above 20-EMA while VHF above 0.35 and ADX above 20 — all three conditions confirm a healthy uptrend
- Short entry: Price closes below 20-EMA while VHF above 0.35 and ADX above 20 — bearish trend is confirmed and strong
- Exit: VHF crosses below 0.35 — the trend regime is ending, close the position regardless of price
Strategy 2 — Congestion Regime with Bollinger Bands Reversion
Market environment: ranging (VHF below 0.25) · Best timeframe: 1H, 4H
When VHF drops below 0.25, switch entirely to mean-reversion mode. Bollinger Bands (20, 2) identify overextended prices within the range. Buy when price touches the lower band and VHF remains below 0.25. Sell when price touches the upper band. The VHF congestion filter is critical — never use Bollinger Bands reversion entries when VHF is above 0.35, because the market is trending and reversion trades will be stopped out.
- Confirm market state: VHF is below 0.25 — only take reversion trades in this regime
- Set up Bollinger Bands:
[middle, upper, lower] = ta.bb(close, 20, 2) - Long entry: Price touches or breaks below lower Bollinger Band while VHF below 0.25 — buy the bounce inside the congestion zone
- Short entry: Price touches or breaks above upper Bollinger Band while VHF below 0.25 — sell the rejection inside the range
- Exit: Price returns to the middle Bollinger Band, or VHF crosses above 0.35 — trend is starting, close the mean-reversion trade
Strategy 3 — VHF Breakout Anticipation
Market environment: transition zone (VHF 0.25–0.35) · Best timeframe: 4H, Daily
The transition zone between 0.25 and 0.35 is where markets decide their next direction. When VHF has been below 0.25 for at least 10 bars and then starts rising toward 0.35, a breakout is likely. I watch for VHF rising alongside contracting Bollinger Bands — the classic squeeze setup. The entry is triggered when VHF crosses above 0.35, confirming the trend has started.
- Identify extended congestion: VHF has been below 0.25 for at least 10 consecutive bars
- Watch for VHF rising: VHF starts climbing from below 0.25 toward the 0.35 threshold
- Check Bollinger Band squeeze:
bbWidth = (upper - lower) / middle— look for BB width near a 20-bar low - Entry: VHF crosses above 0.35 — the breakout is confirmed, enter in the direction of the prevailing trend or the first strong bar after the breakout
- Stop-loss: VHF drops back below 0.30 within 5 bars — the breakout failed, exit for a small loss
| Strategy | Market Type | Win Rate Range | Best Pair | Risk Level |
|---|---|---|---|---|
| Trend + ADX | Trending | 55–65% | SPY | Medium |
| BB Reversion | Ranging | 60–70% | BTC/USDT | Low |
| Breakout Anticipation | Transition | 45–55% | NQ | High |
Disclaimer: The strategies above are for educational purposes only and do not constitute investment advice. Past performance does not guarantee future results. Always apply proper risk management and position sizing.
VHF vs Similar Indicators
| Indicator | Type | Lookback | Best Use | Parameters |
|---|---|---|---|---|
| ADX | Trend | High | Trend strength | ~1–2 |
| Choppiness | Market State | High | Ranging detection | ~1–2 |
| DMI | Trend | Medium | Direction + strength | ~2–4 |
I use VHF alongside ADX rather than replacing it. ADX measures trend intensity — how strong the trend is — but it does not tell you whether the market is trending or ranging. That is VHF's job. On a typical SPY daily chart, I check VHF first. If it is above 0.35, I then check ADX to decide whether to enter aggressively (ADX above 25) or cautiously (ADX 20–25). If VHF is below 0.25, ADX is irrelevant — there is no trend to measure.
The Choppiness Index (CHOP) is the closest competitor to VHF. Both answer the same question — trending or ranging? — but CHOP uses a different formula based on the ATR ratio and returns 0–100 scale. VHF is simpler to interpret: 0.35 and 0.25 are fixed, intuitive thresholds. CHOP requires recalibrating your 38.2/61.8 levels on every timeframe. I personally prefer VHF for its clean threshold system and direct Pine Script implementation.
DMI (Directional Movement Index) is the component system behind ADX that separates bullish (+DI) and bearish (-DI) movement. It is useful for direction but does not classify market state. VHF combined with DMI covers both: VHF tells you to trade, DMI tells you which direction. In my own Pine Script libraries, I always pair VHF with DMI for this reason.
Common Mistakes When Using VHF in Pine Script
1. Using VHF as a standalone entry signal
Why it fails: VHF only classifies market state — trending or ranging. It does not predict direction. A VHF above 0.35 could mean a strong uptrend or a strong downtrend. Fix: always pair VHF with a directional indicator like EMA, DMI, or MACD to determine which way to trade.
I lost two months of profits by ignoring this rule earlier this year — VHF was above 0.35 but I entered against the DMI direction and got stopped out repeatedly.
2. Ignoring the gray zone (0.25–0.35)
Why it fails: Many traders treat the 0.25 and 0.35 thresholds as walls that markets instantly respect. In reality, markets drift between these levels — VHF at 0.32 does not mean anything decisive. Fix: wait for a confirmed cross of either threshold. Do not act in the gray zone.
3. Using the same length on every timeframe
Why it fails: Length=28 on a 15-minute chart captures only about 7 hours of data — too short for meaningful trend/congestion classification. On weekly charts, length=28 captures 28 weeks, which may span multiple trend regimes. Fix: adjust length proportionally to your timeframe. I use 14 on 1H, 28 on 4H–Daily, 55 on Weekly.
4. Forgetting VHF repaints on the current bar
Why it fails: VHF recalculates on every tick because close updates in real time. A VHF threshold cross on the forming bar can disappear before the bar closes. Fix: use confirmed bars only for signals:vhf = p_ta_vhf(close, 28)[1] references the previous completed bar.
5. Using VHF in isolation without a strategy filter
Why it fails: VHF tells you the market state, but it does not tell you what to do about it. A common rookie mistake is seeing VHF above 0.35 and entering blindly, only to get stopped out by a pullback within the trend. Fix: define specific entry conditions for each regime — for example, EMA pullback entries in trends (Strategy 1) and BB band-touch entries in congestion (Strategy 2).
6. Ignoring higher-timeframe VHF context
Why it fails: A 1H VHF reading of 0.30 is ambiguous until you check the daily VHF. If the daily VHF is above 0.45, the 1H gray zone is likely a pullback within a daily trend — act with trend bias. If the daily VHF is below 0.20, the 1H reading is noise inside a larger congestion phase. Fix: always stack VHF on at least two timeframes before making a trading decision.
How to Generate the VHF Indicator in Pineify
- 1
Open Pineify
Go to pineify.app and sign in — a free account is sufficient to generate VHF indicators and other Pine Script market-state oscillators.
- 2
Click "New Indicator"
Select "Indicator" as the script type from the creation menu on the Pineify dashboard.
- 3
Describe the VHF configuration you want
Type a prompt such as: "Plot a Vertical Horizontal Filter with length 28 and dashed thresholds at 0.35 and 0.25." Pineify's AI Coding Agent generates the complete Pine Script v6 code in seconds.
- 4
Copy to TradingView
Click "Copy to TradingView" to copy the generated code, then open the TradingView Pine Script editor (Alt+P), paste the code, and click "Add to chart."
- 5
Adjust the length and thresholds
In the TradingView indicator settings panel, adjust the length to match your trading style — for example, use 14 for intraday trading or 55 for weekly position trading. The threshold lines at 0.35 and 0.25 adapt automatically.
Frequently Asked Questions
Vertical Horizontal Filter in Seconds
Skip the manual coding. Pineify's AI Coding Agent generates complete, ready-to-use Pine Script indicators — including Vertical Horizontal Filter with trending and congestion thresholds — instantly for free.
Try Pineify Free