Bollinger Bands Pine Script — Complete TradingView Guide
Bollinger Bands are a volatility overlay indicator in Pine Script that plot three lines on your TradingView chart: a 20-period Simple Moving Average as the middle band, and upper and lower bands set 2 standard deviations above and below the SMA. Developed by John Bollinger in 1983, they dynamically adapt to market volatility — widening during high-volatility periods and contracting during low-volatility periods. Traders use Bollinger Bands to identify the Squeeze (a compression before a major breakout), overbought/oversold conditions, and mean-reversion setups. They work across all asset classes — stocks, crypto, forex, and futures — and on all timeframes from 1-minute intraday charts to monthly position-trading charts. This complete guide covers the full Pine Script v6 implementation, all configurable parameters, three proven trading strategies including the Bollinger Squeeze, and step-by-step instructions for generating your customized Bollinger Bands script instantly with Pineify.
What Are Bollinger Bands?
Bollinger Bands are a volatility indicator that consists of a moving average (the middle band) flanked by two bands placed a set number of standard deviations above and below it, used to measure market volatility and identify overbought or oversold conditions. Developed by American financial analyst John Bollinger in 1983 and introduced in his 1992 article in the Financial Analysts Journal, Bollinger Bands have become one of the most widely used technical indicators in the world. They are included in nearly every charting platform, including TradingView, MetaTrader, and Bloomberg Terminal.
The three components are:
- Middle Band: A 20-period Simple Moving Average (SMA) of the closing price. Formula:
basis = SMA(close, 20) - Upper Band: Middle band plus 2 standard deviations. Formula:
upper = basis + 2 × σ(close, 20) - Lower Band: Middle band minus 2 standard deviations. Formula:
lower = basis − 2 × σ(close, 20)
The key insight behind Bollinger Bands is that approximately 95% of price action falls within the two standard deviation bands when the underlying data follows a normal distribution. When price touches or breaks outside the bands, it signals a statistically rare event that often precedes a reversion to the mean — or a continuation of an unusually strong trend.
Bollinger Bandwidth (BBW) is a derived metric: BBW = (upper − lower) / basis. When BBW reaches a multi-month low, the market has entered a "Squeeze" — a contraction phase that historically precedes a high-volatility expansion. The direction of the subsequent breakout determines whether to go long or short.
Bollinger Bands are applicable across all liquid markets: equities (stocks, ETFs), cryptocurrency (BTC, ETH, altcoins), foreign exchange (EUR/USD, GBP/JPY), and futures (ES, NQ, crude oil). They perform best on timeframes from 15-minute to Daily charts. On very short timeframes (1m, 5m), statistical noise reduces the signal quality. On weekly charts, Bollinger Bands identify major support/resistance zones and long-term volatility regimes.
Best Markets
Stocks · Crypto · Forex · Futures
Best Timeframes
15m, 1H, 4H, Daily
Overlay
Yes — plots directly on price chart
Bollinger Bands Pine Script Code
The Pine Script v6 code below plots the complete Bollinger Bands overlay — middle SMA, upper band, lower band, and a semi-transparent fill — directly on the TradingView price chart. Copy the code, open the TradingView Pine Script editor (Alt+P), paste it in, and click Add to chart. You can change the 20 length and 2.0 multiplier values to suit your trading style without modifying the rest of the script.
// This source code is subject to the terms of the Mozilla Public License 2.0 at https://mozilla.org/MPL/2.0/
// © Pineify
//@version=6
indicator(title="Bollinger Bands", overlay=true, max_labels_count=500)
// Core Bollinger Bands calculation
// Basis: 20-period SMA of close
// Upper/Lower: basis ± 2 standard deviations
basis = ta.sma(close, 20)
dev = 2.0 * ta.stdev(close, 20)
upper = basis + dev
lower = basis - dev
// Bandwidth and %B derived metrics
bbw = (upper - lower) / basis // Bandwidth: measures volatility
bbr = (close - lower) / (upper - lower) // %B: position within the band
// Plot the three bands
plot(basis, "BB - Middle", color.rgb(255, 152, 0, 0), 1)
upper_plot = plot(upper, "BB - Upper", color.rgb(41, 98, 255, 0), 1)
lower_plot = plot(lower, "BB - Lower", color.rgb(41, 98, 255, 0), 1)
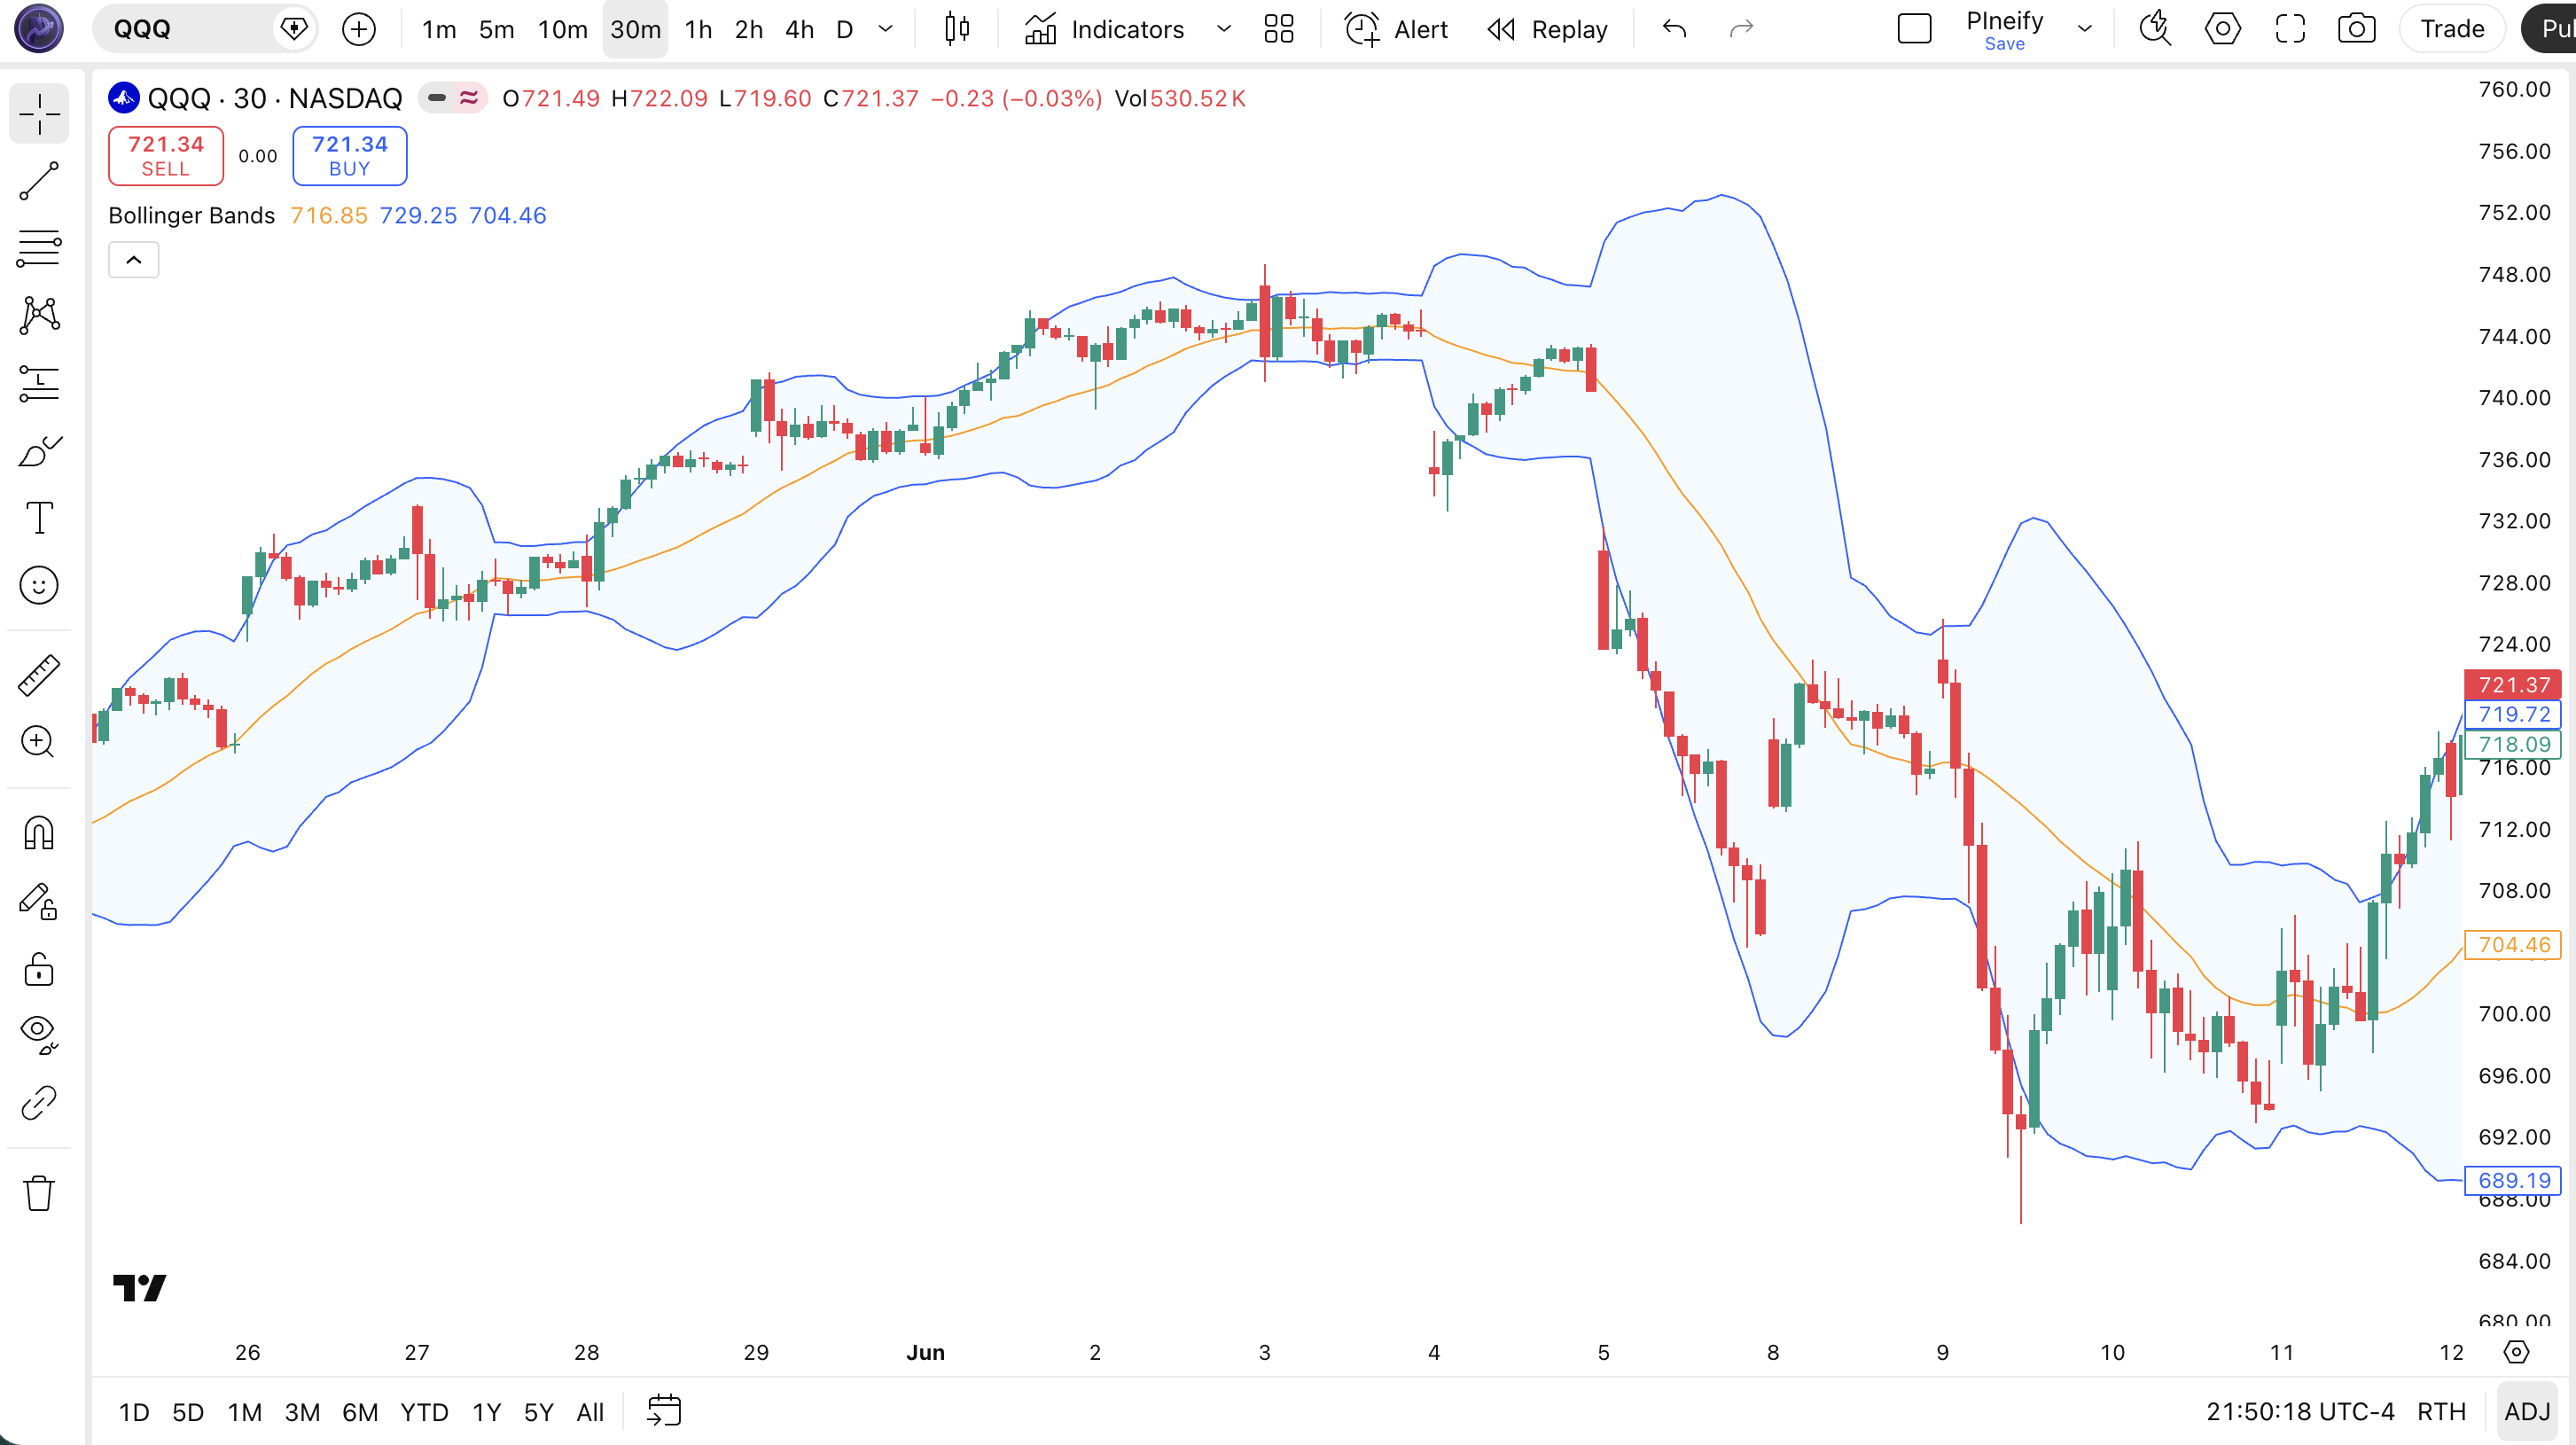
fill(upper_plot, lower_plot, title = "BB - Band", color=color.rgb(33, 150, 243, 95))Chart Preview
Bollinger Bands Parameters
| Parameter | Default Value | Description | Recommended Range |
|---|---|---|---|
| length | 20 | The number of bars used to calculate the SMA (middle band) and standard deviation. Higher values smooth out noise; lower values make the bands more reactive. | 10–50 (John Bollinger recommends 20) |
| mult | 2.0 | The standard deviation multiplier that determines the width of the upper and lower bands. A higher multiplier widens the bands, reducing the frequency of band touches. | 1.5–2.5 (2.0 is standard; 1.9 for length 10) |
| ma_type | SMA | The moving average type used for the middle band. Options include SMA (standard), EMA, RMA, HMA, WMA, VWMA, WWMA, and others. | SMA (default) or EMA for trend-following |
| source | close | The price series used for both the SMA and standard deviation calculations. Most traders use close; some use hlc3 (typical price). | close (standard) or hlc3 |
Tuning Guide by Trading Style
- Scalping (1m–5m charts): length 10, mult 1.9 — tighter bands catch intraday mean-reversion bounces
- Day trading (15m–1H charts): length 20, mult 2.0 — John Bollinger's standard settings
- Swing trading (4H–Daily charts): length 20, mult 2.0–2.5 — wider bands filter out minor fluctuations
- Position trading (Daily–Weekly charts): length 50, mult 2.1 — slow bands identify major volatility cycles
Bollinger Bands Trading Strategies
Bollinger Bands generate three categories of signals: volatility breakouts from the Squeeze, mean-reversion bounces from the bands, and trend-confirmation via the "walking the band" pattern. The following strategies use numbered conditions for precise implementation.
Strategy 1 — Bollinger Squeeze Breakout
Market environment: low-volatility consolidations before breakouts · Best timeframe: 1H, 4H, Daily
The Bollinger Squeeze (popularized by John Bollinger and later by Linda Bradford Raschke) fires when bandwidth drops to a 6-month low, signaling volatility compression before a directional expansion. Pair with ta.macd() to confirm breakout direction.
- Calculate bandwidth:
bbw = (upper - lower) / basis - Detect Squeeze:
squeeze = bbw == ta.lowest(bbw, 125) - Long entry: squeeze on prior bar AND current close > upper band AND MACD histogram > 0
- Short entry: squeeze on prior bar AND current close < lower band AND MACD histogram < 0
- Exit: close crosses back through the middle SMA band
Strategy 2 — Mean-Reversion Band Bounce
Market environment: ranging / sideways markets · Best timeframe: 15m, 1H
In non-trending markets, price oscillates between the upper and lower bands with the SMA as a gravitational center. Combine with RSI(14) to avoid fading strong trends.
- Confirm ranging market: ADX(14) < 25 (no strong trend present)
- Long entry: close < lower band AND RSI(14) < 30 (oversold confirmation)
- Short entry: close > upper band AND RSI(14) > 70 (overbought confirmation)
- Target: the middle SMA band (
basis) - Stop loss: 1.5× ATR(14) beyond the entry band
Strategy 3 — Walking the Band Trend Continuation
Market environment: strong trending markets · Best timeframe: 4H, Daily
In strong trends, price repeatedly touches or slightly exceeds the upper (uptrend) or lower (downtrend) band — a pattern John Bollinger calls "walking the band." This strategy stays in the trend until the walking pattern breaks. Pair with EMA(20) as a dynamic support/resistance filter.
- Confirm uptrend: close > EMA(50) on the same timeframe
- Entry: close touches or exceeds upper band while EMA(20) slope is positive (
ta.ema(close,20) > ta.ema(close,20)[1]) - Add to position on each subsequent upper-band touch
- Exit warning: price closes below the middle SMA for 2 consecutive bars
- Stop loss: below the middle SMA band
Disclaimer: The strategies above are for educational purposes only and do not constitute investment advice. Past performance does not guarantee future results. Always apply proper risk management and position sizing.
How to Generate Bollinger Bands in Pineify
- 1
Open Pineify
Go to pineify.app and sign in — a free account gives full access to the AI Coding Agent. No credit card required.
- 2
Click "New Indicator"
Select "Indicator" as the script type from the creation menu. Pineify will open the AI coding workspace.
- 3
Describe your Bollinger Bands setup
Type a prompt such as: "Add Bollinger Bands with a 20-period SMA, 2 standard deviations, and a blue fill between the bands." You can also request variants like EMA-based or squeeze detection logic.
- 4
Copy the generated script to TradingView
Click "Copy to TradingView" to copy the full Pine Script v6 code, then paste it into the TradingView Pine Script editor (Alt+P) and click "Add to chart" to see the bands live.
- 5
Adjust parameters in TradingView settings
Open the indicator settings panel in TradingView to change length (default 20) and multiplier (default 2.0) without editing code. Try length 10 for scalping or length 50 for position trading.
Frequently Asked Questions
Related Pine Script Indicators
Build Your Bollinger Bands Script in Seconds
Skip the manual coding. Pineify's AI Coding Agent generates complete, ready-to-use Pine Script Bollinger Bands indicators — including Squeeze detection, %B calculation, and custom MA types — instantly for free.
Try Pineify Free