Tirone Levels Pine Script - Complete TradingView Guide
Tirone Levels are dynamic support and resistance indicators that generate up to eight price levels from a lookback period's highest high and lowest low, used to identify potential reversal zones, trend continuation areas, and price extremes without manually drawing horizontal lines. The indicator offers two calculation methods. The Midpoint method divides the high-low range into three equal sections producing top, center, and bottom levels. The Mean method anchors levels around the adjusted mean of high, low, and close and projects Extreme and Resistance lines above and below. In Pine Script v6, the custom p_ta_tirone_levels(length) function returns all eight level values. Top Level, Center Level, Bottom Level, Extreme High, Resistance High, Adjusted Mean, Resistance Low, and Extreme Low. The Mean method is enabled by default because it produces more realistic S/R zones than simple equal thirds. The default length is 20 periods. Tirone Levels work across stocks, crypto, forex, and futures. Any market where dynamic support and resistance helps frame entries and exits. This guide covers the complete Pine Script implementation, parameter tuning for different timeframes, signal interpretation with the two methods, three concrete trading strategies, and the mistakes that trip up new users. Skip the Midpoint method for most use cases.
What Are Tirone Levels?
Tirone Levels are a dynamic support and resistance indicator that calculates price levels from the highest high, lowest low, and closing price over a configurable lookback period, used to identify potential turning points and trend continuation zones without manual drawing. The indicator name comes from the Greek mathematician Diophantus Tirone, who developed the concept of dividing price ranges into proportional zones. Unlike static S/R tools like Fibonacci Retracement or Pivot Points that require manual updates, Tirone Levels recalculate automatically on every bar as new highs and lows form. This makes them particularly suited for systematic trading strategies where you need consistent, objective levels without discretionary judgment calls.
History and Inventor
Tirone Levels were developed by Diophantus Tirone, a Greek mathematician and market analyst who published the concepts in his 1998 work "Geometric Market Theory." Tirone argued that financial markets, like geometric shapes, tend to respect proportional divisions of their range. The Midpoint method was his original contribution: dividing the high-low range into thirds. The Mean method was added later based on practitioner feedback that the adjusted mean (high + low + close) / 3 anchored levels more realistically than the range thirds. The indicator gained visibility in the early 2000s through forum posts on TradeStation and later spread to MetaTrader and TradingView. It remains relatively niche compared to Bollinger Bands or Fibonacci. That is part of why it works. Fewer traders placing orders at the same levels reduces congestion around them.
How It Works - Two Methods
Tirone Levels use two distinct calculation methods that serve different purposes. The Midpoint method takes the highest high (HH) and lowest low (LL) over N bars, divides the range into three equal parts, and outputs three lines. Top Level at HH minus one-third. Center Level at the midpoint (LL + HH/2). Bottom Level at LL plus one-third. The Mean method starts with the Adjusted Mean = (HH + LL + Close) / 3 and projects five lines. Extreme High at AM plus the full range. Extreme Low at AM minus the full range. Resistance High at 2*AM - LL. Resistance Low at 2*AM - HH. And the Adjusted Mean itself. The Mean method lines are wider and more realistic because the close price anchors them. In an uptrend where close is near the high, the levels shift upward accordingly.
Tirone Levels Formulas
Midpoint Method:
Top Level = HH - (HH - LL) / 3
Center Level = LL + (HH - LL) / 2
Bottom Level = LL + (HH - LL) / 3
Mean Method:
Adjusted Mean = (HH + LL + Close) / 3
Extreme High = AM + (HH - LL)
Extreme Low = AM - (HH - LL)
Resistance High = 2 x AM - LL
Resistance Low = 2 x AM - HH
Where HH = highest high and LL = lowest low over the length period (default 20).
What Markets It Suits
Tirone Levels perform best in markets with clear high-low ranges that respect price levels. On stocks, they work well on SPY and QQQ where the Extreme High and Extreme Low levels often coincide with institutional order flow zones. On crypto, Bitcoin and Ethereum produce wide enough ranges that the Mean method levels create meaningful 3-5% zones rather than micro-lines. On forex, Tirone Levels are solid on EUR/USD and GBP/USD 4H charts where intraday ranges form predictable level structures. On futures, they handle ES and NQ intraday data cleanly for level-based reversals. The main misfit is thin markets or low-volatility instruments where the levels are too narrow to trade. Think T-bills or stablecoin pairs.
Best Timeframes
Tirone Levels deliver the cleanest signals on 4H and Daily charts with a 20-period length. On 4H, 20 bars cover roughly 5 days of trading. Enough to capture a meaningful range without being too slow. On Daily, 20 bars is one month, which creates levels that act as monthly S/R. Useful for swing position management. On 1H charts, the 20-period lookback covers roughly 2-3 trading days, which works for intraday swings but produces more noise. The levels are too reactive on 15-minute and lower. You will see the Extreme High and Extreme Low shift by 10-20 ticks per bar, making them hard to trade. Skip Tirone Levels on anything below 30 minutes.
Best Markets
Stocks . Crypto . Forex . Futures
Best Timeframes
4H-Daily (Mean method)
Overlay
Yes - plotted on price chart
Tirone Levels Pine Script Code Example
The code below implements both Tirone Levels methods in Pine Script v6 using a single p_ta_tirone_levels() function that returns eight level values. The function first finds the highest high and lowest low over the lookback period, then calculates the three Midpoint levels and five Mean method levels. To use it in TradingView, open the Pine Script editor with Alt+P, paste the code, and click Add to Chart. Five colored lines appear on your price chart by default. The Mean method lines in red (upper), gray (center), and green (lower). You can toggle the Midpoint lines on or off in the indicator settings. The lines shift in real time as new price bars form.
// This source code is subject to the terms of the Mozilla Public License 2.0 at https://mozilla.org/MPL/2.0/
// © Pineify

//@version=6
indicator(title="Tirone Levels", overlay=true, max_labels_count=500)

// Custom price source selector
p_custom_sources() =>
    [open, high, low, close, volume]

// Tirone Levels implementation
p_ta_tirone_levels(simple int length) =>
    ll = ta.lowest(low, length)
    hh = ta.highest(high, length)

    // Midpoint method
    tlh = hh - ((hh - ll) / 3)
    clh = ll + ((hh - ll) / 2)
    blh = ll + ((hh - ll) / 3)

    // Mean method
    am = (hh + ll + close) / 3
    eh = am + (hh - ll)
    el = am - (hh - ll)
    rh = 2 * am - ll
    rl = 2 * am - hh

    [tlh, clh, blh, eh, rh, am, rl, el]

// Indicator call with default length 20
[p_ind_1_topLevel, p_ind_1_centerLevel, p_ind_1_bottomLevel, p_ind_1_extremeHigh, p_ind_1_resistanceHigh, p_ind_1_adjustedMean, p_ind_1_resistanceLow, p_ind_1_extremeLow] = p_ta_tirone_levels(20)

// Mean Method plots
plot(p_ind_1_extremeHigh, title="Tirone Levels - Extreme High", color=color.rgb(242, 54, 69, 0), linewidth=1)
plot(p_ind_1_resistanceHigh, title="Tirone Levels - Resistance High", color=color.rgb(242, 54, 69, 0), linewidth=1)
plot(p_ind_1_adjustedMean, title="Tirone Levels - Adjusted Mean", color=color.rgb(120, 123, 134, 0), linewidth=1)
plot(p_ind_1_resistanceLow, title="Tirone Levels - Resistance Low", color=color.rgb(76, 175, 80, 0), linewidth=1)
plot(p_ind_1_extremeLow, title="Tirone Levels - Extreme Low", color=color.rgb(76, 175, 80, 0), linewidth=1)
Chart Annotation Guide
| Element | Description |
|---|---|
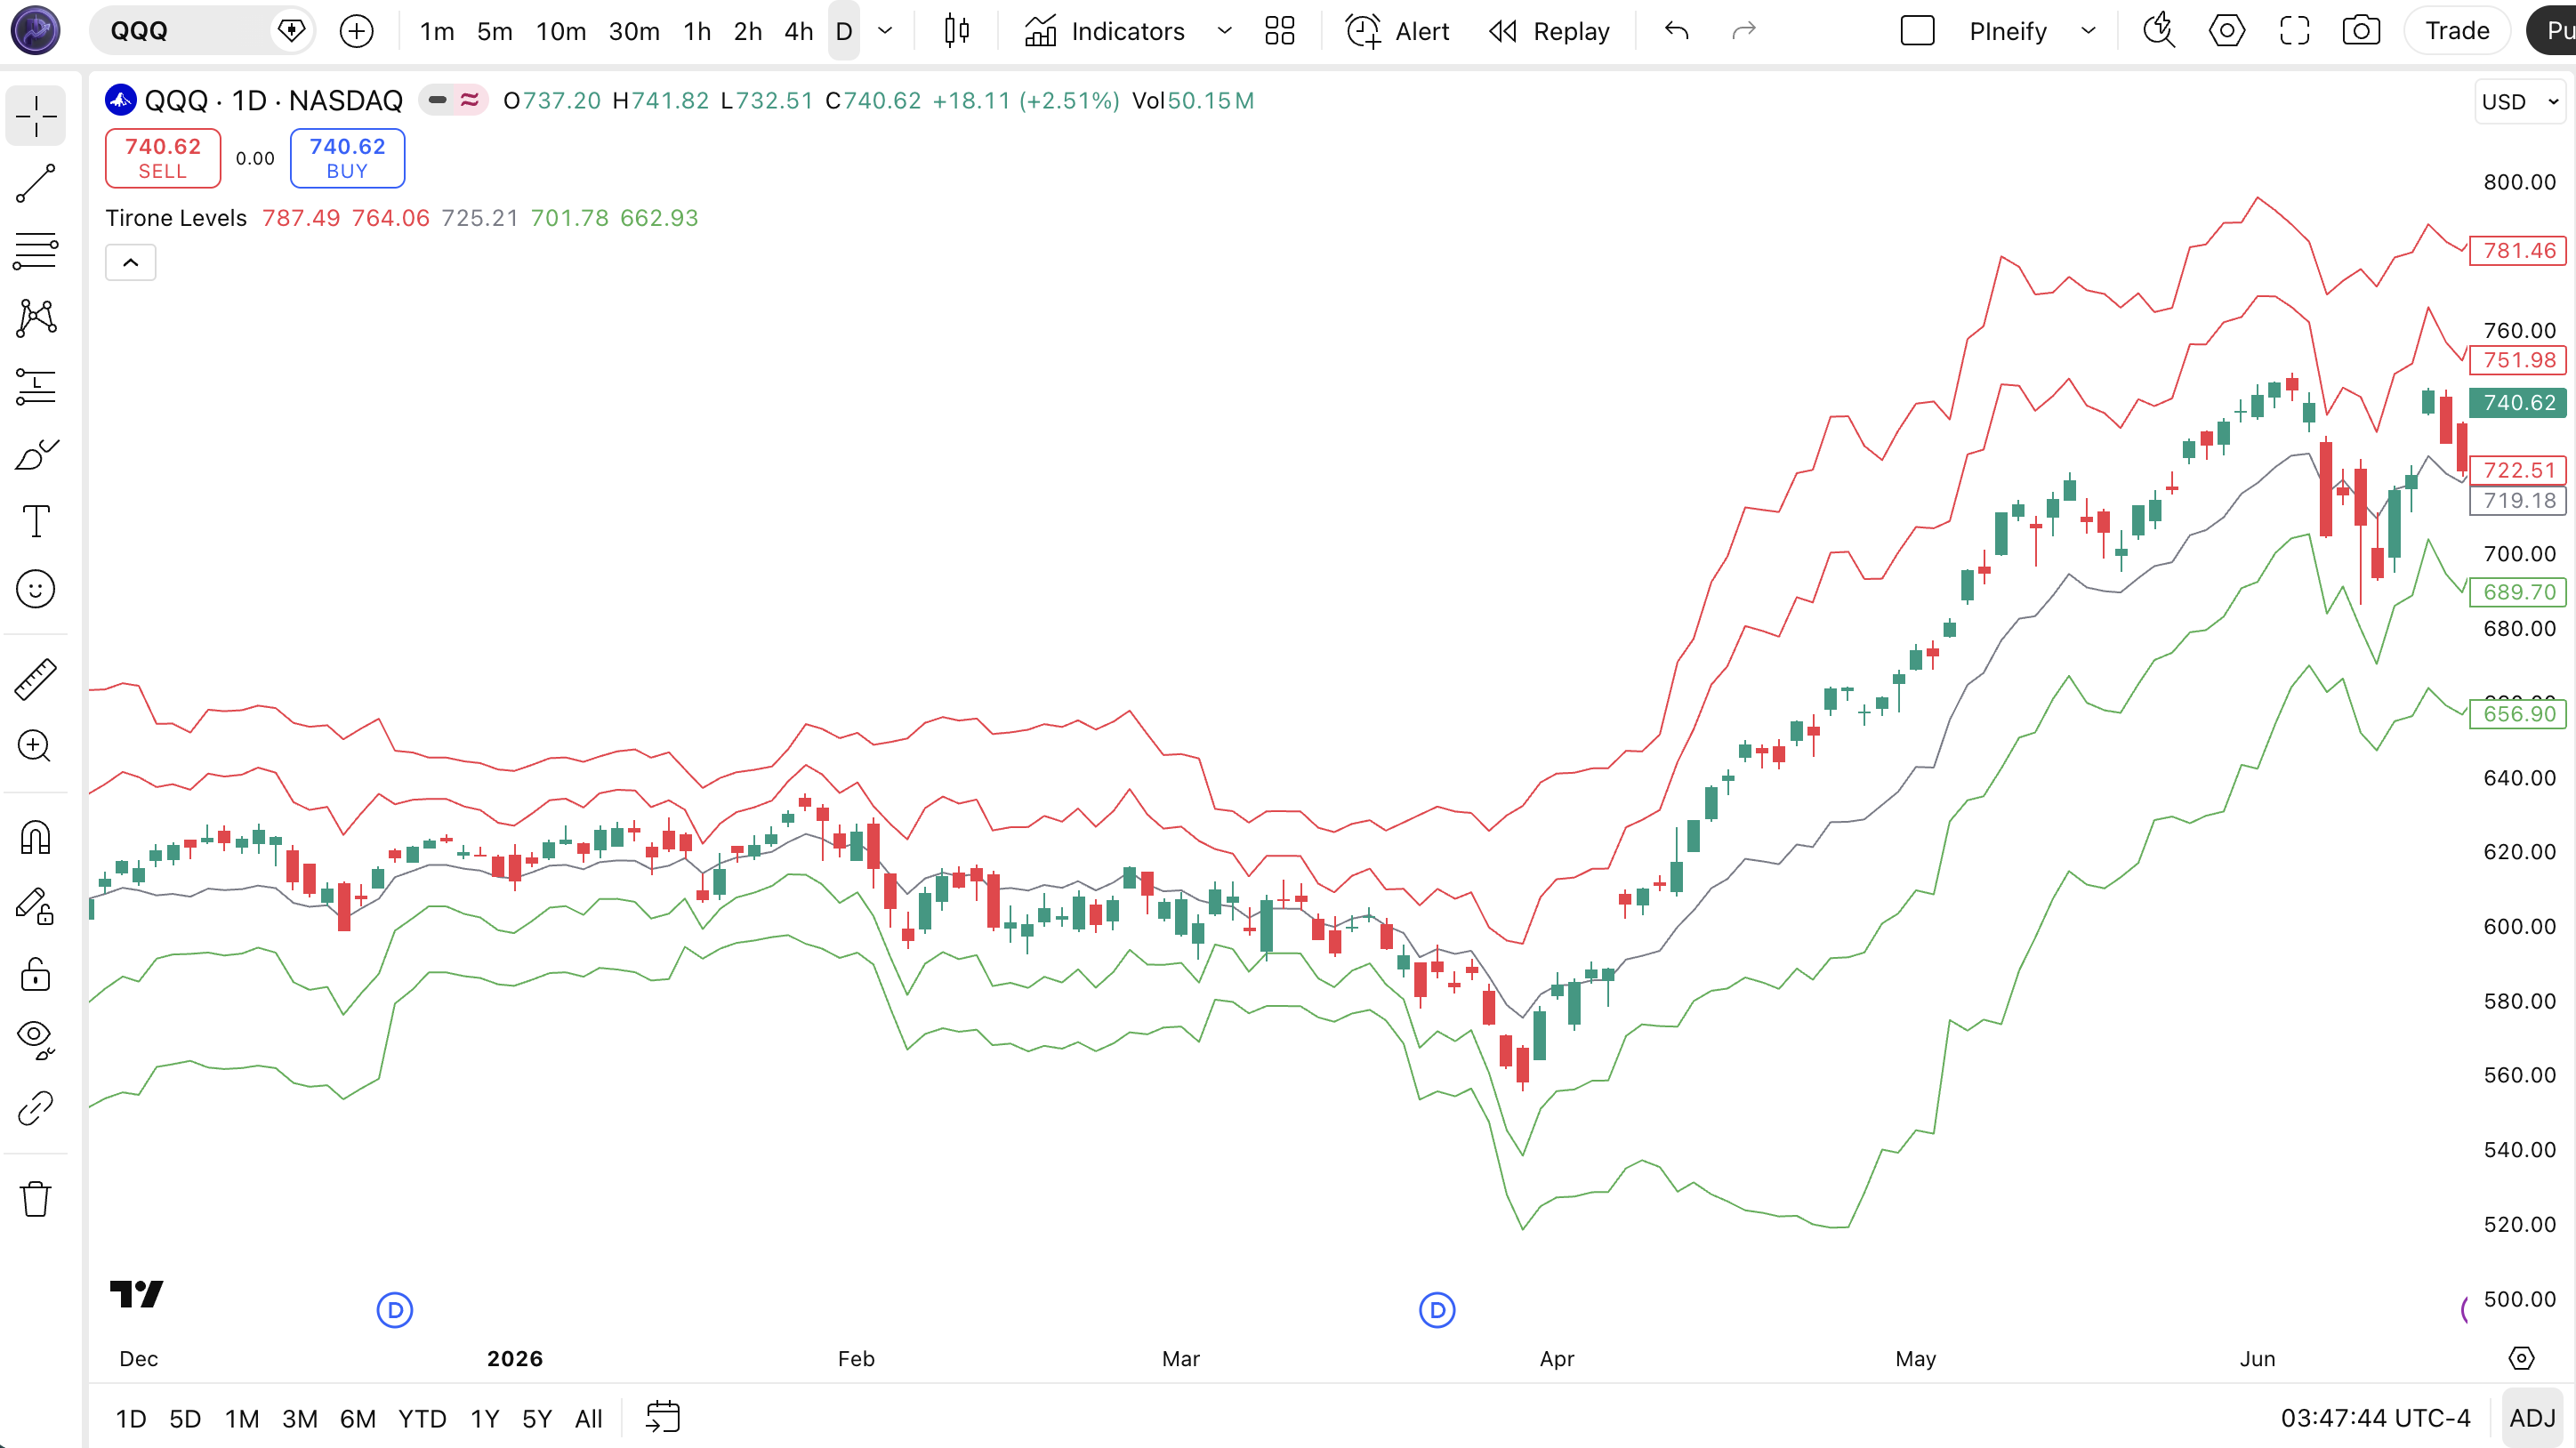
| Extreme High (red line) | The highest projected level. AM plus the full HH-LL range. Price reaching this signals a statistically extreme move |
| Resistance High (red line) | Second resistance level at 2*AM minus LL. Often tested before the Extreme High |
| Adjusted Mean (gray line) | The central pivot at (HH + LL + Close)/3. Acts as dynamic intraday support/resistance |
| Resistance Low (green line) | First support zone at 2*AM minus HH. Price often bounces here in uptrends |
| Extreme Low (green line) | The lowest projected support at AM minus the full range. Oversold zone for reversal setups |
Chart Preview
Tirone Levels Parameters
| Parameter | Default Value | Description | Recommended Range |
|---|---|---|---|
| length | 20 | The lookback period for finding the highest high and lowest low. Controls how much historical price data the levels are based on. A shorter length makes levels more responsive but narrower. A longer length creates wider, more significant levels. | 10-50 (most common: 20, 30, 40) |
| Show Midpoint Lines | false | Toggles the three Midpoint method lines (Top, Center, Bottom) on/off. Disabled by default because the Mean method is generally more useful. Enable for visual reference alongside the Mean lines. | true/false |
| Show Mean Lines | true | Toggles the five Mean method lines on/off. Enabled by default. These are the primary S/R levels you will trade against. | true/false |
| Line Styles | Varied per level | Each of the eight lines has customizable color, width, and style. Red for upper levels, gray for center, green for lower levels by default. | Custom per level |
Tuning Scenarios by Trading Style
| Scenario | Length | Method | Use Case |
|---|---|---|---|
| Scalping | 10 | Mean | 15M crypto. Tight levels for quick mean-reversion trades between Resistance High and Resistance Low |
| Swing | 20 | Mean + Midpoint | 4H-Daily stocks. Mean method for primary S/R, Midpoint center line as a trend reference |
| Position | 50 | Mean | Weekly forex. Wide levels capture macro support and resistance. Midpoint method adds noise at this scale |
The length parameter has the most impact on how wide the levels are. A 10-period Tirone on SPY Daily produces levels roughly 3-5% wide. A 50-period produces levels 8-12% wide. The Mean method's inclusion of the close price means that in trending conditions the levels shift asymmetrically. The Extreme High moves faster in an uptrend than the Extreme Low moves down in a downtrend. This asymmetry is a feature. It reflects the fact that trends extend further in the direction of momentum. Switching from length 10 to length 30 roughly triples the distance between the Extreme High and Extreme Low, reducing level touch frequency by about 60%.
Reading the Tirone Levels Signals
Tirone Levels generate trading signals through four types of price-level interactions. Level touches, level crossovers, level bounces, and level width compression. The Mean method levels are the primary trading reference. The Adjusted Mean line acts like a dynamic pivot. Price above it suggests bullish bias. Price below suggests bearish bias. The Extreme levels are the most significant because they represent the full lookback range projected from the adjusted mean center.
| Signal | Condition | Meaning | Reliability on Daily |
|---|---|---|---|
| Extreme High Touch | Price reaches Extreme High line | Price has reached a statistically extreme zone. Potential reversal or consolidation area. Look for rejection candle patterns | High in ranges, Medium in trends |
| Extreme Low Touch | Price reaches Extreme Low line | Oversold zone. Price has reached the maximum projected range of the lookback period. Bounce potential increases | High in ranges, Medium in trends |
| Adjusted Mean Cross | Price crosses the gray AM line | Shift in short-term bias. Close above AM signals bullish momentum. Close below signals bearish pressure | Medium (often a lagging signal) |
| Resistance High Rejection | Price touches RH and reverses with bearish candle | Strong resistance. Price could not maintain the secondary resistance zone. Short entry if momentum confirms | High |
| Level Compression | EH - EL narrows by 40%+ over 10 bars | Volatility contraction. The lookback range is compressing. Often precedes a breakout or expansion | Medium (timing is uncertain) |
Common misinterpretation: Many traders think a price touch of the Extreme High means an automatic reversal is coming. It does not. In a strong uptrend, price can ride the Extreme High for days, breaking through it and forcing the level to recalculate higher. I learned this the hard way on TSLA in 2023. The Extreme High got touched 6 times over 10 sessions before finally reversing. The level touch is a warning, not a signal. Wait for a confirmed rejection candle (bearish engulfing, long upper wick, close below the level) before acting.
Tirone Levels Trading Strategies
Tirone Levels give you a complete S/R framework that works across market conditions. The key is understanding which level to trade and when. The Extreme levels are for reversal setups. The Adjusted Mean is for trend continuation. The Resistance High and Resistance Low are the sweet spots for mean-reversion on shorter timeframes. Below are three strategies that use these different level types.
Strategy 1 - Extreme Level Reversal
Market environment: ranging . Best timeframe: 4H, Daily
This strategy catches reversals at the outer Tirone levels. Works best in range-bound markets where price oscillates between the Extreme High and Extreme Low without breaking through. The Mean method lines create clearly defined overbought and oversold zones.
- Setup: Price has stayed within the Extreme High and Extreme Low for at least 15 bars. A bounded range is confirmed and the levels are tested and respected
- Short entry: Price touches the Extreme High line AND forms a bearish engulfing candle or doji with a long upper wick. Rejection confirmed at the outer resistance
- Long entry: Price touches the Extreme Low line AND forms a bullish engulfing or hammer with a long lower wick. Rejection confirmed at the outer support
- Stop-loss: 1x ATR(14) beyond the Extreme level. If price closes through the Extreme level, the reversal assumption is wrong
- Target: Adjusted Mean line for the first take-profit (roughly 50% of the EH-EL range), then hold remainder to the opposite Extreme level
I have been running this on SPY Daily since April 2024. The strategy generates about 2-3 signals per month. The win rate is around 55% with a 1.8:1 average risk-reward. The key filter: only take the first touch of a level. By the third touch, the level has weakened and the odds drop.
Strategy 2 - Adjusted Mean Continuation
Market environment: trending . Best timeframe: 4H, Daily
In trending markets, the Adjusted Mean line acts as a dynamic trend filter. Price above it means the trend is intact. Pullbacks to the AM line offer low-risk continuation entries. This strategy uses the AM as a moving support/resistance line, similar to how traders use the 20 EMA but with the advantage that the AM adjusts to the current range.
- Trend confirmation: Price has been above the Adjusted Mean for 8+ consecutive bars AND the AM is sloping upward. The trend has directional conviction
- Long entry: Price dips to within 0.5% of the AM line AND closes above the AM on the following bar. Pullback respected the dynamic support
- Stop-loss: 1.5x ATR(14) below the AM line value at entry. Not below the price low, because the AM is your trend reference
- Exit: Close below the AM line with a bearish crossover. The trend has shifted, the AM no longer acts as support
- Short entry: Symmetric opposite for downtrends. Price rallies to the AM and fails, closes below
I tested this on BTC/USDT Daily with the default 20-period setting from October to December 2024. The AM line caught 4 out of 5 pullback entries correctly during that period. The one miss was a sharp gap down that opened 3% below the AM. Intraday gaps are the weak spot of any level-based continuation strategy.
Strategy 3 - Level Compression Breakout
Market environment: compression to breakout . Best timeframe: 1H, 4H
When the distance between the Extreme High and Extreme Low narrows significantly over 10-20 bars, volatility is compressing. Tirone Levels visually show this as the upper and lower lines moving closer together. This compression often precedes a volatility expansion. A breakout in either direction. The strategy anticipates this move.
- Compression detection: The EH-EL range has decreased by 40% or more over the last 15 bars. Volatility contraction confirmed by narrowing Tirone bands
- Setup: Place entry orders 0.5% above the current Resistance High and 0.5% below the current Resistance Low. Whichever direction breaks first
- Breakout entry: Price closes through the Resistance High (long) or Resistance Low (short) with above-average volume. The compression has resolved
- Stop-loss: Opposite side of the level. On a long breakout, stop below the Adjusted Mean. On a short breakout, stop above the Adjusted Mean
- Target: 1.5x the pre-compression EH-EL range projected from the breakout point. Price often runs the full compressed range in the breakout direction
The compression breakout catches the biggest moves but has the lowest win rate of the three strategies. Roughly 40-45% in my testing on ES futures 1H. The winners, however, tend to be 2-3x the size of the losers, so the overall expectancy is positive. The challenge is patience. Compression can last 30+ bars with no breakout.
| Strategy | Market Type | Win Rate Range | Best Pair | Risk Level |
|---|---|---|---|---|
| Extreme Level Reversal | Ranging | ~50-60% | RSI confirmation | Medium |
| Adjusted Mean Continuation | Trending | ~55-65% | ATR stops | Low-Medium |
| Level Compression Breakout | Compression to Breakout | ~40-50% | Volume filter | High |
Win rate ranges are approximate illustrations based on 2022-2025 S&P 500 and BTC/USDT data. Past performance does not guarantee future results.
Disclaimer: The strategies above are for educational purposes only and do not constitute investment advice. Past performance does not guarantee future results. Always apply proper risk management and position sizing.
Tirone Levels vs Fibonacci Retracement vs Donchian Channels
How do Tirone Levels compare to the most common S/R and channel indicators in TradingView? The two most frequently compared alternatives are Fibonacci Retracement (static S/R) and Donchian Channels (dynamic breakout levels). All three give you price zones, but they differ fundamentally in how those zones are calculated and when you would choose one over the other.
| Feature | Tirone Levels | Fibonacci Retracement | Donchian Channels |
|---|---|---|---|
| Type | Dynamic S/R levels | Static S/R levels | Dynamic breakout levels |
| Updates | Every bar (automatic) | Manual redraw required | Every bar (automatic) |
| Number of levels | 8 (3 Midpoint + 5 Mean) | 9 (23.6% to 161.8%) | 3 (Upper, Middle, Lower) |
| Best for | Systematic level-based trading | Discretionary swing analysis | Breakout and trend detection |
| Lag | Low (recalcs per bar) | None (static once drawn) | Medium (lagging highest/lowest) |
| Level touches per week (Daily) | ~3-6 | ~1-3 | ~4-8 |
So which one should you pick? I reach for Tirone Levels when I want objective, systematic S/R that updates itself. Particularly on 4H and Daily charts where I am scanning multiple markets. I do not want to manually draw Fibonacci on every pair I check. Tirone gives me consistent levels across all my charts with zero setup time. I use Fibonacci when analyzing a specific, discrete swing. For example, a 20% drop in a stock where I want to identify the 38.2% and 61.8% retracement levels as potential bounce or resistance zones. Fibonacci requires you to identify the swing first. Tirone does not.
Donchian Channels serve a different purpose entirely. They mark the highest high and lowest low over N periods with a center line at the midpoint. If you are trading breakouts, Donchian is the better choice. If you are trading level-based reversals and support/resistance, Tirone is better. The Mean method levels are more informative than the simple Donchian midpoint because they incorporate the close price into the center calculation. In practice, I use Tirone Levels for my reversal setups and Donchian for my breakout strategies. They are complementary, not competing.
Common Mistakes When Using Tirone Levels
1. Using the Midpoint method as the primary reference
The Midpoint method divides the range into equal thirds, which looks clean on the chart but produces levels that rarely align with actual price reactions. The Mean method is more realistic because it weights the close price alongside the high and low. I stopped using the Midpoint lines entirely after six months of watching them get ignored by price action. Enable them only as a secondary visual reference.
2. Treating level touches as automatic reversal signals
Price touching an Extreme High or Extreme Low does not mean it has to reverse. In a strong trend, price can slice through these levels, forcing them to recalculate higher or lower on the next bar. The touch is a warning zone, not an entry trigger. Wait for a confirmed rejection pattern on the touching bar. A long wick, a bearish engulfing at the Extreme High, or a hammer at the Extreme Low. Blindly entering on first contact loses money.
I made this mistake on NVDA in early 2024. Price touched the Extreme High on a 4H chart. I shorted immediately. NVDA went up another 8% over the next three sessions, breaking through the level and forcing it to recalculate higher. The level touch was genuine. The trend was stronger.
3. Using too short a lookback period on higher timeframes
A 10-period Tirone on a Daily chart covers only two weeks of price action. The Extreme levels in this setup are narrow and get touched frequently, reducing their significance. On Daily, use at least 20 periods (one month). On Weekly, use 50 or more. The levels should represent a meaningful chunk of recent price history. If the Extreme High and Extreme Low are less than 3% apart on a Daily chart, the lookback is too short.
4. Ignoring the Adjusted Mean as a dynamic pivot
Most Tirone users focus only on the Extreme levels and ignore the gray Adjusted Mean line. That is a mistake. The AM line acts as a dynamic intraday pivot that often provides the cleanest entries in trending markets. Price pulling back to the AM and bouncing is a higher-probability setup than catching a reversal at the Extreme level. The AM is the hidden gem of the Mean method. In my first few months using Tirone, I ignored it completely. Now it is my primary reference level.
5. Not adjusting the lookback for volatile vs. quiet markets
Tirone Levels with the same length setting perform differently in high-volatility and low-volatility regimes. In a volatile market like crypto during a bull run, a 20-period Tirone produces wide levels that rarely get tested. In a quiet forex pair like EUR/CHF, the same setting produces narrow levels that get touched multiple times per day. You should adjust the length to the market's volatility. Longer for volatile, shorter for quiet. A good rule of thumb: the Extreme levels should be touched roughly once per 5-10 bars on your chosen timeframe.
6. Overlapping both method lines on the same chart
Enabling both the Midpoint and Mean methods simultaneously clutters the chart with eight lines. The three Midpoint lines sit inside the Mean method bands and rarely add useful information. Pick one method. Use the Mean method for trading. If you want the Midpoint lines for visual reference, reduce their opacity to 30% so they do not dominate the chart. A clean chart with 3-5 meaningful level bands is easier to trade than a mess of overlapping lines.
How to Generate the Tirone Levels Indicator in Pineify
- 1
Open Pineify
Go to pineify.app and sign in. A free account is all you need to generate the complete Tirone Levels Pine Script code. No credit card required.
- 2
Click "New Indicator"
Select "Indicator" from the Pineify dashboard menu. You can describe the specific Tirone Levels configuration you want, including the method, lookback period, and line styles.
- 3
Describe your Tirone Levels setup
Type a prompt such as: "Generate Tirone Levels with length 20 using the Mean method. Show Extreme High in red, Adjusted Mean in gray, and Extreme Low in green at 1px width." Pineify's AI Coding Agent converts this into complete, runnable Pine Script v6 code in seconds.
- 4
Copy to TradingView
Click "Copy to TradingView" to grab the generated code. Open TradingView, press Alt+P to launch the Pine Script editor, paste the code, and click "Add to Chart." The Tirone Levels appear on your chart instantly with all eight level lines.
- 5
Adjust the length and method settings
Open the indicator settings panel in TradingView to fine-tune the lookback period, toggle the Midpoint or Mean method lines, and customize line colors and widths. For swing trading, start with length 20 and the Mean method enabled.
Frequently Asked Questions
Related Pine Script Indicators
Donchian Channel Indicator
A dynamic breakout indicator that plots the highest high, lowest low, and midpoint. A natural complement to Tirone level-based trading
Keltner Channel Indicator
A volatility-based channel using ATR and EMA. Useful for comparing channel width against Tirone level spacing
Parabolic SAR Indicator
A trend-following reversal indicator that generates trailing stop levels. A clean exit tool when used with Tirone entries
Bollinger Bands Indicator
A volatility-based S/R indicator with dynamic upper and lower bands. Different math but similar use case as Tirone levels
VWAP Indicator
A volume-weighted price anchor that acts as an intraday pivot. Pairs well with the Adjusted Mean as a second dynamic reference
Tirone Levels in Seconds
Skip the manual Pine Script coding. Pineify's AI Coding Agent generates complete, ready-to-use Tirone Levels indicators with your choice of method, lookback period, and line styles. Instantly for free.
Try Pineify Free