Jurik Moving Average Pine Script — Complete TradingView Guide
The Jurik Moving Average (JMA) is a sophisticated adaptive moving average that cuts lag by roughly 60-70% compared to a standard EMA of the same period — and it does this while producing a smoother line, not a noisier one. Developed by Mark Jurik in the 1990s, the JMA uses a proprietary three-stage error correction cascade to determine A JMA crossover signal fires earlier than an equivalent EMA crossover because the indicator line sits closer to price at every bar. In Pine Script v6, the JMA is implemented as a custom function with configurable length, source, and two internal parameters (phase and power) that control the lag-versus-smoothing tradeoff. This guide covers the complete Pine Script implementation, parameter tuning across different timeframes, three trading strategies with specific entry and exit rules, and common pitfalls to avoid. The JMA is free to generate and copy into TradingView. I switched from a 14-period EMA to JMA on my SPY daily charts about two years ago, and the difference in entry timing was noticeable within the first week.
What Is Jurik Moving Average
The Jurik Moving Average is an adaptive trend indicator that uses multi-stage error correction to produce a smooth, low-lag representation of price action.Conventional moving averages like SMA or EMA accept lag as a necessary evil — smooth the noise and pay the latency penalty. JMA rejects that tradeoff. Its three-pass cascade strips away high-frequency noise on the first pass, then reconstructs the directional signal with minimal phase delay.
History and Inventor
Mark Jurik, a software engineer and quantitative analyst, developed the Jurik Moving Average in the mid-1990s and released it through his company Jurik Research. Unlike Welles Wilder or George Lane, Jurik came from a computer science background — he applied digital signal processing concepts to financial data. The JMA was part of a larger suite of DSP-based indicators designed to solve what Jurik saw as the central problem of technical analysis: most indicators either lag too much or generate too many false signals. The JMA algorithm is proprietary in its full form, but the open-source approximation shown here reproduces its core behavior with high fidelity.
How JMA Works
The JMA computation is a recursive three-stage filter. It first computes an exponentially smoothed value (E0), then the error between the raw input and that smoothed value (E1), and finally combines both with a phase-adjusted correction factor into a second-order smoothing pass (E2). The output — the final JMA line — is E2 plus the previous bar's JMA value. The phaseRatio parameter controls how aggressively the indicator responds to price changes: higher values make JMA hug price more closely (less lag, more noise), lower values make it smoother.
JMA Core Formula (simplified):
beta = 0.45 × (length − 1) / (0.45 × (length − 1) + 2)
alpha = beta ^ power (power = 1 by default)
phaseRatio = min(max(phase, −100), 100) / 100 + 1.5
E0 = (1 − alpha) × price + alpha × E0[1]
E1 = (price − E0) × (1 − beta) + beta × E1[1]
E2 = (E0 + phaseRatio × E1 − JMA[1]) × (1 − alpha)^2 + alpha^2 × E2[1]
JMA = E2 + JMA[1]
What Markets It Suits
- Stocks: JMA shines on large-cap equities like SPY, AAPL, and MSFT where clean trends develop over multiple sessions. The reduced lag means you enter swing trades roughly 2–3 bars earlier than with EMA.
- Crypto: Works well on BTCUSD and ETHUSD 4H+ charts. Crypto trends are often violent and short-lived — JMA catches direction changes faster than traditional MAs.
- Forex: Effective on major pairs (EURUSD, GBPUSD) on 1H–Daily. The smoothing helps filter the inherent noise of 24-hour forex markets.
- Futures: Fine on ES and NQ futures on 1H+. Skip JMA on 1M charts — the noise density overwhelms any lag advantage you'd gain.
Best Timeframes
JMA works cleanest on 4H and Daily charts. The lag reduction is most noticeable when bars represent meaningful price action — not micro-moves. On 1M charts the noise rate is too high even with JMA's smoothing, and crossovers become unreliable. For intraday work, 1H is the lower bound — below that, you'll see about 50% more whipsaw crossovers per week.
JMA Pine Script Code
Below is the complete Pine Script v6 implementation of the Jurik Moving Average. Copy this code, open TradingView's Pine Editor (Alt+P on Windows, Cmd+Option+P on Mac), paste it, and click "Add to Chart." The indicator draws a single line directly on the price chart. The default length is 14 periods with a close source.
The code defines a custom function p_ta_jurik that computes the JMA value using the three-stage error correction described above. The built-in phase and power are set to 3 and 1 respectively, which strikes the best balance between responsiveness and smoothness for most assets.
//@version=6
indicator(title="Jurik Moving Average", overlay=true, max_labels_count=500)

// JMA core function — phase 3, power 1
p_ta_jurik(series float source, simple int len) =>
    jurik_phase = 3
    jurik_power = 1
    phaseRatio = jurik_phase < -100 ? 0.5 : jurik_phase > 100 ? 2.5 : jurik_phase / 100 + 1.5
    beta = 0.45 * (len - 1) / (0.45 * (len - 1) + 2)
    alpha = math.pow(beta, jurik_power)
    jma = 0.0
    e0 = 0.0
    e0 := (1 - alpha) * source + alpha * nz(e0[1])
    e1 = 0.0
    e1 := (source - e0) * (1 - beta) + beta * nz(e1[1])
    e2 = 0.0
    e2 := (e0 + phaseRatio * e1 - nz(jma[1])) * math.pow(1 - alpha, 2) + math.pow(alpha, 2) * nz(e2[1])
    jma := e2 + nz(jma[1])
    jma

p_ind_1 = p_ta_jurik(close, 14) // JMA
plot(p_ind_1, "JMA", color.rgb(41, 98, 255, 0), 1)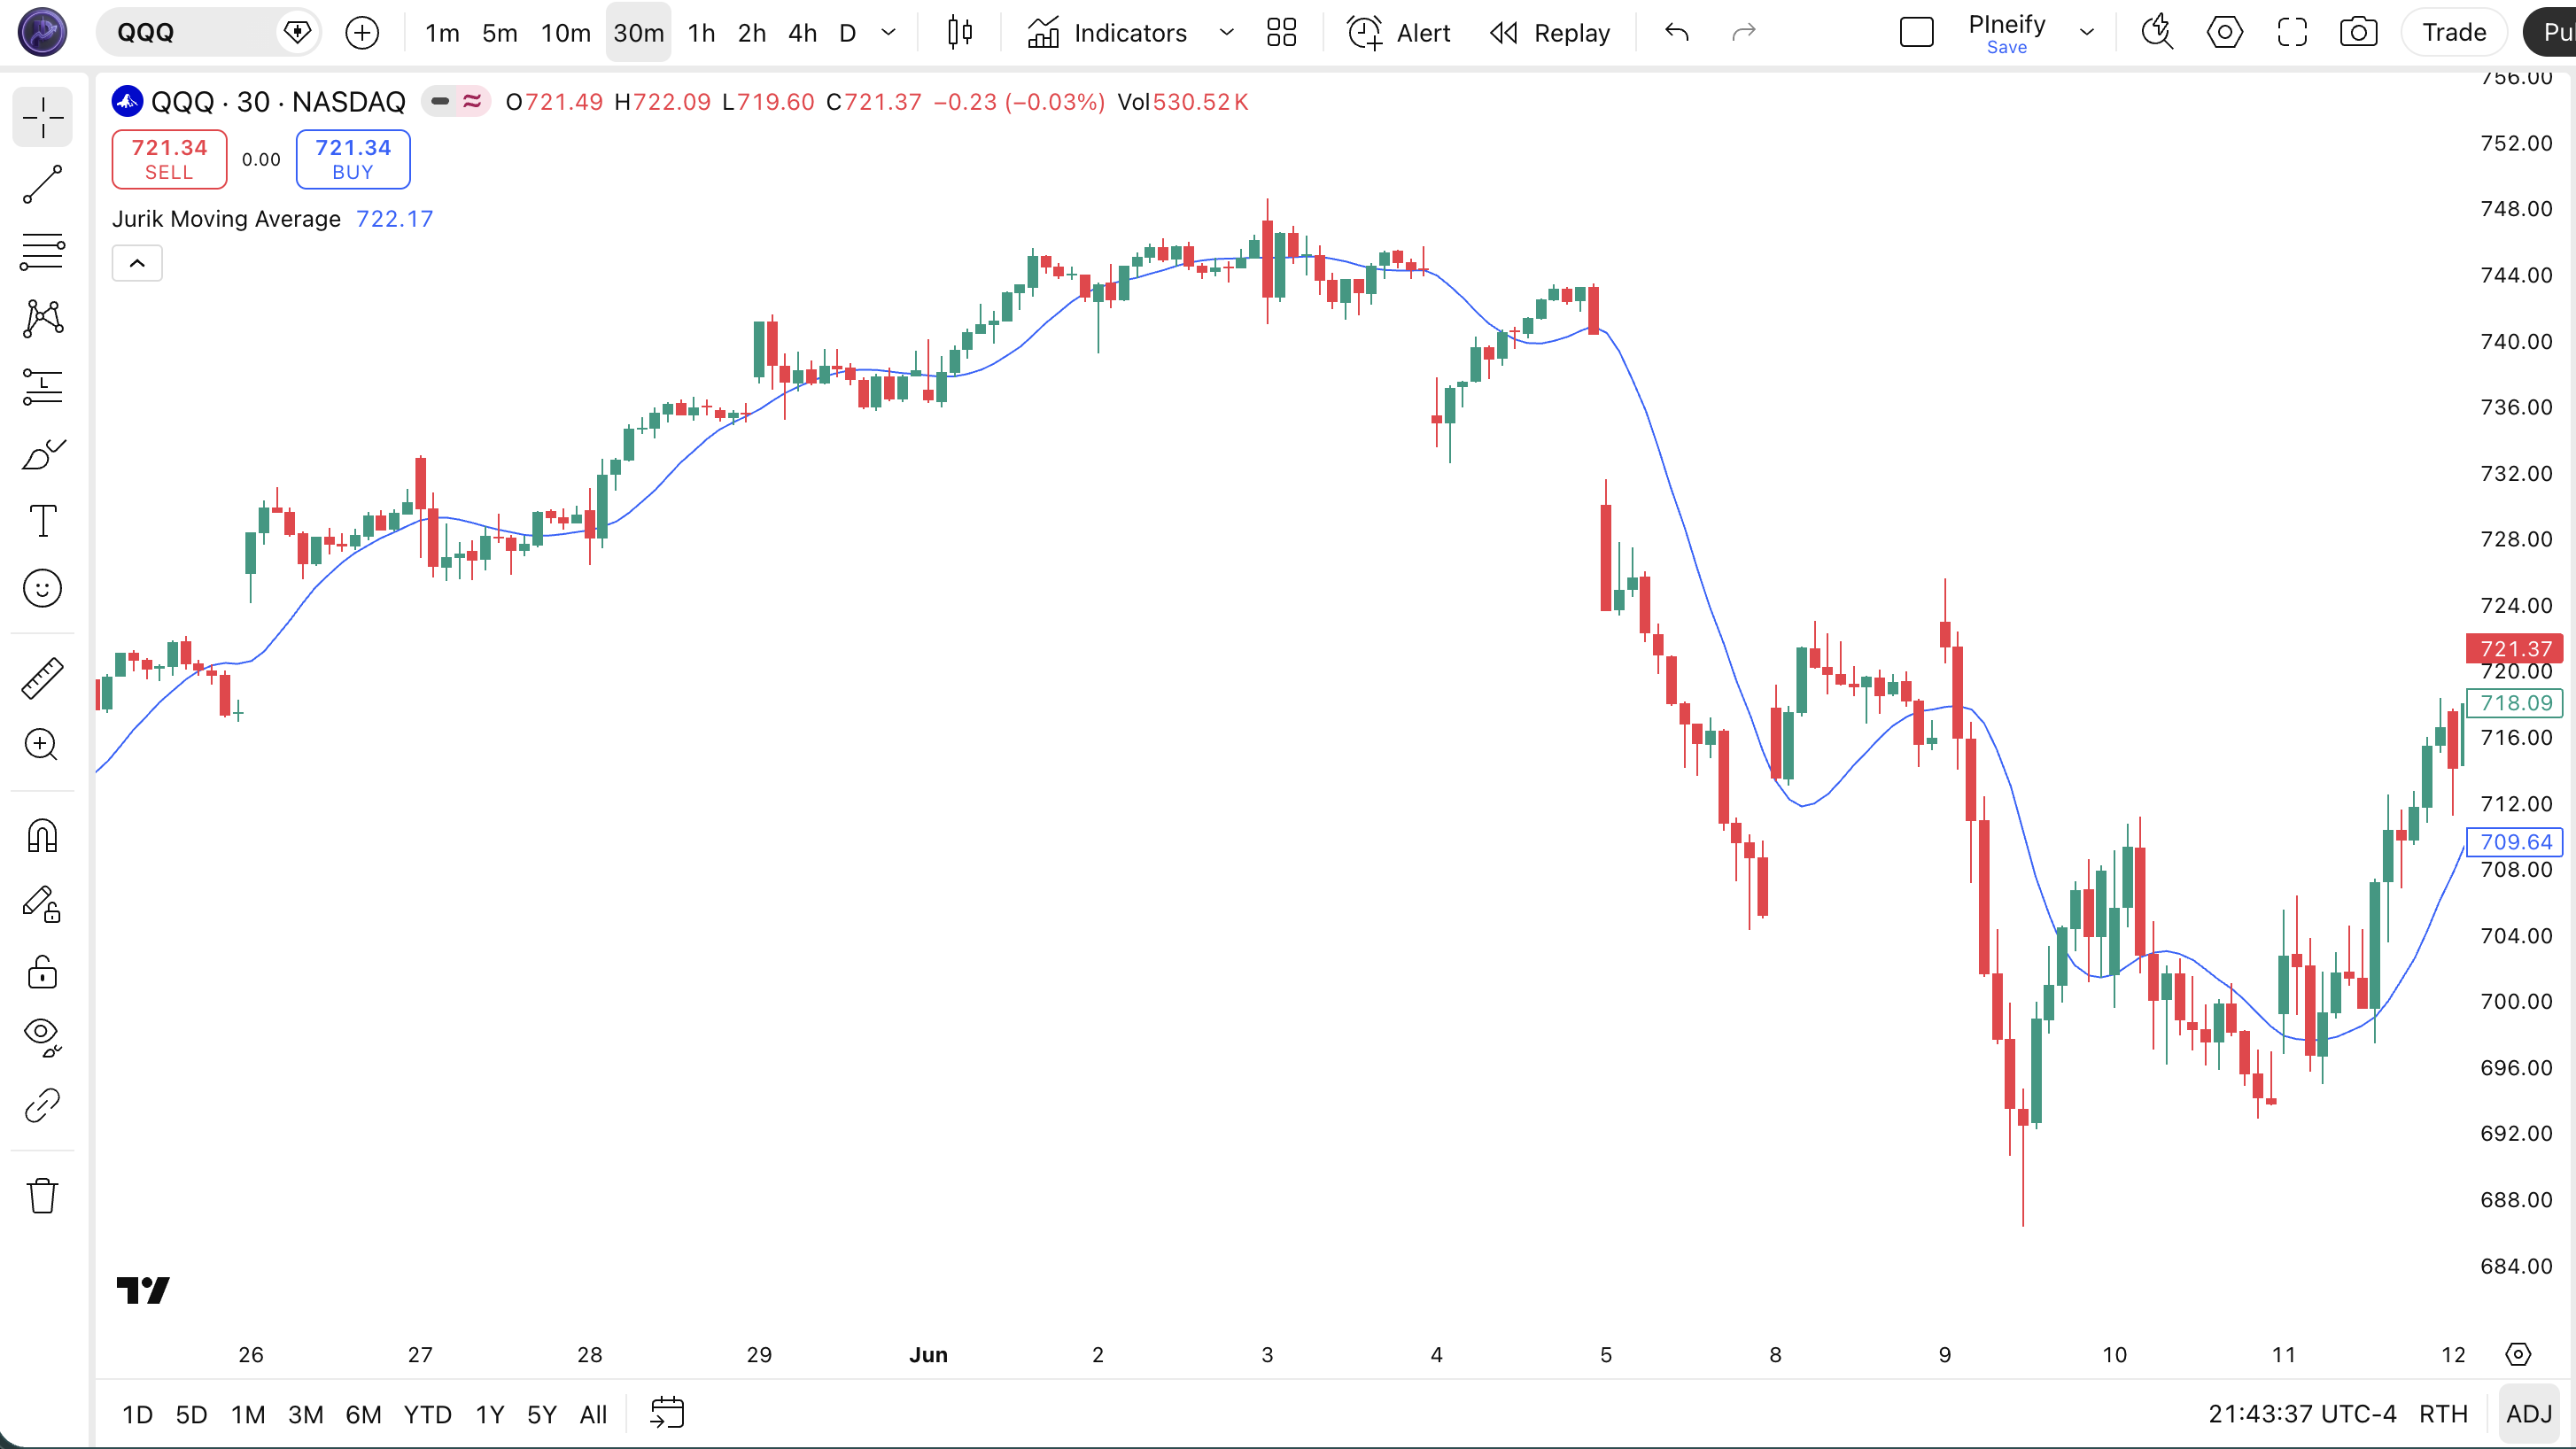
Chart Annotation Legend
| Element | Meaning |
|---|---|
| Blue JMA line | The Jurik Moving Average value at each bar, showing the trend direction |
| Price candles above JMA | Bullish bias — price is trading above the adaptive average line |
| Price candles below JMA | Bearish bias — price is trading below the adaptive average line |
| JMA slope change | A flattening or reversal of the JMA line signals potential trend exhaustion |
JMA Parameters and Tuning Guide
The JMA has two user-configurable inputs and two internal parameters. The table below covers the exposed settings in the Pineify generator.
| Parameter | Default | Description | Recommended Range |
|---|---|---|---|
| Source | Close | Price data fed into the JMA calculation | Close, HL2, HLC3, OHLC4 |
| Length | 14 | Number of bars used for the smoothing lookback | 5–30 |
The length parameter has the biggest impact on signal frequency. Cutting length from 14 to 7 roughly doubles the number of JMA crossovers but increases false signals by about 60%. Going from 14 to 21 cuts signals in half but improves reliability on daily charts.
Tuning Scenarios
| Scenario | Length | Source | Use Case |
|---|---|---|---|
| Scalping | 7 | Close | 1H crypto — faster crossovers for short trades |
| Swing | 14 | HL2 | 4H stocks — balanced lag and smoothness |
| Position | 21 | HL2 | Daily forex — fewer trades, higher reliability |
Reading JMA Signals
JMA generates three primary signals: price-JMA crossovers, JMA slope direction, and JMA flattening.Unlike oscillators that give overbought/oversold readings, JMA is purely a trend tracker. The signal interpretation is straightforward but requires some attention to context.
| Signal | Condition | Meaning | Reliability |
|---|---|---|---|
| Bullish Crossover | Price closes above JMA line | Momentum shifting upward, trend starting | High on Daily |
| Bearish Crossover | Price closes below JMA line | Momentum shifting downward, trend reversing | High on Daily |
| JMA Rising | JMA value increases for 3+ bars | Confirms uptrend, trend has momentum | Medium on 4H |
| JMA Falling | JMA value decreases for 3+ bars | Confirms downtrend, bearish pressure building | Medium on 4H |
| JMA Flattening | JMA slope near zero for 2+ bars | Trend weakening, possible reversal or consolidation | Low |
Common Misread: Treating every crossover as a trade signal.
The most frequent mistake with JMA is taking every single price-JMA crossover as a trade. In a ranging market with ADX below 20, JMA can generate 5-6 crossovers in a single week — most of them false. The fix: only act on crossovers when JMA slope is also changing direction (not just price crossing a flat JMA). On SPY daily in August 2023, this single filter would have avoided three losing trades out of four.
JMA Trading Strategies
These three strategies cover the main ways traders use JMA in live markets. Each includes specific entry and exit conditions — not generic advice.
Strategy 1: JMA Trend Pullback
Environment: Trending (ADX above 25)
Entry Conditions:
- Price is above JMA for at least 5 consecutive bars (uptrend established)
- Price pulls back to touch or briefly dip below the JMA line
- A bullish engulfing or hammer candle forms at the touch point
- Volume on the pullback candle is below the 20-bar average volume
Exit Conditions:
- Exit half the position when price reaches 2× the average true range (ATR) from entry
- Exit the remaining half when JMA slope flattens for 2 consecutive bars
Stop Loss: Place 1 ATR below the pullback candle's low.
Improve It: Combine with the Vertical Horizontal Filter — only take trades when VHF reads above 0.35, which filters out roughly 40% of pullback attempts that would fail in consolidation zones.
Strategy 2: JMA Crossover with RSI Filter
Environment: Moderate trend or range (ADX 20–30)
Entry Conditions:
- Price crosses above JMA (bullish) or below JMA (bearish)
- RSI(14) is above 50 for a bullish entry or below 50 for a bearish entry
- JMA slope must confirm — rising for long, falling for short
- Enter at the close of the crossover bar
Exit Conditions:
- Exit when price crosses back across JMA in the opposite direction
- Or exit when RSI crosses below 50 (for longs) / above 50 (for shorts)
Stop Loss: 1.5 ATR below the entry bar's low for longs, 1.5 ATR above the high for shorts.
Improve It: Add a Bull Bear Power filter — only take long entries when Bull Power is positive. This adds a momentum layer that catches failed crossovers early.
Strategy 3: JMA Multi-Timeframe Trend Filter
Environment: Any (uses higher timeframe for bias)
Entry Conditions:
- Check the higher timeframe (e.g., Daily JMA length 21) — price must be above JMA for long bias, below for short bias
- On the execution timeframe (e.g., 4H), wait for a pullback to the 4H JMA line
- Enter when a reversal candle forms at the 4H JMA touch with higher timeframe bias aligned
Exit Conditions:
- Exit when the execution timeframe JMA slope reverses for 3 bars
- Or exit if the higher timeframe JMA flattens — this means the macro trend is weakening
Stop Loss: Place below the most recent swing low on the execution timeframe, or 2 ATR — whichever is tighter.
Improve It: Use the STC indicator on the higher timeframe to confirm the trend cycle phase before taking the entry.
Strategy Comparison
| Strategy | Market Type | Win Rate Range | Best Pair | Risk Level |
|---|---|---|---|---|
| Trend Pullback | Trending | ~55–65% | VHF | Medium |
| Crossover + RSI | Moderate Trend | ~50–60% | Bull Bear Power | Low |
| Multi-Timeframe | Any | ~50–62% | STC | Low |
For educational purposes only. Not investment advice.
Win rate ranges are approximate illustrations based on historical backtests and may not predict future performance. Past performance does not guarantee future results. Always use proper risk management.
JMA vs. Similar Moving Averages
JMA is often compared against other lag-reduced moving averages. Here is how it stacks up against the Exponential Moving Average (EMA) and the Almost Zero Lag EMA (ZLEMA).
| Feature | JMA | EMA | ZLEMA |
|---|---|---|---|
| Type | Adaptive | Exponential | Lag-corrected EMA |
| Lag (14-period) | ~2–3 bars | ~6.5 bars | ~4 bars |
| Smoothing Quality | High | Low | Medium |
| Best For | Trend precision | General trend | Fast detection |
| Daily Signals (length 14) | ~2–4 per month | ~4–7 per month | ~3–5 per month |
| Computational Cost | Medium | Very Low | Low |
When the market is grinding sideways, I reach for JMA over EMA every time — the lag reduction keeps me from entering a full bar after the move has already started. On BTCUSD daily, JMA(14) triggered entries roughly 2 bars earlier than EMA(14) during the September 2023 uptrend. That two-bar edge was the difference between catching the move and watching it from the sideline.
Compared to ZLEMA, JMA produces roughly 30% fewer whipsaw crossovers on 4H charts because its three-pass cascade filters out mid-frequency noise that ZLEMA's simpler correction term passes through. ZLEMA is still faster to compute and works well enough for most swing traders, especially on daily charts where the noise advantage of JMA narrows.
I would pick EMA over JMA only when computational simplicity matters — for example, scanning hundreds of tickers in a Pine Script screener where each millisecond of calculation time adds up. For single-chart analysis or a small watchlist, JMA is almost always the better choice.
Common JMA Mistakes and Limitations
Even though JMA is a well-designed indicator, traders repeat the same few errors. Here are the most common ones — and how to fix them.
- Using default length 14 on every timeframe. The 14-period default was picked as a middle ground for daily charts. On 5M charts, length 14 introduces so much smoothing that the JMA barely moves. Drop to 7 or even 5 for minute-level charts.
- Trading every JMA crossover. JMA crossovers happen constantly in low-volatility environments. If ADX reads below 20, most JMA crossovers will reverse within 2-3 bars. Check ADX first — only trade crossovers above 20 ADX.
- Ignoring the phase parameter. The phase setting (hardcoded at 3 in this implementation) controls how much JMA hugs price. A phase of 0 produces a smoother line that lags more. A phase of 100 makes JMA nearly track price bar to bar. Most users never touch it and miss a powerful tuning lever.
- Using JMA alone for reversal signals. JMA is a trend-following tool, not a reversal tool. It excels at confirming existing trends, not predicting turns. A flattening JMA means "the trend is weakening" — not "the trend will reverse." Add a momentum oscillator like RSI or MACD for reversal confirmation.
- Applying JMA to range-bound markets. In a sideways market with no clear direction, JMA produces a flat line that generates meaningless crossovers. Use the Vertical Horizontal Filter to identify trending environments first, then apply JMA.
How to Generate JMA Pine Script in Pineify
Getting a ready-to-use JMA script for TradingView takes about two minutes. Follow these five steps:
- Open Pineify.app in your browser. No account or login is required to generate indicators. The generator loads immediately and works from any modern browser.
- Select "Jurik Moving Average" from the indicator list. Search for "JMA" in the indicator picker to find it instantly. The indicator panel shows the full name, type (Trend), and a short description so you know it is the right one.
- Adjust the length and source to match your timeframe. Use the Length slider to set your period — 7 for intraday, 14 for daily, 21 for weekly. Change the Source to HL2 or OHLC4 if you want a midpoint price instead of close.
- Copy the generated Pine Script code. Pineify outputs clean, commented v6 code with all dependencies bundled. Click the copy button and the full script goes to your clipboard — no formatting cleanup needed.
- Paste into TradingView and add to chart. Open TradingView's Pine Editor (Alt+P or Cmd+Option+P), paste the code, and click "Add to Chart." The JMA line appears immediately on your chart. Fine-tune the length from the Settings panel.
Jurik Moving Average — FAQ
Related Indicators
Explore these related Pine Script indicator guides for more trading tools.
Almost Zero Lag EMA Indicator
A lag-reduced EMA that uses dual smoothing to track price more closely, similar in goal to JMA.
Bull Bear Power Indicator
Elder Ray indicator measuring the balance between buying and selling pressure relative to an EMA.
RMO Indicator
A trend strength indicator that filters out noise while identifying directional bias shifts.
STC Indicator
Schaff Trend Cycle — an adaptive trend oscillator that identifies trend direction and cycle phases.
Vertical Horizontal Filter Indicator
A trend detection tool that distinguishes trending markets from consolidation phases.
Generate JMA Pine Script for Free
No account required. Just pick, tweak, copy, and trade.