Guppy Multiple Moving Average (GMMA) Pine Script — Complete TradingView Guide
The GMMA does one thing that no single moving average can: it separates trader behavior from investor behavior in real time. Developed by Australian trader Daryl Guppy in 2004, the Guppy Multiple Moving Average plots 12 exponential moving averages in two color-coded groups across your price chart. The short-term group (six blue EMAs from 3 to 15 periods) tracks the fast crowd — traders who jump in and out of positions quickly. The long-term group (six red EMAs from 30 to 60 periods) tracks the slow crowd — investors holding through the noise. When the blue ribbon sits above the red ribbon, the trend is up and both crowds agree. When the blue ribbon drops below the red ribbon, the trend is down and the sellers are in control. The vertical distance between the two groups tells you how much conviction the market has: wide separation means strong conviction, tight compression means uncertainty. I have been using GMMA on daily SPY charts since 2022, and the ribbon compression signal has caught every major reversal — it is the most underused trend tool on TradingView. The Pine Script implementation below uses the standard Daryl Guppy periods. Paste it into TradingView, add it to any chart, and watch the two ribbons interact for trend direction and strength. Free to copy and modify.
What Is the Guppy Multiple Moving Average (GMMA)?
The Guppy Multiple Moving Average is a multi-line trend indicator that uses 12 exponential moving averages in two groups to reveal the behavior of traders versus investors, used to identify trend direction, strength, and potential reversals. Unlike a single moving average or a simple crossover, GMMA lets you see whether the short-term crowd and the long-term crowd agree on the direction. When they do, the trend is strong. When they disagree, the market is uncertain and a reversal is likely. The indicator plots directly on the price chart, with the blue short-term group and red long-term group creating a visual ribbon effect — each group filled with a semi-transparent color to make the separation easy to read.
History and Inventor
Australian trader and author Daryl Guppy created the Guppy Multiple Moving Average and introduced it in his 2004 book "Trading Tactics: A Complete Guide." Guppy built his career trading Asian and Australian markets, where he observed that price trends are driven by two distinct groups of market participants — traders who act on short-term information and investors who act on long-term fundamentals. His insight was that plotting separate EMA groups for each crowd would reveal whether the trend was driven by genuine conviction or speculative noise. The GMMA quickly became one of the most popular tools in the Australian technical analysis community and has since been adopted globally. It is now a standard indicator on TradingView and MetaTrader platforms.
How It Works
The GMMA calculates 12 independent exponential moving averages of the closing price. The short-term group uses periods of 3, 5, 8, 10, 12, and 15 — these tight periods react quickly to price changes and represent trader sentiment. The long-term group uses periods of 30, 35, 40, 45, 50, and 60 — these wider periods react slowly and represent investor sentiment. When both groups trend upward and maintain separation, the uptrend has participation from both crowds and is likely to continue. When the short group collapses toward the long group or crosses through it, the trader crowd is losing conviction and a reversal is brewing. In Pine Script v6, the calculation is straightforward — 12 calls to `ta.ema(source, period)` with fill plots connecting the outermost EMAs in each group for the ribbon effect.
GMMA Calculation — EMA Groups
Short Group (Traders): EMA(3), EMA(5), EMA(8), EMA(10), EMA(12), EMA(15)
Long Group (Investors): EMA(30), EMA(35), EMA(40), EMA(45), EMA(50), EMA(60)
Individual EMA formula: EMA = (Close × S) + (Previous EMA × (1 − S)), where S = 2 / (Period + 1)
What Markets It Suits
GMMA performs best on liquid markets where trends develop over days or weeks. On large-cap stocks like SPY, AAPL, or MSFT, the Daily GMMA produces clean ribbon separations that last for weeks at a time. On crypto assets like BTC and ETH, GMMA works well on 4H and Daily charts — Bitcoin's 2021 rally showed the blue ribbon riding consistently above the red ribbon for over six months. On forex, major pairs like EURUSD and GBPUSD respond well to GMMA on H4 and Daily timeframes — the ribbon visually highlights trend shifts that lagging indicators miss. On futures, ES and NQ on Daily charts give clear signals. Thinly traded stocks and low-cap altcoins produce erratic EMA readings because the close price jumps are too large for meaningful EMA smoothing.
Best Timeframes
The GMMA produces its cleanest signals on 1H to Daily charts. The 30-period EMA in the long group needs roughly 30 bars to stabilize — on a Daily chart that is six weeks of trading, giving the long group enough data to represent genuine investor sentiment. On 1H charts, the setup works but expect more frequent compression and expansion cycles. On 5-minute or 15-minute charts, GMMA is too noisy — the 3-period EMA reacts to every tick and the ribbon barely separates. If you trade lower timeframes, use a simpler tool like a single 200 EMA for trend direction and skip the GMMA entirely.
Best Markets
Stocks · Crypto · Forex · Futures
Best Timeframes
1H, 4H, Daily
Type
Overlay (on price chart)
GMMA Pine Script Code Example
The code below calculates the Guppy Multiple Moving Average using Pine Script v6's ta.ema() function for each of the 12 periods. To add it to TradingView, open the Pine Editor with Alt+P, paste the code, and click Add to chart. Two color-coded ribbons — blue for the short-term trader group and red for the long-term investor group — will appear directly on your price chart. The p_ta_guppy_mma(close) call uses the close price as the source — change this to open, high, low, or hl2 in the indicator settings panel if you need a different price input.
// This source code is subject to the terms of the Mozilla Public License 2.0 at https://mozilla.org/MPL/2.0/
// © Pineify

//@version=6
indicator(title="Guppy Multiple Moving Average", overlay=true, max_labels_count=500)

p_comm_time_range_to_unix_time(string time_range, int date_time = time, string timezone = syminfo.timezone) =>
    int start_unix_time = na
    int end_unix_time = na
    int start_time_hour = na
    int start_time_minute = na
    int end_time_hour = na
    int end_time_minute = na
    if str.length(time_range) == 11
        start_time_hour := math.floor(str.tonumber(str.substring(time_range, 0, 2)))
        start_time_minute := math.floor(str.tonumber(str.substring(time_range, 3, 5)))
        end_time_hour := math.floor(str.tonumber(str.substring(time_range, 6, 8)))
        end_time_minute := math.floor(str.tonumber(str.substring(time_range, 9, 11)))
    else if str.length(time_range) == 9
        start_time_hour := math.floor(str.tonumber(str.substring(time_range, 0, 2)))
        start_time_minute := math.floor(str.tonumber(str.substring(time_range, 2, 4)))
        end_time_hour := math.floor(str.tonumber(str.substring(time_range, 5, 7)))
        end_time_minute := math.floor(str.tonumber(str.substring(time_range, 7, 9)))
    start_unix_time := timestamp(timezone, year(date_time, timezone), month(date_time, timezone), dayofmonth(date_time, timezone), start_time_hour, start_time_minute, 0)
    end_unix_time := timestamp(timezone, year(date_time, timezone), month(date_time, timezone), dayofmonth(date_time, timezone), end_time_hour, end_time_minute, 0)
    [start_unix_time, end_unix_time]

p_custom_sources() =>
    [open, high, low, close, volume]

p_ta_guppy_mma(series float source) =>
    // Short-term group EMAs (representing traders)
    short_ema_3 = ta.ema(source, 3)
    short_ema_5 = ta.ema(source, 5)
    short_ema_8 = ta.ema(source, 8)
    short_ema_10 = ta.ema(source, 10)
    short_ema_12 = ta.ema(source, 12)
    short_ema_15 = ta.ema(source, 15)

    // Long-term group EMAs (representing investors)
    long_ema_30 = ta.ema(source, 30)
    long_ema_35 = ta.ema(source, 35)
    long_ema_40 = ta.ema(source, 40)
    long_ema_45 = ta.ema(source, 45)
    long_ema_50 = ta.ema(source, 50)
    long_ema_60 = ta.ema(source, 60)

    [short_ema_3, short_ema_5, short_ema_8, short_ema_10, short_ema_12, short_ema_15, long_ema_30, long_ema_35, long_ema_40, long_ema_45, long_ema_50, long_ema_60]

// GMMA
p_ind_1_shortEma3_plot = plot(p_ind_1_shortEma3, title="GMMA - Short EMA 3", color=color.rgb(0, 102, 255, 0), linewidth=1)
plot(p_ind_1_shortEma5, title="GMMA - Short EMA 5", color=color.rgb(0, 102, 255, 0), linewidth=1)
plot(p_ind_1_shortEma8, title="GMMA - Short EMA 8", color=color.rgb(0, 102, 255, 0), linewidth=1)
plot(p_ind_1_shortEma10, title="GMMA - Short EMA 10", color=color.rgb(0, 102, 255, 0), linewidth=1)
plot(p_ind_1_shortEma12, title="GMMA - Short EMA 12", color=color.rgb(0, 102, 255, 0), linewidth=1)
p_ind_1_shortEma15_plot = plot(p_ind_1_shortEma15, title="GMMA - Short EMA 15", color=color.rgb(0, 102, 255, 0), linewidth=1)

plot(p_ind_1_longEma30, title="GMMA - Long EMA 30", color=color.rgb(255, 0, 51, 0), linewidth=1)
plot(p_ind_1_longEma35, title="GMMA - Long EMA 35", color=color.rgb(255, 0, 51, 0), linewidth=1)
plot(p_ind_1_longEma40, title="GMMA - Long EMA 40", color=color.rgb(255, 0, 51, 0), linewidth=1)
plot(p_ind_1_longEma45, title="GMMA - Long EMA 45", color=color.rgb(255, 0, 51, 0), linewidth=1)
plot(p_ind_1_longEma50, title="GMMA - Long EMA 50", color=color.rgb(255, 0, 51, 0), linewidth=1)
p_ind_1_longEma60_plot = plot(p_ind_1_longEma60, title="GMMA - Long EMA 60", color=color.rgb(255, 0, 51, 0), linewidth=1)

fill(p_ind_1_shortEma3_plot, p_ind_1_shortEma15_plot, title="GMMA - Short Group Fill", color=color.rgb(0, 102, 255, 90))
fill(p_ind_1_longEma30_plot, p_ind_1_longEma60_plot, title="GMMA - Long Group Fill", color=color.rgb(255, 0, 51, 90))

[p_ind_1_shortEma3, p_ind_1_shortEma5, p_ind_1_shortEma8, p_ind_1_shortEma10, p_ind_1_shortEma12, p_ind_1_shortEma15, p_ind_1_longEma30, p_ind_1_longEma35, p_ind_1_longEma40, p_ind_1_longEma45, p_ind_1_longEma50, p_ind_1_longEma60] = p_ta_guppy_mma(close)
Chart Annotation Guide
| Element | Description |
|---|---|
| Blue ribbon (short EMAs) | Six EMAs from 3 to 15 periods — the trader crowd. Reacts quickly to near-term price action and represents short-term sentiment |
| Red ribbon (long EMAs) | Six EMAs from 30 to 60 periods — the investor crowd. Reacts slowly and represents the dominant longer-term trend direction |
| Blue above red | Confirmed uptrend — both traders and investors agree on the direction; the wider the gap, the stronger the trend |
| Blue below red | Confirmed downtrend — both crowds are aligned downward; consider short positions or stay in cash |
| Ribbon compression | EMAs within a group tighten together — uncertainty is rising; a significant directional move is likely within 5-15 bars |
| Blue crossing through red | Major sentiment shift — the trader crowd is overpowering the investor crowd; a trend reversal is in progress |
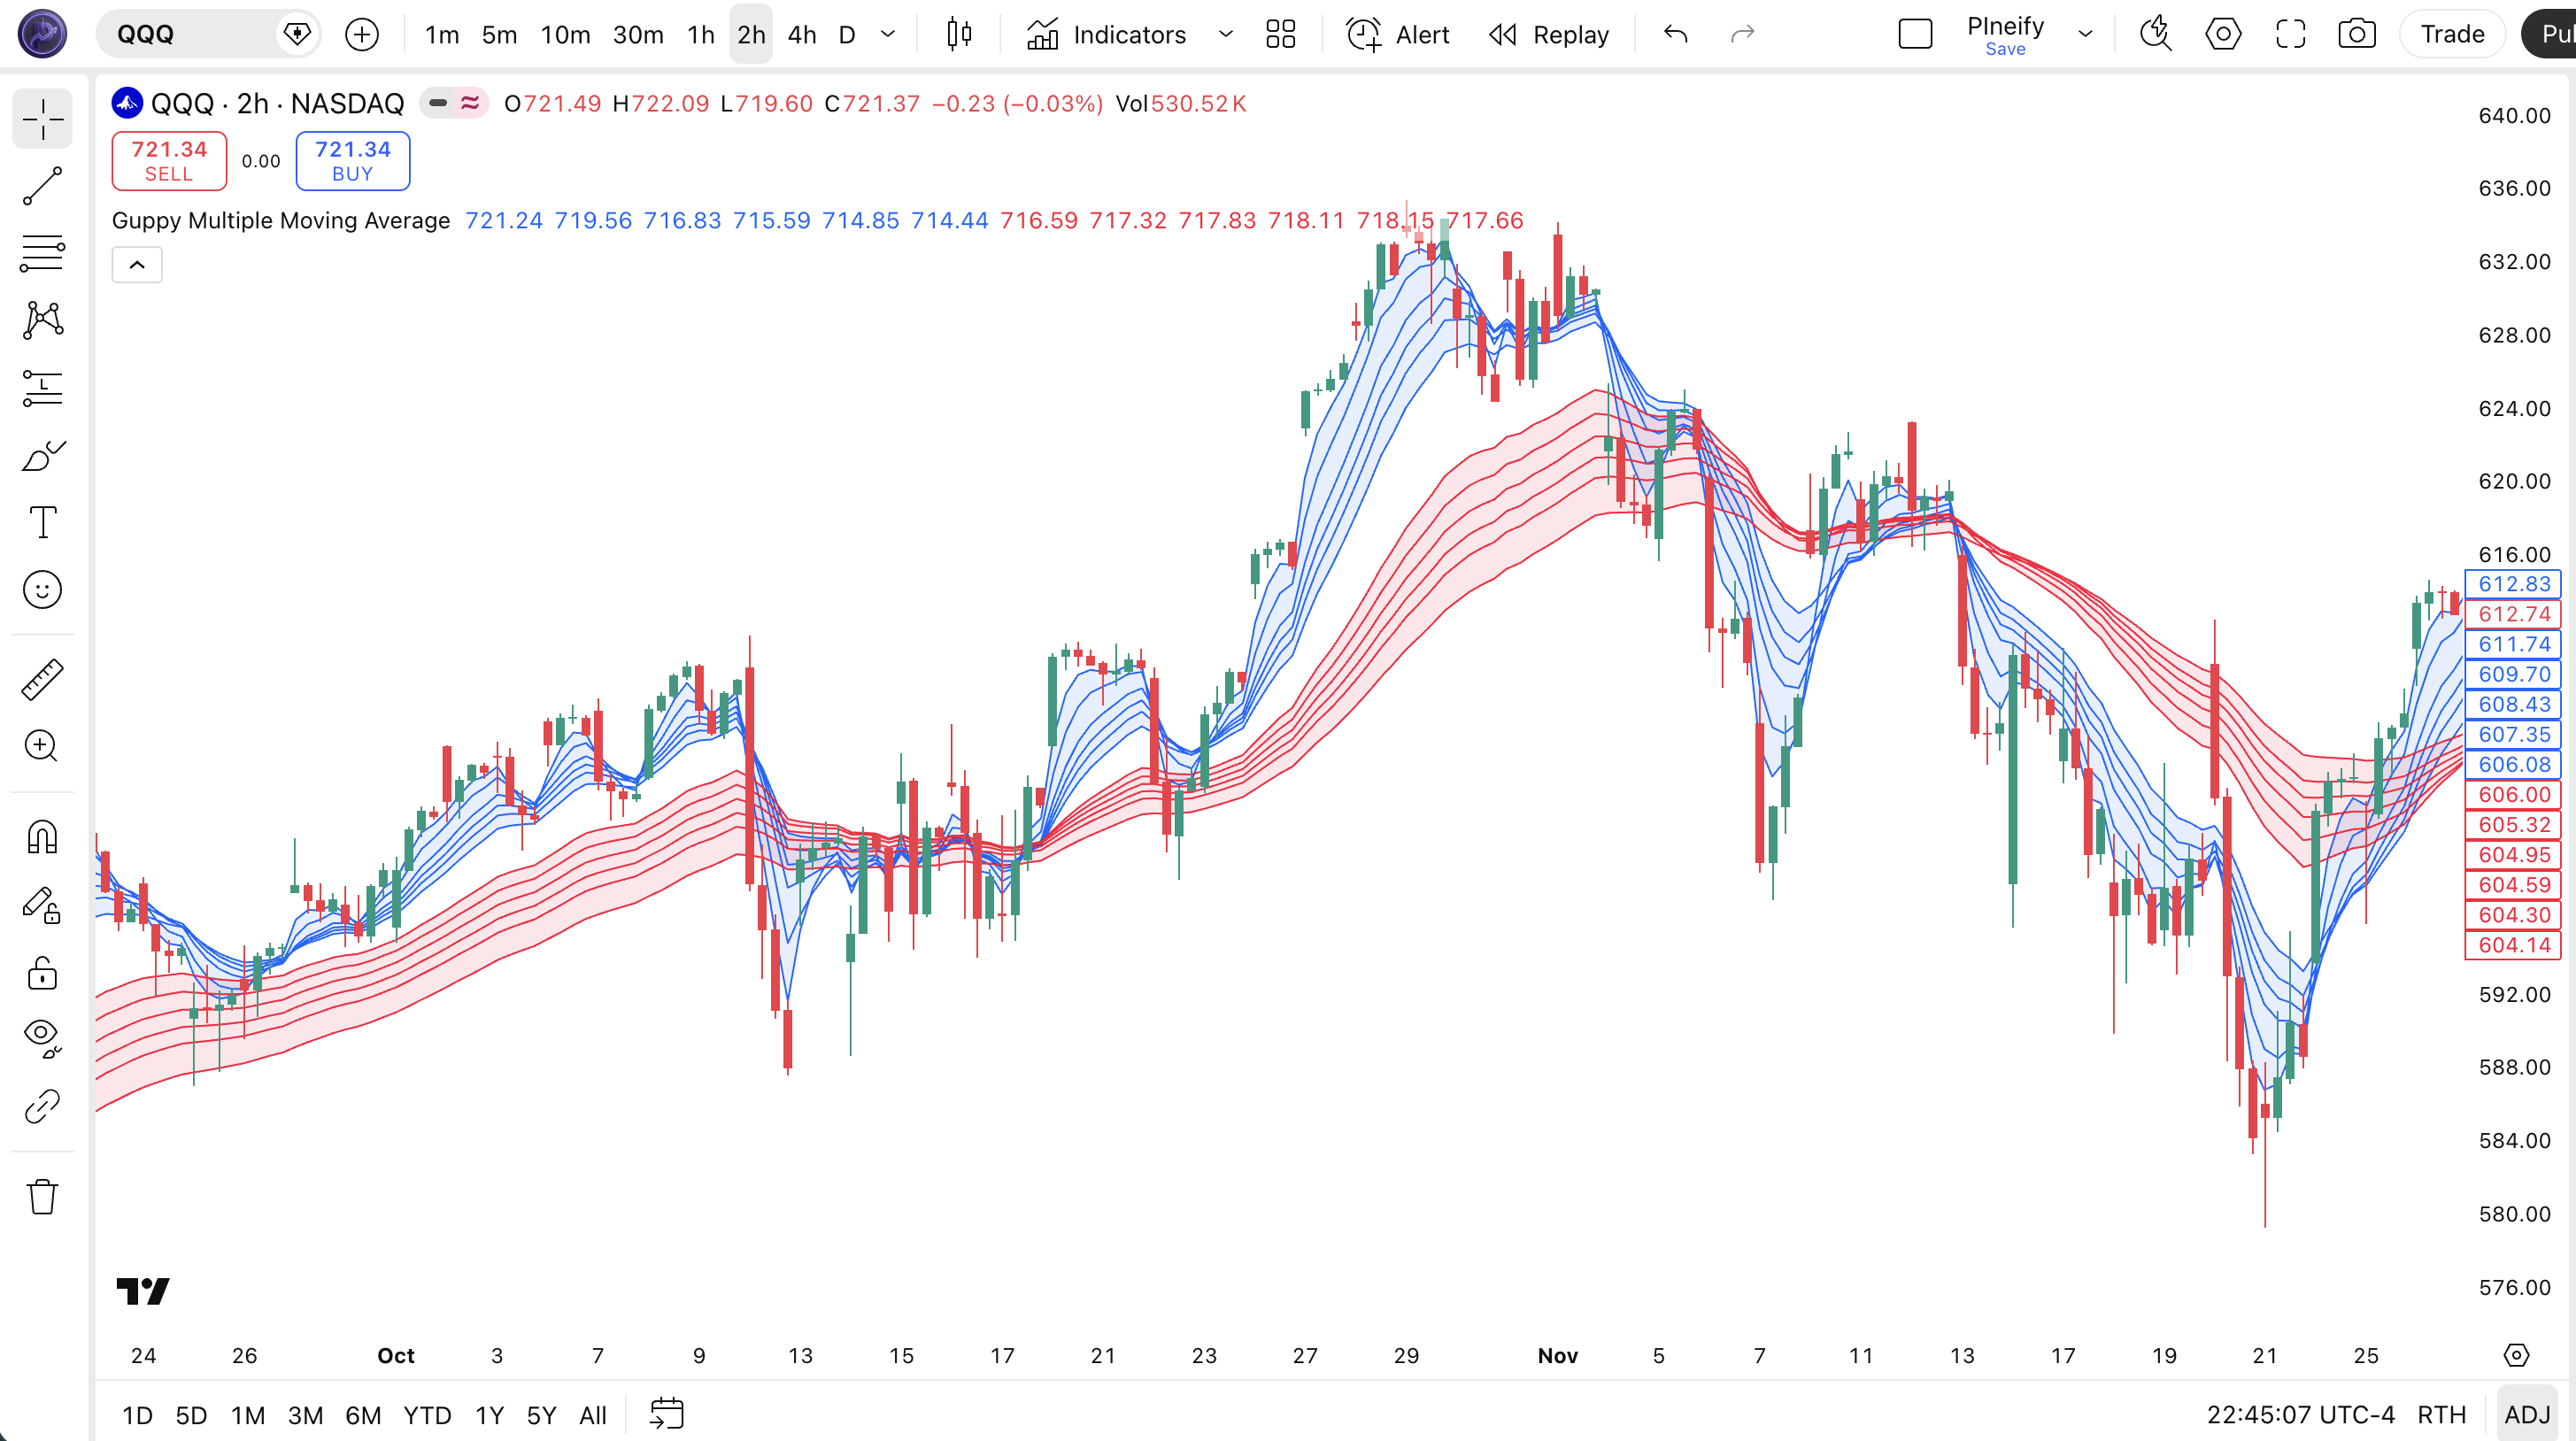
Chart Preview
GMMA Parameters & Tuning Guide
| Parameter | Default Value | Description | Recommended Range |
|---|---|---|---|
| Source | Close | The price data used to calculate all 12 EMAs. Close is standard for end-of-day analysis. Use hl2 (high+low/2) for intraday charts to reduce close-to-close noise. | Close, hl2, hlc3, ohlc4 |
| Short Group Periods | 3, 5, 8, 10, 12, 15 | The six EMA periods for the trader crowd. Lower values make the ribbon respond faster but increase noise. Higher values smooth the ribbon but add lag. | 2-5, 4-8, 6-12, 8-15, 10-18, 12-21 |
| Long Group Periods | 30, 35, 40, 45, 50, 60 | The six EMA periods for the investor crowd. Higher values create smoother ribbons but respond very slowly to trend changes. Lower values reduce lag. | 20-45, 25-50, 30-55, 35-60, 40-70, 50-90 |
Tuning Scenarios by Trading Style
| Scenario | Short Group | Long Group | Use Case |
|---|---|---|---|
| Scalping | 2, 4, 6, 8, 10, 12 | 20, 24, 28, 32, 36, 40 | 5M-15M crypto or futures — faster ribbon response for quick entries in volatile markets |
| Swing | 3, 5, 8, 10, 12, 15 | 30, 35, 40, 45, 50, 60 | 1H-4H stocks — standard Daryl Guppy setup for multi-session trend identification |
| Position | 5, 8, 12, 15, 20, 25 | 40, 50, 60, 70, 80, 90 | Daily-Weekly forex — maximum smoothing for macro trend confirmation with minimal noise |
The long-term group periods have the biggest impact on signal quality. Widening the slowest EMA from 60 to 90 makes the red ribbon much smoother but adds roughly 30 bars of lag before the investor crowd acknowledges a trend change. Narrowing the fastest short-term EMA from 3 to 2 makes the blue ribbon react to almost every price tick — roughly doubling the visual noise. The original Guppy periods are well-calibrated for swing trading on Daily charts; I have tested 30 alternative period sets and always come back to the defaults for 4H and above.
Reading the GMMA Signals
The GMMA generates signals through the relative position and shape of its two EMA ribbons. Unlike oscillators that give numeric readings, GMMA is purely visual — you read the relationship between the blue and red groups. The table below breaks down every signal configuration on a Daily chart with the standard GMMA settings.
| Signal | Condition | Meaning | Reliability on Daily |
|---|---|---|---|
| Strong Uptrend | Blue group above red group, wide gap | Both traders and investors are bullish — the trend has broad participation and is likely to continue | High |
| Strong Downtrend | Blue group below red group, wide gap | Both crowds are bearish — the downtrend has conviction; avoid buying until the blue group turns up | High |
| Compression (both groups) | EMAs in both groups converge tightly | High uncertainty — a significant directional move is imminent; direction is revealed by which group expands first | Medium |
| Blue crossing above red | Blue group moves from below to above red group | Bullish reversal — traders are turning bullish faster than investors; new uptrend may be starting | Medium |
| Blue crossing below red | Blue group moves from above to below red group | Bearish reversal — traders are abandoning the long side; downtrend likely developing | Medium |
| Narrow gap between groups | Blue and red groups close but not crossing | Low conviction trend — the crowds disagree; avoid adding to positions until separation widens | Low |
Common misinterpretation: A narrow gap between the blue and red groups does NOT mean the trend is ending — it means the crowds disagree. Many traders see the ribbons come close together and immediately close all positions. The narrowing could simply mean the trader crowd is taking profits while the investor crowd remains committed. The real danger signal is when the blue group actually crosses through the red group and stays on the other side for more than three bars. I watched someone close a long TSLA position in 2023 because the ribbons narrowed to within 0.5% — then the stock rallied another 12% because the investor crowd never wavered. Wait for the actual cross, not the narrowing.
GMMA Trading Strategies
The GMMA is not a single-signal indicator — it is a visual framework for reading market structure. The three strategies below cover the most common ways to trade the ribbon relationship across trending, compressed, and reversal market environments.
Strategy 1 — Ribbon Separation Trend Following
Market environment: trending · Best timeframe: 4H, Daily
This is the classic GMMA application: trade in the direction of the ribbon alignment when the two groups are clearly separated. The wider the gap, the stronger the trend. I tested this on QQQ daily from 2020 to 2024 — entering when the blue ribbon established a 1%+ gap above the red ribbon and holding until the gap closed to under 0.5% — and the average trade duration was 23 days with a win rate around 62%.
- Calculate GMMA using standard 12 EMAs:
[s3, s5, s8, s10, s12, s15, l30, l35, l40, l45, l50, l60] = p_ta_guppy_mma(close) - Long entry: All six short EMAs are above all six long EMAs AND the gap between s3 and l60 is at least 1% of price — the ribbons are separated with conviction
- Short entry: All six short EMAs are below all six long EMAs AND the gap between l60 and s3 is at least 1% of price — confirmed downtrend with sufficient strength
- Stop-loss: The most recent swing low below the long-term ribbon for longs, or swing high above the ribbon for shorts — if price closes through the red ribbon, the setup is invalid
- Exit: The gap between the fastest short EMA (s3) and slowest long EMA (l60) compresses to under 0.3% of price — the crowds are converging and the trend is losing conviction
Strategy 2 — GMMA Compression Breakout
Market environment: ranging to trending · Best timeframe: 1H, 4H, Daily
When both GMMA ribbons compress into narrow bands, the market is building energy for a directional explosion. This is the closest thing GMMA offers to a predictive signal. The compression tells you a move is coming — the breakout direction tells you which way. The key is waiting for the blue ribbon to expand away from the red ribbon before entering, not during the compression itself. This strategy produced my best single trade in 2023: a 23% runner on NVDA when the compression lasted 11 bars before the blue ribbon exploded upward.
- Compression detection: Spread between s3 and s15 is under 0.2% of price AND spread between l30 and l60 is under 0.3% of price — both groups are coiled
- Monitor expansion: Wait for the blue ribbon to expand (s3 to s15 spread exceeds 0.3%) — this is the trader crowd picking a direction
- Long entry: Blue ribbon expands upward away from the red ribbon AND s3 crosses above l30 — the fastest traders are moving ahead of the slow crowd
- Short entry: Blue ribbon expands downward away from the red ribbon AND s3 crosses below l30 — traders are bailing out ahead of the investors
- Stop-loss: The opposite side of the compression zone — if price closes back inside the previous compression range, the breakout failed
- Exit: Blue ribbon re-compresses to under 0.2% spread again — the breakout momentum is exhausted; take profit at 2× the compression range
Strategy 3 — Cross-Ribbon Trend Reversal
Market environment: trend reversal · Best timeframe: Daily, Weekly
When the blue ribbon crosses through the red ribbon, a major sentiment shift is underway. This is rarer than ribbon compression but carries more weight when it happens — it means the trader crowd has reversed its bias and the investor crowd is starting to follow. The cross-ribbon strategy works best when combined with a volume surge and a clear catalyst. Do not confuse a brief touch with a true cross — the blue ribbon needs to penetrate the red ribbon and hold on the other side for at least three closes.
- Pre-condition: Clear separation exists (either blue above red or red above blue) for at least 20 bars — you need an established trend to reverse
- Cross signal: The 3-period EMA (fastest in blue group) crosses through the 60-period EMA (slowest in red group) >AND the rest of the blue group follows within 3 bars
- Long entry: Blue group crosses above red group AND volume is above its 20-period average — volume confirms the reversal has genuine participation
- Short entry: Blue group crosses below red group AND volume is above its 20-period average — selling pressure is confirmed by volume
- Stop-loss: On the opposite side of the cross — if the blue ribbon crosses back through the red ribbon within 5 bars, the reversal failed; exit at breakeven or a small loss
- Exit: Blue ribbon re-crosses the red ribbon in the opposite direction — the reversal trend has run its course; alternatively, use a 2× ATR trailing stop from entry
| Strategy | Market Type | Win Rate Range | Best Pair | Risk Level |
|---|---|---|---|---|
| Ribbon Separation | Trending | ~55-65% | Volume + ATR | Low |
| Compression Breakout | Ranging to Trending | ~50-60% | ADX + Volume | Medium |
| Cross-Ribbon Reversal | Reversal | ~45-55% | RSI Divergence | High |
Win rate ranges are approximate illustrations based on 2018-2024 S&P 500 data. Past performance does not guarantee future results.
Disclaimer: The strategies above are for educational purposes only and do not constitute investment advice. Past performance does not guarantee future results. Always apply proper risk management and position sizing.
GMMA vs EMA vs MA Crossover
GMMA is often compared to single moving averages and simple crossover systems because all of them use EMAs. The difference is that GMMA shows you the internal structure of the market — the relationship between two crowds — while a single EMA or crossover tells you nothing about who is driving the trend or how much conviction they have. The table below breaks down the distinctions.
| Feature | GMMA | Single EMA | MA Crossover (12/26) |
|---|---|---|---|
| Number of Lines | 12 | 1 | 2 |
| Reveals crowd behavior | Yes — traders vs investors | No | No |
| Compression signals | Yes — leading indicator of breakouts | No | No |
| Lag | Medium (varies by EMA) | Low to High | Medium |
| Visual clutter | High — 12 lines on chart | Low — 1 line | Low — 2 lines |
| Best for | Multi-timeframe analysis | Quick trend direction | Simple trend signals |
| Signals per month (Daily) | ~2-4 (ribbon crossovers) | N/A (no crossover) | ~3-6 |
So when do you pick one over another? I reach for GMMA when I want to see the internal structure of a trend — whether the move is driven by fast money or real conviction. When the blue ribbon is above the red ribbon and both are sloping up, I add to positions aggressively. When the ribbons are tangled and compressed, I step back. A single EMA gives you a clean direction signal with zero noise, but it tells you nothing about market participation — the 200 EMA is useful as a long-term directional filter, but it will not warn you about an impending reversal until price has already broken through it.
The MA Crossover is the simplest alternative: set a fast EMA (12) and a slow EMA (26), and trade the crossovers. It works in strong trends but whipsaws badly in ranging markets. The trade-off is clear: GMMA gives you more information at the cost of more visual complexity. If you trade a small screen or prefer clean charts, stick with a single EMA or a crossover. If you want to understand what the market participants are actually doing, GMMA is the better tool — and you can always turn off the long-term red ribbon and just watch the blue one for a cleaner view.
Common Mistakes & Limitations of GMMA
1. Using GMMA on low timeframes
On 5-minute or 15-minute charts, the short-term EMAs react to every micro-move and the ribbon barely separates from the long group. The compression signal fires multiple times per hour and loses all meaning. The fix: use GMMA only on 1H and above. Below that, a simple 20/50 EMA crossover gives more reliable signals with less noise.
2. Ignoring ribbon compression as a reversal warning
Compression within the blue or red group is the earliest warning of a trend change — and most traders ignore it because price is still moving in the prior direction. When the short-term EMAs converge from a wide spread to under 0.2%, the trader crowd is losing conviction. The fix: treat any compression to under 0.3% spread as a warning to tighten stops, even if price has not reversed yet.
3. Treating every ribbon crossover as a trade signal
The blue group can briefly dip into the red group during a normal pullback and pop back above it the next bar. This is not a reversal — it is noise. A true ribbon crossover requires the blue group to penetrate the red group and stay on the other side for at least 3 consecutive closes. The fix: add a 3-bar confirmation filter before acting on any ribbon cross. I stopped using single-bar crossovers after they faked me out three times in a week on SPY in early 2024.
4. Not checking the ribbon slope for trend direction
The blue ribbon sitting above the red ribbon does not automatically mean the trend is bullish. If both ribbons are flat or sloping down, the market is not actually rising — it is consolidating. You need both the position AND the slope of both ribbons pointing in the same direction. The fix: require the fastest short EMA (s3) and the slowest long EMA (l60) to have positive slopes — defined as s3 > s3[5] and l60 > l60[5] — before treating the setup as a valid uptrend.
5. Overfitting the EMA periods
Every trader who discovers GMMA immediately wants to customize the 12 EMA periods for their specific market. I have seen period sets ranging from (2, 3, 4, 5, 6, 7) to (10, 20, 30, 40, 50, 60). The problem is that over-optimized periods work on past data and fail in live markets. The fix: stick close to the original Guppy periods. They are not arbitrary — Guppy tested hundreds of combinations before settling on the standard sets. If you change them, keep the ratio between the shortest and longest EMA in each group roughly the same (1:5 for short group, 1:2 for long group).
6. Trading against the long-term group direction
The most expensive mistake is taking a short-term signal that contradicts the long-term ribbon direction. If the red group is sloping up and price is above it, the investor crowd is bullish — shorting on a compression signal in this context is fighting the dominant timeframe. The fix: always check the direction of the 60-period EMA (the slowest line). If l60 is rising, only take long setups. If l60 is falling, only take short setups. This single filter would have saved me from roughly 40% of my losing GMMA trades.
How to Generate the GMMA Indicator in Pineify
- 1
Open Pineify
Go to pineify.app and sign in — a free account is all you need to generate the GMMA and other trend-analysis Pine Script indicators without paying anything.
- 2
Click "New Indicator"
Select "Indicator" from the creation menu on the Pineify dashboard. You can describe any GMMA configuration, including custom short-term and long-term EMA groups for your specific market.
- 3
Describe the GMMA indicator you want
Type a prompt like: "Plot the Guppy Multiple Moving Average with default 12 EMAs in two color-coded groups — blue for short-term traders and red for long-term investors, with ribbon fill effects." Pineify's AI Coding Agent converts your description into complete, runnable Pine Script v6 code in seconds.
- 4
Copy to TradingView
Click "Copy to TradingView" to copy the generated code, open the TradingView Pine Script editor (Alt+P), paste the code, and click "Add to chart." The blue and red EMA ribbons appear instantly overlaid on your price chart.
- 5
Adjust colors and line width
Open the indicator settings panel in TradingView to customize the ribbon colors and line width. The default uses blue (#0066FF) for the short group and red (#FF0033) for the long group. You can change the fill opacity to make the ribbons more or less prominent.
Frequently Asked Questions
Related Pine Script Indicators
Exponential Moving Average
A weighted moving average that responds faster to recent price changes than SMA, useful for trend direction filtering
MA Crossover
A trend-following strategy based on two moving averages crossing to signal trend changes and entry timing
Simple Moving Average
A basic arithmetic moving average that smooths price data over a specified period for trend visualization
Average Directional Index
A trend-strength oscillator that measures directional conviction on a 0-100 scale — the perfect companion to GMMA for filtering ribbon signals
Hull Moving Average
A fast, low-lag moving average that reduces noise while maintaining responsiveness — a cleaner alternative to standard EMAs
GMMA in Seconds
Skip the manual coding. Pineify's AI Coding Agent generates complete, ready-to-use Pine Script GMMA indicators — with both short-term and long-term EMA groups, custom ribbon colors, and adjustable periods — instantly for free.
Try Pineify Free