

Prime Oscillator Pro
ChartPrime’s current strategies page describes its Prime Oscillators Pro and Pro+ guides, including ribbon, signal, and divergence topics. Verify which version is in your plan before comparing individual features.
Indicator alternative
“ChartPrime oscillator” covers more than one script. Its premium Prime Oscillators Pro family combines several momentum views; public scripts such as RSI Shift Zone have different jobs. Pineify Oscillator Matrix is an adjacent multi-component momentum view, but you should compare the actual reading and signal timing you use.
Parabolic RSI, Prime Oscillator Pro, and RSI Shift Zone are separate search targets. The feature comparison below does not merge their formulas.
Compare the featuresPineify product evidence
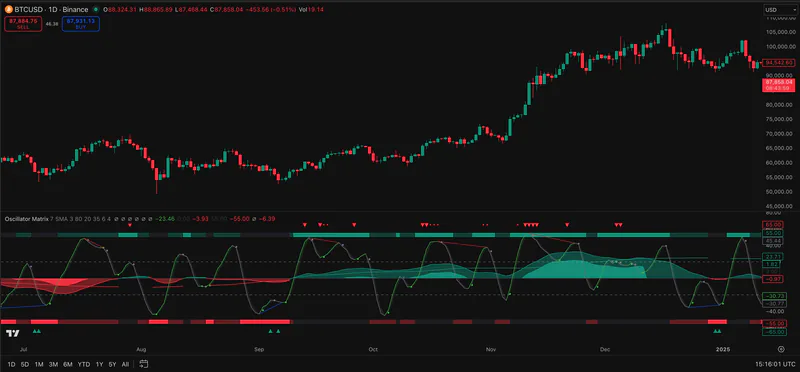
Oscillator Matrix
Public sources checked 2026-09-24.
The details below determine whether the named tool fits the job behind the search.
ChartPrime’s current strategies page describes its Prime Oscillators Pro and Pro+ guides, including ribbon, signal, and divergence topics. Verify which version is in your plan before comparing individual features.
RSI Shift Zone turns RSI threshold crossings into price-chart zones. That is different from a conventional lower-pane oscillator. For Parabolic RSI, inspect the individual author listing and its inputs rather than assuming it belongs to the same premium pack.
Oscillator Matrix groups momentum, money-flow, and reversal readings. Its value is consolidation into one Pineify script, not a claim that it computes ChartPrime’s Prime Oscillator values.
Descriptions are drawn from the linked public sources. Similar categories do not imply matching formulas or performance.
| Question | ChartPrime | Pineify Premium Scripts |
|---|---|---|
| Premium suite | Prime Oscillators Pro family | Oscillator Matrix |
| RSI Shift Zone | RSI crossings projected as chart zones | No identical chart-zone behavior claimed |
| Evaluation | Inspect each tool’s inputs and signals | Test separate momentum components |
Scroll sideways to read the full table.
Related Pineify workflow
Adjacent: a separate momentum toolkit for comparison, not the same ChartPrime formulas.
Check the current script list and access terms on the product page before choosing a plan.
No. The public ChartPrime description says it projects RSI threshold events as zones on the main price chart.
No. Pineify offers its own Oscillator Matrix, with distinct components and settings.
Provider documentation, author-published scripts, and linked review profiles checked 2026-09-24. Features and access can change; confirm current terms with each provider.
This page is for information and education. Indicator output is not investment advice or a guarantee of trading results. Test scripts with your own rules, data, and risk limits.