

Read the original model
ChartPrime describes mirrored buy-side and sell-side profiles, untouched levels, cumulative skew, and point-of-control highlights. The author-published code is the right place to inspect calculations and assumptions.
Indicator alternative
Liquidity Pro Map [ChartPrime] is an open-source TradingView script that models buy-side and sell-side liquidity using candle volume and price dispersion. It does not show an exchange order book. Pineify Smart Money Flow and Support-Resistance Levels can add flow and level context, but neither is an equivalent dual-profile liquidity map.
“Liquidity” on these charts is a model derived from market data. It is not direct observation of every resting order.
Compare the featuresPineify product evidence
Smart Money Flow in Oscillator Matrix
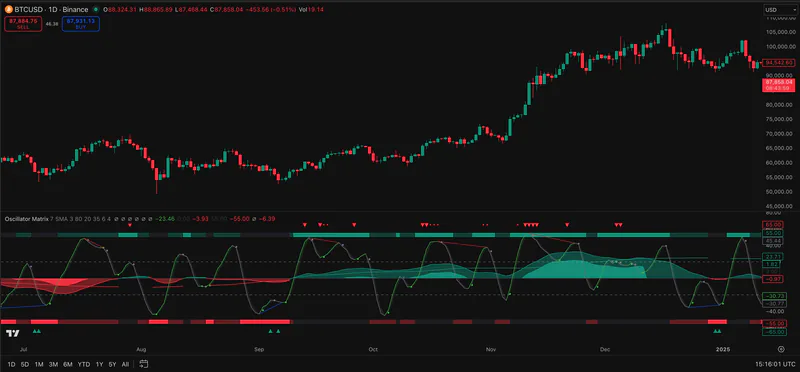
Public sources checked 2026-09-24.
The details below determine whether the named tool fits the job behind the search.
ChartPrime describes mirrored buy-side and sell-side profiles, untouched levels, cumulative skew, and point-of-control highlights. The author-published code is the right place to inspect calculations and assumptions.
A plotted liquidity area is a possible reaction zone, not a promise of a sweep or reversal. Define an invalidation rule and compare historical plots with live bar behavior before using it in a trade plan.
Smart Money Flow offers an activity reading and Support-Resistance Levels plots chart levels. They may complement liquidity analysis but do not create ChartPrime’s mirrored volume profiles.
Descriptions are drawn from the linked public sources. Similar categories do not imply matching formulas or performance.
| Question | ChartPrime | Pineify Premium Scripts |
|---|---|---|
| Model | Dual buy/sell volume profiles and untouched levels | Flow reading plus separate level script |
| Order book | Not an order-book feed | No order-book map claimed |
| Source | Public open-source script | Separate script source supplied |
Scroll sideways to read the full table.
Related Pineify workflow
Adjacent: combine a flow reading with levels, without claiming a liquidity-map replica.
Check the current script list and access terms on the product page before choosing a plan.
Yes. Its author-published TradingView listing is marked open source.
No. The described profiles are derived from candle data; they are a model of possible liquidity concentrations.
Provider documentation, author-published scripts, and linked review profiles checked 2026-09-24. Features and access can change; confirm current terms with each provider.
This page is for information and education. Indicator output is not investment advice or a guarantee of trading results. Test scripts with your own rules, data, and risk limits.