

Pivot levels
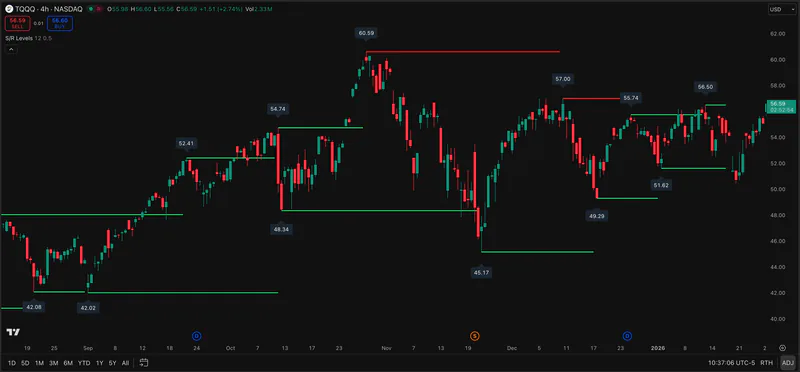
BigBeluga’s Pivot Levels documentation describes multiple configurable pivot layers and support/resistance coloring. It suits a user who wants to see short and long swing reference points together.
Provider comparison
BigBeluga and ChartPrime both publish open-source TradingView indicators, so source visibility is not a reliable brand-wide dividing line. BigBeluga’s Pivot Levels maps several pivot sensitivities; ChartPrime’s High Volume Boxes adds a volume filter to pivot-derived zones. Choose the specific script whose method matches your chart task.
This compares cited public scripts, not every product, subscription, or performance claim from either author.
Compare the featuresPineify product evidence
Support-Resistance Levels
Public sources checked 2026-09-24.
The details below determine whether the named tool fits the job behind the search.
BigBeluga’s Pivot Levels documentation describes multiple configurable pivot layers and support/resistance coloring. It suits a user who wants to see short and long swing reference points together.
ChartPrime’s High Volume Boxes description includes pivot detection, delta-volume filtering, hold markers, and break labels. That is a different selection and display method from layered pivot lines.
Pineify Support-Resistance Levels and its other Premium Scripts offer another level-and-trend workflow with source access. The collection is relevant if you want to compare several Pineify tools; it does not replace either author’s exact code.
Descriptions are drawn from the linked public sources. Similar categories do not imply matching formulas or performance.
| Question | BigBeluga | ChartPrime |
|---|---|---|
| Example script | BigBeluga Pivot Levels: multiple pivot layers | ChartPrime High Volume Boxes: pivots with volume filter |
| Display | Lines and labels for pivot levels | Boxes plus hold and break markers |
| Public code | Cited BigBeluga script is open source | Cited ChartPrime script is open source |
Scroll sideways to read the full table.
Related Pineify workflow
Adjacent third option: inspect Pineify’s separate levels and trend scripts if the two public examples do not fit.
Check the current script list and access terms on the product page before choosing a plan.
The two public scripts compared here are both marked open source on TradingView. That does not describe every script or paid product from either author.
No. The cited descriptions use different selection and display methods: layered pivots versus volume-filtered boxes.
Provider documentation, author-published scripts, and linked review profiles checked 2026-09-24. Features and access can change; confirm current terms with each provider.
This page is for information and education. Indicator output is not investment advice or a guarantee of trading results. Test scripts with your own rules, data, and risk limits.