TradingView fixed-income workflows

Yield curves on TradingView: tenor spreads and data alignment

Use TradingView Yield Curves to compare government bond yields across maturities on a selected date. Start with one country, a stated yield definition and matching observation dates. A curve plots maturity against yield; a 10-year minus 2-year spread chart plots one difference through time. Neither is a bond price chart or a total-return series. Check missing values and publication times before turning a curve observation into a research rule.

See the decision guide

Open the native curve and fix the comparison date

Open TradingView Yield Curves from the product menu or the Supercharts right-side panel. The standalone tool is also available at tradingview.com/yield-curves/. It supports country comparisons and historical curve overlays. Begin with the United States so that differences across issuers and currencies do not obscure the maturity comparison.

  • Use Key tenors to focus on benchmark maturities. Keep 3M, 2Y, 5Y, 10Y and 30Y in the research record; 3M means three months, while 3Y means three years.
  • Select a fixed date in the Specific tab of the date menu. Relative dates such as one month ago move with the current day, so record the resolved date when saving a result.
  • Read the table beneath the curve to inspect values. Clone the curve and choose a second fixed date to compare changes; keep the issuer and maturity set unchanged.
  • Take a snapshot after noting the date, series definitions and any gaps. The chart uses maturity on its horizontal axis. A normal Superchart uses time, so an overlay of several yield histories is a different view.
Choose the data definition before choosing the slope

A label such as US 10Y does not make every source interchangeable. TradingView identifies TVC government-bond data as supplied by Refinitiv. The U.S. Treasury publishes a fitted par yield curve, while FRED DGS10 identifies a daily 10-year constant-maturity series in percent from the Federal Reserve H.15 release. Verify the selected symbol metadata and source rather than treating these as identical live quotes.

  • For an official daily curve study, take all selected tenors from the same Treasury table row. Record the curve type, date and units before comparing it with TradingView.
  • For a TradingView market-data study, use consistently defined symbols and a documented observation schedule. A different result from Treasury can reflect source, instrument or time differences rather than an arithmetic error.
Research inputMeaning to preserveMismatch to reject
Treasury nominal par curveFitted yields at stated maturities for one observation dateMixing one nominal tenor with a real TIPS yield
TVC:US10Y and TVC:US02YTradingView government-bond yield series; inspect source and timestampsAssuming their intraday values equal an official daily constant-maturity release
A specific bond priceA market price for an identified security with coupon and maturitySubtracting that price from a yield quoted in percent
Bond or fund total returnPrice change plus investment income over a holding periodReading a rise in a yield series as a positive holding-period return

Work a same-date curve and two tenor spreads

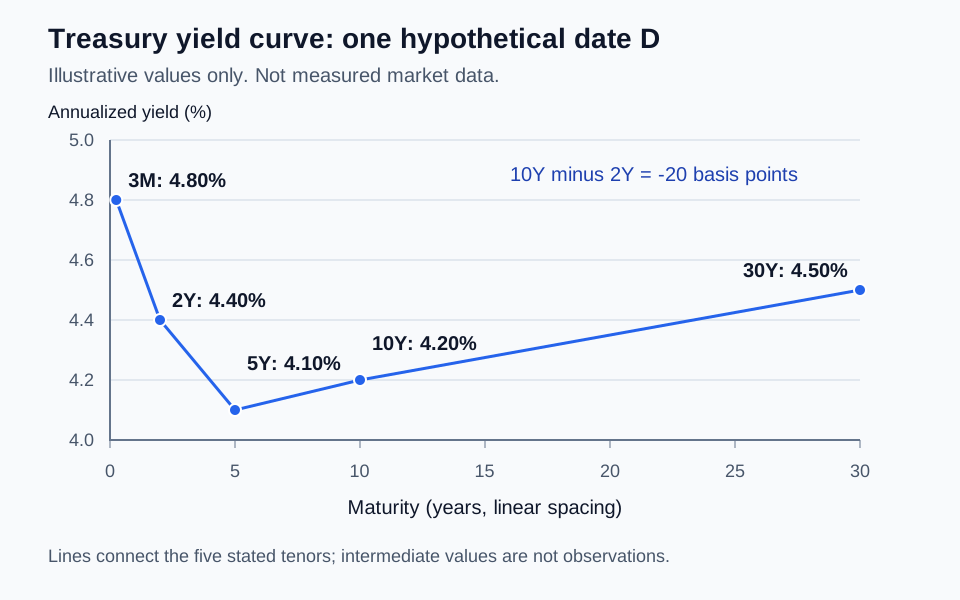
The following invented snapshot uses nominal annualized yields in percent, all observed on the same hypothetical date D from one source. Plot the maturity in years on the horizontal axis and the yield on the vertical axis. A line connecting the points is a visual interpolation, not an observed quote for every maturity between them.

Hypothetical Treasury curve on date D, with true maturity spacing: 3 months 4.80%, 2 years 4.40%, 5 years 4.10%, 10 years 4.20%, and 30 years 4.50%.
Illustrative same-date curve, not measured market data. The horizontal axis uses actual year distances. The table below gives every plotted value. View original source
  • 10Y minus 2Y = 4.20 - 4.40 = -0.20 percentage points = -20 basis points. That segment is inverted.
  • 10Y minus 3M = 4.20 - 4.80 = -0.60 percentage points = -60 basis points. The two spreads describe different segments and need not cross zero together.
  • 30Y minus 10Y = 4.50 - 4.20 = +0.30 percentage points = +30 basis points. The long end slopes upward even though shorter segments slope downward.
  • If the next accepted date has 2Y = 4.10% and 10Y = 4.15%, the 10Y minus 2Y spread is +5 basis points. It steepened by 25 basis points although both yields fell.
  • With decimal yields such as 0.042 and 0.044, multiply the difference by 10,000 instead of 100. Equal yields give zero spread; negative yields still permit subtraction. A percentage ratio is a poor substitute when the denominator is near zero.
TenorMaturity in yearsYield on date D
3 months0.254.80%
2 years24.40%
5 years54.10%
10 years104.20%
30 years304.50%

Chart the spread without confusing it with the full curve

In Supercharts Symbol Search, enter TVC:US10Y - TVC:US02Y to inspect a two-tenor yield difference through time. Use yield values, not a normalized percentage-performance scale. With inputs displayed as 4.20 and 4.40, the expression is -0.20 percentage points; multiplying the expression by 100 gives -20 basis points. Check the underlying symbols at the same intended observation time.

  • Start with daily observations for a daily research question. A daily bar on an intraday market feed and a daily published statistical observation have different availability rules.
  • Inspect each underlying value when the spread crosses zero. Matching chart dates do not establish that both quotes updated together.
  • Keep the subtraction order in the chart name and journal. Reversing the order reverses the sign. This spread shows only the 2Y-to-10Y segment, not the five-point curve above.
  • Use a yield-level change for rate movements. A yield rising from 4% to 5% rose 100 basis points, or 25% relative to its starting yield; neither number is the return earned by a bondholder.

Keep missing dates and publication lag visible

Treasury derives its curve from indicative bid-side quotations near 3:30 PM each trading day and says the rates are usually available by 6:00 PM Eastern Time, with possible delays. Those are observation and publication times for that source, not a refresh guarantee for TradingView or FRED. Preserve both the observation date and the time the value became available to your workflow.

  • A prior curve can remain a labeled historical reference during a weekend, holiday or outage. Do not relabel it as a new observation or turn repeated values into extra independent samples.
  • If a chart visually connects two valid dates, keep the missing interval in the accompanying data record. An interpolated or carried-forward value is not a measurement.
  • For historical rule testing, preserve release timing and data vintages where available. FRED marks data as subject to revision; a later download may differ from what an observer could see then.
Hypothetical recordTempting calculationAccepted treatment
D: 2Y = 4.40%; 10Y = 4.20%-20 basis pointsAccept after both values are available under the chosen schedule.
D+1: 2Y missing; 10Y = 4.30%Reuse 4.40% and report -10 basis pointsMark the spread unavailable. The mixed-date difference is not a D+1 observation.
D+2: 2Y = 4.25%; 10Y = 4.35%+10 basis pointsAccept the level. The gap prevents assigning the crossing to a specific missing day.
Decision at 2:00 PM on D; D curve published laterUse the completed D curve in the decisionUse the latest previously available curve, labeled with its actual date, or skip.

Separate yield observations from realized returns

A yield describes an interest-rate or valuation measure. A bond price is the amount paid for a security. Holding-period total return includes price change and income received, with reinvestment and costs handled under a stated convention. A curve inversion does not specify a bond position, its duration, its financing cost or its eventual return.

  • Hypothetical one-year holding: buy at a dirty price of 100, receive coupons totaling 4, and sell at a dirty price of 98. With no reinvestment, fees or tax, return = (98 - 100 + 4) / 100 = 2%. Dirty prices include accrued interest, avoiding an omitted accrual adjustment.
  • The same coupons with a sale price of 94 give (94 - 100 + 4) / 100 = -2%. A positive coupon and a quoted yield do not prevent a holding-period loss.
  • A slope threshold can be a recorded macro observation. Any claim about subsequent asset returns needs a separate test using only information available before the outcome.

Turn an observable rule into a monitor and journal entry

Write the research rule before looking at later returns: observe the selected 10Y and 2Y yields on the same accepted date, calculate their difference in basis points, and flag a change from nonnegative to negative only when both the current and preceding scheduled observations are valid. Suppress the crossing after a gap until the required sequence is available. This is a monitoring specification, not a bond trade recommendation.

  • Ask Pineify's Pine Script AI Coding Agent to draft a chart aid from the exact symbols, units, schedule and missing-data policy. Review the generated requests and compare values with the source. A confirmed chart bar alone cannot prove an economic release was available at the decision time.
  • Use Trading Journal diary notes for the hypothesis, observation date, availability time, tenor values, spread, source and a link to the saved chart snapshot. Add the later review as a separate dated note.
  • Record unavailable observations as unavailable. Do not backfill a later value into an earlier decision or label a past inversion using an outcome that had not happened yet.
Where Pineify fits

Pine Script AI Coding Agent

Draft an editable yield-spread monitor from explicit symbols and data rules. Check its output and alert timing in TradingView against the underlying observations.

Also useful: Trading Journal. Keep dated curve hypotheses, source values and screenshot links in diary notes, then record the later review separately.

Draft a yield-spread monitor

Frequently asked questions

Educational information, not investment advice or a recommendation to buy or sell bonds. All numerical curve, missing-data and holding-period examples are hypothetical. Curve shapes and alerts do not guarantee market direction or returns.

Sources and verification

Published by Pineify. Pineify is an independent product and is not affiliated with TradingView. Sources support the technical explanations; examples do not establish trading performance.