TradingView chart workflows

TradingView volume candles: width encoding and comparison limits

TradingView Volume candles retain open, high, low, and close prices while using candle width to convey volume during each bar. Greater volume produces a wider candle. Width does not measure elapsed time or identify buyer-initiated and seller-initiated trades. Compare the numeric volume and timestamps before treating a visually prominent candle as a trading condition.

See the decision guide

The same five bars, with and without volume widths

Both panels use the invented OHLCV observations in the table below. Every bar covers five minutes. Equal center spacing is an illustration choice. The second panel changes body widths only, so bar D draws more attention despite closing exactly where it opened.
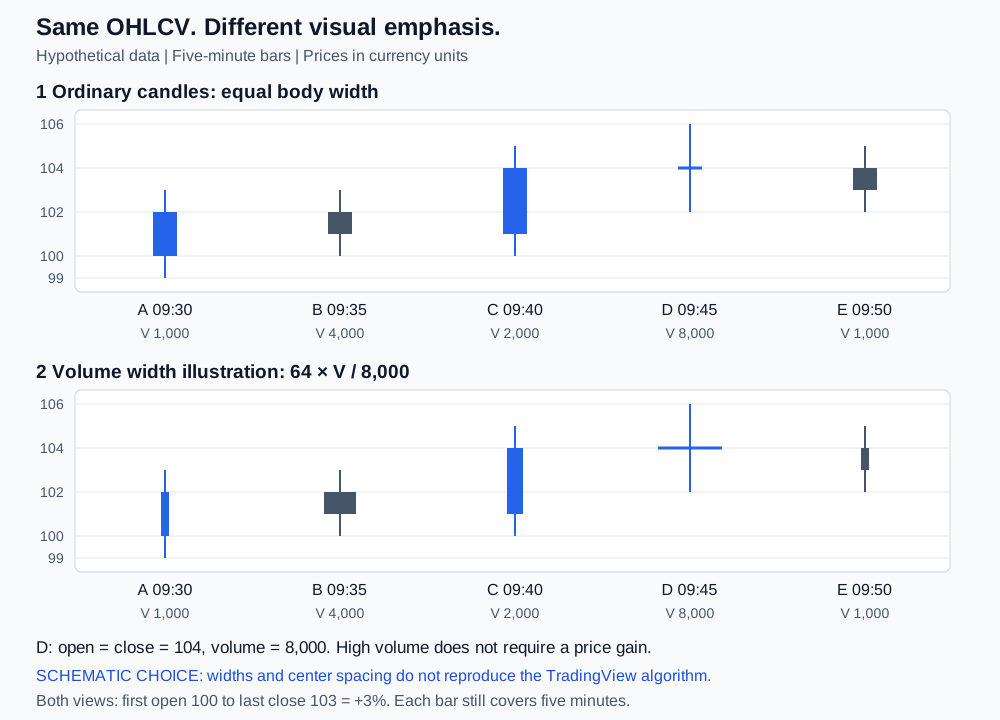
Five identical OHLC bars shown with equal widths and volume-based schematic widths. Bar D has the highest volume, 8,000, but equal open and close of 104.
Original Pineify diagram using hypothetical data. Width = 64 × volume / 8,000 SVG units is a schematic choice, not the TradingView rendering algorithm. The drawing keeps the same price coordinates and timestamps in both panels. View original source
  • Bar A rises by 2 price units on 1,000 volume units. Bar B falls by 1 price unit on 4,000 units. A larger width therefore does not mean a larger price change or a bullish bar.
  • Bar D has the most volume, but its body has zero height because open equals close. Its wick still spans 102 to 106. Total volume alone cannot explain the sequence of transactions within that range.

Reproduce the OHLCV and return calculations

Assume one fictional instrument, one session, completed five-minute bars, no missing intervals, and unchanged data adjustments. Times are bar-open times in one fixed chart time zone. Prices use arbitrary currency units; volume uses consistent trade units. There are no fees, dividends, or execution assumptions. Returns below describe prices, not a strategy.

  • For each row, price change (%) = 100 × (close / open - 1). For B: 100 × (101 / 102 - 1) = -0.980392%, rounded to -0.9804%.
  • Across the full sample, first open to final close is 100 × (103 / 100 - 1) = +3%. First close to final close is 100 × (103 / 102 - 1) = +0.9804%. The starting observation must be stated.
  • Volume totals 16,000 units. D accounts for 8,000 / 16,000 = 50%. In this diagram its width is eight times A's, but that ratio follows our chosen linear drawing formula. Do not infer exact native volume ratios from measured pixels.
  • Switching between these displays, or resizing the image, cannot change the +3% first-open-to-last-close result. If numeric results change in TradingView, reconcile the bar timestamps and data settings before attributing the difference to width.
Bar / open timeOpenHighLowCloseVolumeSchematic widthOpen-to-close change
A / 09:30100103991021,0008+2.0000%
B / 09:351021031001014,00032-0.9804%
C / 09:401011051001042,00016+2.9703%
D / 09:451041061021048,000640.0000%
E / 09:501041051021031,0008-0.9615%

Enable the native chart and check access

In TradingView Supercharts, open the chart-type menu on the top toolbar and select Volume candles. The current pricing page lists this chart type for Premium and Ultimate; verify the entitlement in your account before upgrading. A subscription feature and the availability of volume for a particular symbol are separate checks.

  • In Chart settings, open Symbol to inspect body, border, wick, and color settings. Record whether Color based on previous close is enabled: that setting uses the previous close for direction instead of the current open.
  • Choose one closed bar, record its timestamp and OHLCV, then switch back to Candles. Add the built-in Volume indicator if you need a numeric volume reference alongside the price bars.
  • A community script with "volume candles" in its name can use its own colors, lookback, or drawing formula. Check its description and settings before treating it as the native chart type.

Keep screen width separate from elapsed time

In the example, A and D each cover five minutes even though D is eight times as wide in the schematic. Adding body widths, measuring gaps between their edges, or judging the duration of a move from its visual bulk gives the wrong quantity. Read the bar timestamps and interval; account for session gaps when measuring clock time.

  • The official Volume candles guide specifies the width encoding but does not specify its normalization window, minimum width, or clipping formula. This guide does not claim that TradingView divides volume by the maximum visible volume.
  • For a reproducible screenshot comparison, freeze the visible range and panel size. Then vary one setting and recheck the same closed bar. A difference in screen width is a display observation until supported by changed numeric volume.
  • In our illustration, doubling the maximum drawing width from 64 to 128 doubles all body widths while OHLCV stays fixed. This demonstrates a display-scale effect; it is not a measured TradingView zoom result.
Change being testedRecordValid comparison
Candles to Volume candlesThe same closed bars and their OHLCVPrice and volume values before comparing visual emphasis
Horizontal zoom or panel resizePanel dimensions, visible start/end times, and target bar timestampRaw values; a pixel width is tied to the display scale
Pan to a different visible rangeBoth screenshots plus numeric volume for bars retained in viewWhether relative widths changed; do not assume a particular normalization window
Change interval or include extended hoursNew aggregation and session definitionA separate data sample, not a pure display comparison

Missing volume needs a separate decision

TradingView reports that some symbols or intervals have no supplied volume, while other feeds provide tick volume, which counts price updates. Inspect the exact exchange-prefixed symbol and interval. A valid price candle does not guarantee valid trade-volume data.

  • TradingView's volume-data help lists FOREXCOM forex/CFDs and TVC CFDs among cases without volume, and documents an intraday versus daily difference for FX_IDC. Verify your selected symbol rather than applying one rule to every forex feed.
  • No missing-volume fallback appearance is specified in the cited Volume candles guide. An ordinary-looking or very thin candle is not evidence of a known positive volume. Check the number instead.
  • For a numeric width exercise, keep missing volume unavailable and reject negative inputs. With a positive reference maximum, zero volume gives zero calculated width. If every volume is zero, dividing by the sample maximum is undefined. These are mathematical boundaries, not claims about TradingView rendering.
Observed dataInterpretationAction
Positive, comparable volumeA usable quantity for that feed and unitCompare raw values within the same data context.
n/a or absent volumeMissing information, not a measured zeroExclude the bar from volume-based conditions; inspect ordinary candles for prices.
Reported zeroA zero field that may need provider verificationDistinguish a valid zero from a data problem before drawing a conclusion.
Tick volumeCount of price updatesLabel the unit; do not compare it directly with shares or contracts.
Still-open barVolume and OHLC can continue changingWait for closure when the comparison requires completed observations.

Volume candles, Volume Profile, and Footprint answer different questions

A candle's total volume does not reveal how that volume was distributed inside its price range. Choosing a wider body adds a visual channel to the bar; it does not reconstruct missing price-level data.

DisplayWhat it organizesWhat width alone cannot establish
Volume candlesOHLC per bar with volume encoded in body widthVolume at a specific price, transaction sequence, or aggressor side
Volume ProfileVolume grouped into price levels across a selected periodAn exact initiating buyer or seller for each transaction
Volume FootprintVolume by price level within each candle, with categorized buy/sell valuesVerified trade-by-trade bid/ask aggression; TradingView documents intrabar price-direction classification

Keep a review record that survives a chart change

Save the ordinary-candle and volume-candle screenshots with the same review ID. Include readable axes, the complete symbol, interval, session, time zone, visible range, capture time, and color rule. Store the OHLCV values separately so the review remains checkable if the layout changes.

  • For a recorded trade, use Pineify Trading Journal plan and review notes to retain the review ID, assumptions, and screenshot filenames or links. Record entry and exit timestamps with the trade. Keep the original images and OHLCV file alongside your research record.
  • Pineify AI Chart Analysis accepts a chart image for analysis. Annotate the image with the chart type and settings, then verify any observation against the values you saved. An image cannot recover hidden volume data or prove the native width formula.
  • Log a conclusion such as "D had 8,000 volume units and a zero open-to-close change." A claim about who traded or what price will do next requires evidence beyond that candle. Neither review step executes a trade.
Where Pineify fits

Trading Journal

Record a trade with its timestamps, plan notes, and review notes. Keep the chart settings and screenshot references with your observations so you can revisit the reason for a decision.

Also useful: AI Chart Analysis. Upload a clearly labeled chart image for a second review. Check the response against the recorded prices and volume before drawing conclusions.

Record a chart review

Frequently asked questions

Educational information, not investment advice. All OHLCV values and drawings here are hypothetical. Widths are schematic and do not reproduce TradingView's native rendering. Visual emphasis, image analysis, and a journal entry do not establish trading performance.

Sources and verification

Published by Pineify. Pineify is an independent product and is not affiliated with TradingView. Sources support the technical explanations; examples do not establish trading performance.