TradingView workflows

Publishing a TradingView Idea: Timestamped Hypotheses and Follow-Up

To publish a TradingView idea, open your prepared chart, choose Publish idea, and enter a title, description, category, and long, neutral, or short bias. Select public or private visibility before submitting. A useful chart article states what was known before a possible entry, what would invalidate the hypothesis, and when it expires. Follow up on the original idea whether it succeeds, fails, or never triggers.

See the decision guide

Check publication access and visibility first

Official TradingView help checked on October 18, 2026 says Basic accounts can post private ideas, while public sharing requires a paid plan. Check the controls and account restrictions shown in your own publishing dialog. The publishing rules also restrict ideas on chart timeframes below 15 minutes to private publication, chat, or Minds.

  • Choose private if you need a revisable practice record. Check the visibility choice again before clicking the final publishing button.
  • Public content must follow the House Rules. Write in the language of the TradingView site you use, explain your reasoning, and keep promotion out of the article and chart.
  • A normal public trading idea must not show private, personal, or invite-only scripts. The documented How-to exception has separate vendor requirements.
ChoiceWho can find itCorrection boundary
Public ideaDiscoverable through public TradingView surfaces and eligible for search indexing; visibility is not guaranteed.Title or description edits and deletion are limited to the first 15 minutes. It cannot later become private.
Private ideaAccessible through its direct link; absent from public profile listings, idea streams, and search indexing.TradingView documents editing and deletion at any time. A shared link is not a confidential archive.

Prepare the chart, then fill the publishing form

On Supercharts, prepare the symbol, interval, drawings, and readable price scale before opening Publish idea. Use the idea action rather than the Pine Editor script-publishing action. TradingView requires a title, description, category, and directional label; related ideas and smart tags are optional.

  • Show the exchange-qualified symbol, chart type, session, timezone, and relevant date range. State whether the final visible candle is closed or still forming.
  • Mark the observation that supports the hypothesis and a separate level or event that would reject it. An arrow toward a target does not explain the evidence.
  • Write the description before the anticipated event. If the event has already happened, label the article as retrospective analysis rather than a new prediction.
  • Preview the chart and text. Check privacy, category, bias, spelling, and any related-idea links, then submit only when you intend to publish.
  • Open the resulting page immediately. Save its URL and displayed publication time, and use the short correction window if the published text or chart is wrong.

Example: separate the observed chart from the hypothesis

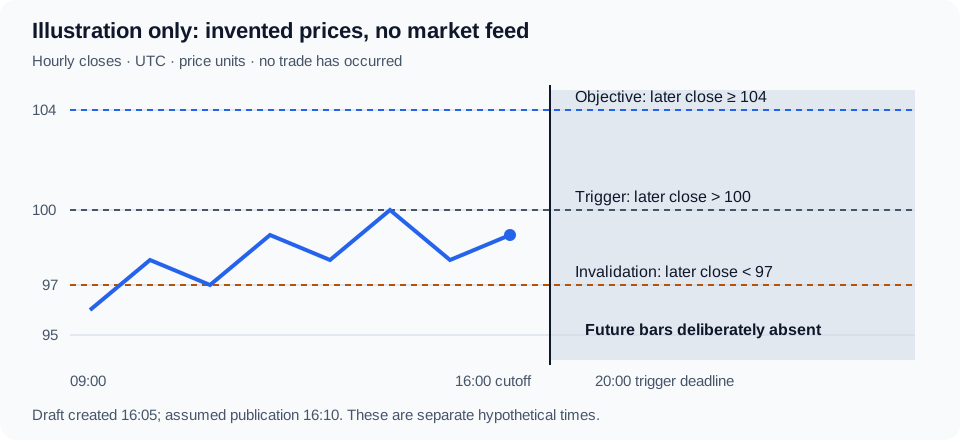
This teaching example uses an invented instrument and invented hourly closing prices. It is not an actual TradingView publication, historical market observation, or trade recommendation. The eight closes at 09:00 through 16:00 UTC on October 16, 2026 are 96, 98, 97, 99, 98, 100, 98, and 99. They show a recent range and a close below its upper boundary; they do not establish a profitable pattern.

Invented hourly closes ending at 99 before the data cutoff, with trigger above 100, invalidation below 97, and an empty future region.
Original teaching diagram. All prices and times are assumptions; the future region contains no observed bars. View original source
  • Data cutoff: 16:00 UTC, the last included closed bar. Draft creation: 16:05. Assumed publication: 16:10. A typed creation time is author-supplied context, not independent proof of when the text was written.
  • Hypothesis: a later hourly close above 100 may precede a close at or above 104. A close below 97 rejects the setup. These thresholds are chosen for the exercise, not estimated from research.
  • Trigger window: the closes at 17:00, 18:00, 19:00, and 20:00 UTC. A close of exactly 100 does not trigger. A close of exactly 97 does not invalidate. Evaluate cancellation before entry eligibility.
  • For a simulated entry, use the first next-bar opening price after a qualifying close only if it is between 100 and 101 inclusive. A gap outside that range means skipped, with no later retry under this draft.

Copyable article draft: a conditional range-break study

Copy this into your notes as a worked draft. Before using it for a real idea, replace the invented chart, dates, levels, and assumptions with your own observations and rerun the audit below. Do not paste this fictional instrument as a real market call. Category and visibility are publishing-form choices, not assertions that this example has been posted.

Complete educational draft; all example market values are inventedtext
TITLE: Hourly range-break study: above 100, invalid below 97
FORM: Educational category if available; neutral bias; private practice draft.

CONTEXT
This is an invented chart exercise, not a live trade idea.
Instrument: EXAMPLE (fictional, not a TradingView ticker).
Chart: hourly standard candles, continuous session, UTC, price units.
Data cutoff: 2026-10-16 16:00 UTC, closed bar.
Draft created: 2026-10-16 16:05 UTC (assumed author timestamp).
Publication: not published. Assumed example time: 16:10 UTC.
At a real publication, save the actual URL and platform time separately.

OBSERVATIONS BEFORE ENTRY
Hourly closes from 09:00 through 16:00: 96, 98, 97, 99, 98, 100, 98, 99.
The last close is below the recent closing-price ceiling of 100.
Several closes returned toward 98; there is no confirmed breakout yet.
No position or order exists in this exercise at the cutoff.

HYPOTHESIS AND TRIGGER
A later hourly close above 100 may precede a close at or above 104.
Eligible trigger closes: 17:00, 18:00, 19:00, and 20:00 UTC on October 16.
Before a trigger, any hourly close below 97 cancels the study.
At the first eligible close above 100, mark the hypothesis triggered.
For a separate simulated entry, take the next bar's opening price only
if it lies from 100 to 101 inclusive. Otherwise mark skipped; no retry.
A chart trigger does not prove that an order was submitted or filled.

INVALIDATION AND EXPIRY
After triggering, evaluate subsequent hourly closes in time order.
First close below 97: hypothesis invalidated.
First close at or above 104: objective observed.
If neither occurs by 2026-10-17 16:00 UTC, mark timed out.
The 16:00 close is included; then the study ends.
If no trigger occurs by October 16 at 20:00, mark expired untriggered.
Do not extend either deadline after seeing the outcome.

LIMITATIONS
These are close-based research rules, not protective stop orders.
An intrabar touch alone does not meet a close-based condition.
Gaps can skip the entry range or move beyond an invalidation level.
No quantity, execution costs, or verified fills are supplied, so this
article makes no profit, loss, win-rate, or risk/reward performance claim.
This is educational information, not investment advice.

FOLLOW-UP COMMITMENT
Append an update for a trigger, cancellation, skipped entry, objective,
invalidation, or expiry. Include the new data cutoff and posting time.
Keep the original levels and dates visible, even after a failed setup.
Separate hypothesis outcome from any actual trade outcome.
If a factual error is found later, append an explicit correction that
identifies the old statement and its effect on the interpretation.

Audit every field before and after publication

Use the same record on both sides of publication. These are suggested research controls, not additional TradingView requirements. The post-publication check compares the actual page with the saved draft; it should never silently repair the original hypothesis using later prices.

FieldBefore publishingAfter publishing
Title and categoryDescribe the question and choose a matching category.Confirm the page describes the same question.
Bias and positionDistinguish conditional direction from a held position.Record an actual position separately from a directional label.
Symbol and dataExchange, feed, interval, session, chart type, timezone.Compare the captured chart with the intended context.
Evidence cutoffLast included bar timestamp; closed or developing.Keep this fixed; give each update its own cutoff.
Creation and publicationSave draft creation time; leave publication unconfirmed.Save actual platform time and URL; report any delay past the trigger.
Chart and reasoningReadable levels and reasons; no later bars presented as known.Check that the published chart shows the intended evidence.
Trigger and entryExact comparison, bar timing, price constraint, gap rule.Record the observed trigger and actual or simulated entry separately.
Invalidation and objectiveExact conditions and which is evaluated first.Apply the original conditions even when the outcome is unfavorable.
ExpiryLast eligible trigger bar and final review deadline.Close the study as untriggered or timed out when appropriate.
Visibility and rulesPublic/private, account eligibility, language, script and promotion rules.Verify selected visibility; review any moderation notice.
Corrections and updatesSave the original draft and a follow-up plan.Correct promptly within the allowed window; append later clarifications.
Execution and resultsSay whether the study includes orders, sizing, and costs.Claim P&L only from reconciled fills and costs, never from a chart arrow.

Append the outcome to the original idea

TradingView directs authors to use Update Idea for follow-up instead of posting after-the-fact victory claims. This adds later information; it does not reopen the original public title or description after the correction window. Open the original publication and use its update action. Keep an external copy of the draft and each update so your review does not depend on later editing controls.

Possible branch in the invented exampleWhat the update must say
17:00 closes at 100.50; next bar opens at 100.60Triggered at 17:00. Simulated entry 100.60 meets the declared range; no actual fill claimed.
Same trigger; next bar opens at 101.40Hypothesis triggered, simulated entry skipped. Continue evaluating the hypothesis separately; no trade profit claimed.
After a trigger, a later close is 96.80 before the objectiveInvalidated at that bar close. Preserve 97 as the original boundary.
After a trigger, a later close is 104.20 before invalidationObjective observed at that close. This alone is not evidence of an exit fill or net profit.
No eligible close exceeds 100 by 20:00Expired untriggered. A breakout at 21:00 belongs to a new study.
A close is 96.80 before any triggerCancelled before entry. Do not count it as an executed losing trade.
Triggered, but neither outcome occurs by the next day at 16:00Timed out under the original deadline, without extending the study.
Follow-up format; replace bracketed fields with verified observationstext
UPDATE POSTED: [actual date, time, timezone]
NEW DATA CUTOFF: [last reviewed closed bar]
ORIGINAL RULE: [quote the relevant condition without revising it]
OBSERVED EVENT: [bar time, price, and source]
HYPOTHESIS STATUS: [pending / triggered / cancelled / invalidated /
objective observed / expired untriggered / timed out]
EXECUTION STATUS: [none / simulated / actual; skipped or fill details]
DEVIATIONS OR CORRECTIONS: [what changed and why, or none]
NEXT REVIEW: [original deadline, or study closed]
EVIDENCE: [retained before/after chart and journal record]

Keep research notes and screenshot review in Pineify

Pineify Trading Journal has trading plans and diary entries for research notes, plus plan notes, review notes, tags, and screenshots on trade records. Store the original hypothesis and publication URL in a plan or diary; create a trade record only when there is a trade to record. Keep untriggered studies in the diary so they remain part of the review.

  • AI Chart Analysis accepts chart screenshots. Use a clear symbol, interval, and price scale, then check any generated interpretation against the chart and underlying data.
  • Retain the source screenshot and its data cutoff alongside the AI interpretation. An image analysis does not independently verify when you knew a fact or whether an order filled.
  • Submit and update the TradingView publication yourself. This workflow does not automatically post ideas, execute trades, synchronize publications, or guarantee distribution.
Where Pineify fits

Trading Journal

Save the hypothesis in a plan or diary and compare it with later observations. Record trade notes and screenshots separately when a trade actually occurs.

Also useful: AI Chart Analysis. Upload a chart screenshot for an AI interpretation, then verify its observations before using them in your article.

Explore Trading Journal

Frequently asked questions

Educational information, not investment advice. The chart, prices, dates, and outcomes in the worked example are invented. A published hypothesis, AI interpretation, or journal entry does not establish trading performance or guarantee future results.

Sources and verification

Published by Pineify. Pineify is an independent product and is not affiliated with TradingView. Sources support the technical explanations; examples do not establish trading performance.