TradingView workflows

TradingView Object Tree: audit drawings and indicator state

TradingView Object Tree lists chart objects so you can inspect drawings and indicators that are difficult to identify on the canvas. Use it to check visibility, drawing locks, groups and visual order before removing anything. A hidden object still belongs to the chart; an overlapping object may be visible but covered. Save the original state and compare object settings before calling two entries duplicates.

See the decision guide

Identify why an object is missing from the canvas

Open Object Tree from the chart context menu or right toolbar, then expand drawing groups for the active chart. Select the relevant row instead of trying to click through overlapping shapes. Inspect one state at a time; a missing line is not enough evidence that someone deleted it.

ObservationCheckConsequence
Listed but hiddenObject and group visibility; chart-wide Hide controls.Restore visibility for inspection without recreating the object.
Shown only on some intervalsThe drawing or indicator Visibility settings.Changing chart interval can change what appears.
Visible but coveredVisual order and the fill of the covering shape.Move the covering drawing backward; keep its coordinates unchanged.
Cannot drag a drawingIts lock state.Unlock only for an intentional coordinate edit, then record that edit.
Two entries look identicalAnchors, symbol, pane, inputs and purpose.Matching names or colors alone do not prove duplication.
Absent from the expected chartActive symbol, chart and layout; drawing synchronization.Inspect the correct context before concluding that an object was removed.

Worked audit: seven objects, one obscured trendline

This constructed exercise represents a support review, not a live TradingView session. Use standard candles on NASDAQ:AAPL, 1D, regular session, dividend adjustment off, with the last visible completed bar dated 2026-10-16 and the chart timezone America/New_York. The levels below are invented. Keep the visible range at October 1 through 16 in both captures. D and I identifiers are labels for your audit notes, not TradingView object IDs.

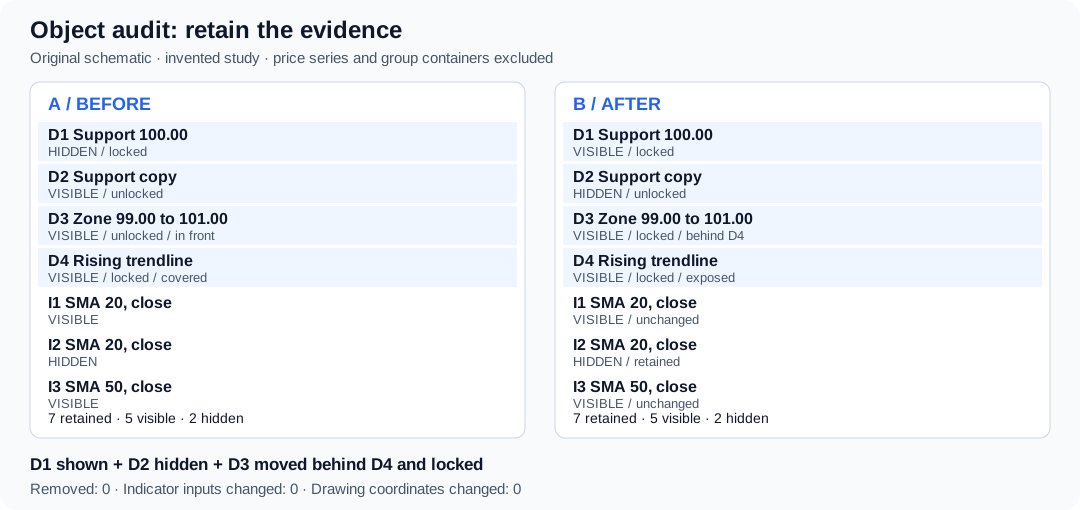
Original object inventory schematic: seven objects remain before and after; the original support becomes visible, its duplicate becomes hidden, and the zone moves behind the trendline.
Original schematic, not a TradingView screenshot. Counts exclude the main price series and group containers. The cleanup retains all four drawings and three indicator instances. View original source
  • Exercise coordinates: D1 and D2 are horizontal lines at 100.00. D3 spans the October 12 and October 16 bars between 99.00 and 101.00. D4 joins the October 12 bar at 99.00 to the October 16 bar at 101.00. All use the price pane, all-interval visibility and no drawing synchronization. Adjust the price scale to inspect these invented levels.
  • Capture A before editing. Compare D1 and D2 in settings, including their symbol, pane, price, style, interval visibility and synchronization. Confirm the same intended purpose in your notes.
  • Show D1 and hide D2. Move D3 behind D4 using Visual order, then lock D3. Group the retained drawings by study if useful; record group visibility as well.
  • Compare I1 and I2 Inputs, Style, Visibility, source and calculation timeframe. Check whether another indicator uses either instance as its source before considering removal. I3 is a separate 50-bar study, even if its line currently overlaps I1.
  • Capture B with the same chart context. Both states contain 7 study objects, of which 5 are enabled for display and 2 are hidden. Locked drawings increase from 2 to 3. Removed objects: 0. Enabled visibility does not guarantee unobstructed pixels.
Inventory itemBefore AAfter B
D1: Support at 100.00Hidden, locked; intended reference.Visible, locked; coordinates unchanged.
D2: Support copy at 100.00Visible, unlocked; same horizontal-line settings as D1.Hidden, unlocked; retained for comparison.
D3: Zone from 99.00 to 101.00Visible, unlocked; fill covers part of D4.Visible, locked; moved behind D4 with the same bounds.
D4: Rising trendlineVisible, locked; partly obscured by D3.Visible, locked; anchors unchanged.
I1: Built-in SMA, length 20, closeVisible; chart timeframe.Visible; same inputs and timeframe.
I2: Second SMA, length 20, closeHidden; same script and settings as I1.Hidden; retained pending dependency review.
I3: Built-in SMA, length 50, closeVisible; chart timeframe.Visible; retained because its lookback differs.

Know what each cleanup action changes

An object audit changes how you see a study unless you also change its coordinates, inputs, source or membership. Keep those changes separate in the log. A cleaner image cannot establish that a signal improved or that the underlying trading rule stayed equivalent.

  • Treat a hidden indicator as a retained study, not evidence that its calculation or alerts are disabled. Existing script alerts use a server-side snapshot. Manage their stop, delete or recreate actions in the alert interface separately.
  • Manual drawings and Pine-generated lines or boxes are separate entities. Pine cannot read manual drawing tools. A box produced by a script may require that script's controls or code to change; do not assume each generated shape has an independently editable manual-drawing row.
  • If a dependent indicator consumes another study's output, review the dependency before removing the source instance. Record and recheck the dependent output afterward rather than assuming it is unchanged.
ActionEffectBoundary
Hide a drawing or indicatorRetains the instance while suppressing its display.Does not rewrite its saved source or turn an existing script alert off.
Lock or reorder a drawingRestricts dragging or changes which layer covers another.Does not alter market prices; moving its anchors would change the annotation.
Remove a manual drawingRemoves that annotation from the chart context.Does not edit historical OHLC. Inspect sync scope before removal.
Remove an indicator instanceRemoves that configured study and its visual output from this chart.Does not delete a separately saved Pine source file. Re-adding requires the correct script and settings.
Change indicator inputsChanges the study configuration and potentially its output.This is a rule or parameter change, not merely a visibility cleanup.

Capture enough evidence to reproduce the cleanup

For each state, save a chart snapshot plus a screen capture with Object Tree open and the relevant groups expanded. A chart-only image can omit the state that explains it. Store both before changing or removing objects. Use TradingView Take a snapshot to download the chart image; capture the panel separately if it is absent from the result.

  • The filenames are a suggested convention, not files captured by this page. If settings cannot fit in one image, add a settings capture and link it to the inventory row.
  • Do not infer hidden settings from pixels. A screenshot preserves visible evidence; it cannot restore editable objects or prove the exact script version by itself.
Record fieldWhat to save
Audit ID and capture timeFor example OT-001-A and OT-001-B; actual capture timestamp with timezone, author and reason for cleanup.
Chart identityLayout name and URL, active chart position, exchange-qualified symbol, interval and chart type.
Data contextChart timezone, session, adjustment settings, delay status, last completed bar timestamp and visible date range.
Object inventoryAudit label, type, name, group, pane, visibility, drawing lock, relative visual order and sync scope.
Reconstruction settingsDrawing time/price anchors; indicator author or source version, inputs, source series, timeframe, style and interval visibility.
Evidence filesOT-001-A-chart.png, OT-001-A-tree.png, OT-001-B-chart.png and OT-001-B-tree.png, with actual file paths or saved links.
Change log and resultOne action per entry; old/new value, reason, object counts and whether the original observation remains reproducible.

Save and recover without assuming Undo is a backup

Save the intended layout state before closing. With autosave enabled, drawing changes can persist immediately; saving afterward does not preserve the old version. Check each drawing's synchronization scope because a copied layout is not an independent backup of globally synchronized drawings.

  • For a recent accidental chart edit, try Undo immediately and verify the recovered object and settings. TradingView specifically warns that deleting drawings for a symbol not open on the chart cannot be reversed with Undo.
  • An indicator template preserves an indicator setup, not the drawing inventory. Applying a template replaces current indicators and can remove drawings from indicator panes. Do not use template application as a harmless cleanup step.
  • If removal is still justified, record the exact object and reason first. Retain its settings and evidence. Reconstructing from notes is a manual recovery procedure, not a guaranteed restoration of the original object.

Keep the audit with the research decision

Trading Journal supports written trading plans and diary entries. Put the audit ID, hypothesis, chart settings and evidence references in the plan; append the cleanup result in diary notes. Keep image files in your chosen storage and include their references. This workflow does not import or restore a TradingView object tree.

  • AI Chart Analysis accepts uploaded chart images. Submit the cleaned chart with relevant levels visible, then check its interpretation against your original image and inventory. It cannot recover hidden objects or unseen indicator settings from an image.
  • Object Tree audits individual study objects. Layout management concerns the workspace that contains charts; Ghost Feed concerns a hypothetical path drawing. This audit creates neither a forecast nor a strategy backtest.
  • Keep the original conclusion if only presentation changed. If you discover a different input, misplaced anchor or unintended duplicate, label the new analysis as a revision and explain why.
Where Pineify fits

Trading Journal

Record the study hypothesis, object inventory, screenshot references and audit result in written plans and diary notes.

Also useful: AI Chart Analysis. Upload the chart image for visual analysis, then verify the interpretation against your saved study context.

Explore Trading Journal

Frequently asked questions

Educational information, not investment advice. The object inventory and prices are invented for a reproducible exercise. This page does not access your chart, delete objects or execute trades. Chart cleanup and screenshot analysis do not establish trading performance.

Sources and verification

Published by Pineify. Pineify is an independent product and is not affiliated with TradingView. Sources support the technical explanations; examples do not establish trading performance.