TradingView workflows

TradingView Hollow Candles: Body Fill vs Previous-Close Color

TradingView hollow candles encode two comparisons. A hollow body means close > open; a filled body means close < open. Green means close > previous close, and red means close < previous close. A red hollow candle can therefore rise during its own bar while finishing below the preceding close. These four cases use strict inequalities; equal-price cases need separate treatment.

See the decision guide

Four combinations, with the same OHLC shown as ordinary candles

These are four independent invented examples, each with a previous close of 100.00. They are not consecutive bars or market observations. Prices use arbitrary price units. The diagram pairs each Hollow candles rendering with ordinary filled Candles using open-to-close colors and the previous-close color option off.
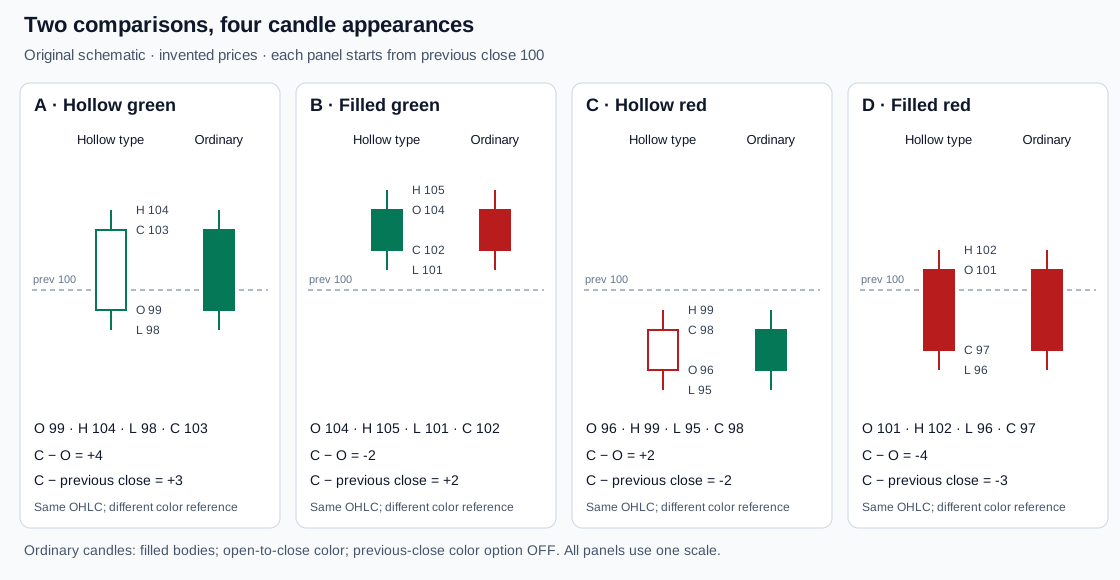
Four schematic pairs with previous close 100: hollow green opens 99 and closes 103; filled green opens 104 and closes 102; hollow red opens 96 and closes 98; filled red opens 101 and closes 97. Each pair repeats the same OHLC as an ordinary candle.
Original schematic, not a TradingView screenshot. All four panels share the same price scale and a dashed previous-close reference at 100. H and L mark extremes; O and C mark the body endpoints. Every price is hypothetical. View original source
  • In A and C, the close is the upper body edge because C > O. In B and D, the close is the lower body edge because C < O. The fill tells you which edge to read.
  • Each H is at least as high as both O and C; each L is at least as low as both. The wick range does not decide either comparison.
  • The two renderings in each pair have identical price endpoints. Different colors do not imply different prices.
CasePrevious close; O / H / L / CC − OC − previous closeHollow / ordinary appearance
A100; 99 / 104 / 98 / 103+4+3Hollow green / filled green
B100; 104 / 105 / 101 / 102−2+2Filled green / filled red
C100; 96 / 99 / 95 / 98+2−2Hollow red / filled green
D100; 101 / 102 / 96 / 97−4−3Filled red / filled red

Why a falling bar can stay green after an overnight gap

Treat case B as a hypothetical daily regular-session bar. Yesterday closed at 100; today opens at 104, trades between 101 and 105, then closes at 102. The opening gap is +4. The open-to-close move is −2, but the close-to-close move is +2. Its green filled body is consistent with both facts.

  • The identity is C − previous close = (O − previous close) + (C − O). Percentages use different denominators and must not simply be added.
  • Case C recovers two price units after a four-unit gap down but remains two units below the preceding close. That is why its rising body is hollow red.
  • For intraday charts, the reference is the preceding intraday bar. Calling every difference an overnight gap would misdescribe the interval.
  • If O equals the previous close and C differs from O, both comparisons have the same sign. Under those conditions, only hollow green or filled red fits the strict rules.
CalculationCase B: gap up, then fallCase C: gap down, then rise
Opening gap: O − previous close104 − 100 = +496 − 100 = −4
Move within the bar: C − O102 − 104 = −298 − 96 = +2
Total: C − previous close+4 + (−2) = +2−4 + 2 = −2
Open-to-close percentage−2 / 104 × 100 = −1.9231%2 / 96 × 100 = +2.0833%
Close-to-close percentage2 / 100 × 100 = +2.0000%−2 / 100 × 100 = −2.0000%

Equal prices: report the numbers before assigning a category

TradingView's cited hollow-candle help page defines higher and lower comparisons but does not specify a tie-breaking rule. Its official tutorial also describes strict comparisons. We could not verify from those sources which color or fill takes precedence at exact equality. The following arithmetic is certain; a TradingView tie-color claim would require additional evidence.

  • Read the OHLC values at the instrument's available precision. Two labels rounded to the same displayed number do not establish exact equality.
  • When equality matters to a research rule, record it explicitly as equal and keep it separate from above and below. That is your study classification, not an assertion about TradingView's renderer.
  • A candle with equal open and close can still have a wide high-low range. Zero net change is different from zero movement.
Hypothetical inputWhat the values establishWhat not to infer
Previous close 99; O 100, H 102, L 98, C 100C − O = 0; body height |C − O| = 0. C − previous close = +1.A zero-height body has no visible interior to classify reliably as hollow or filled.
Previous close 100; O 99, H 101, L 98, C 100C − O = +1; C − previous close = 0.Do not extend the strict green/red rule to an equality color without checking the platform.
Previous close 100; O 100, H 100, L 100, C 100Body height and high-low range are both zero.A flat bar does not prove that no trades occurred or that volume was zero.

Compare chart types without changing the underlying question

Open the chart-type menu in Supercharts and select Hollow candles. For a comparison, switch the same symbol and interval to Candles. In the Candles settings, check whether Color bars based on previous close is enabled: that option changes the ordinary candle color reference. The comparison above assumes it is disabled.

  • Preserve symbol, exchange, interval, session and adjustment settings while switching chart type. Read the same completed bar and the same preceding close in both views.
  • Keep the usual up/down colors identifiable. Custom body, border and wick colors can make a screenshot ambiguous; include a legend rather than assuming every green pixel means an up close.
  • Hollow candles retain OHLC geometry. Heikin Ashi is a separate chart type with calculated prices; its values are not the comparison used in these examples.
  • If your task is to change appearance, use the chart settings. If your task is to classify a bar, compare the values first. Recoloring a candle does not change the arithmetic.

When reading the screenshot is not enough

The four labels describe completed price relationships. They do not identify the path taken inside the bar, the cause of a gap or the next price move. A high and low can occur in either order while leaving the same final candle.

  • A green filled candle does not establish a buy signal, and a red hollow candle does not establish a sell signal. Any trading rule still needs its own entry, exit, risk and evaluation criteria.
  • A single candle cannot show whether the high came before the low. Do not use its final shape to claim an executable intrabar sequence.
Reading failureCheck before classifying
Previous candle is cropped outRetrieve its close from the same series; the current candle alone cannot verify the color comparison.
Current bar is still formingIts latest price can cross O or the preceding close. Recheck when the bar completes.
Thin body, low-resolution image or overlapping indicatorZoom in and inspect numeric OHLC. Do not invent a fill classification from unclear pixels.
Session or adjustment setting differsCompare identical series settings. The preceding visible bar may no longer be the same reference.
Screenshot colors conflict with arithmeticConfirm chart type, custom colors and any script coloring before reporting a platform error.

Keep a review record in Trading Journal

Pineify Trading Journal supports written plans and diary notes. For a candle-reading exercise, save the symbol, interval, session, bar timestamp, previous close and OHLC values in a plan. Record your two comparisons and the chart settings, then add any correction to a diary note. Retain the original screenshot separately and include its file reference or share link.

  • For case B, a useful note is: previous close 100; O/H/L/C 104/105/101/102; filled because −2; green because +2. That preserves a checkable explanation.
  • AI Chart Analysis accepts chart images for analysis. Supply a legible image with symbol, interval, price axis and the preceding candle visible; verify its interpretation against the recorded values.
  • Screenshot analysis does not verify an unseen previous close or recover exact prices from unreadable pixels. This review workflow does not automatically import candle values or execute trades.
Where Pineify fits

Trading Journal

Save the candle values and chart settings in a written plan, then keep corrections and observations in diary notes.

Also useful: AI Chart Analysis. Review a legible chart image and compare the interpretation with your recorded OHLC and previous-close values.

Explore Trading Journal

Frequently asked questions

Educational information, not investment advice. All example prices are invented. Candle appearance, screenshot analysis and journal notes do not establish trading profitability or predict future returns.

Sources and verification

Published by Pineify. Pineify is an independent product and is not affiliated with TradingView. Sources support the technical explanations; examples do not establish trading performance.