TradingView workflows

TradingView Ghost Feed: scenario sketches without fake backtests

TradingView Ghost Feed draws hypothetical candles along a direction you choose. It does not supply future market data. Use it to illustrate a written scenario, save the original chart and timestamp, then compare later market observations with that unchanged record. A convincing sketch is not a backtest or evidence of forecast accuracy.

See the decision guide

Create and identify the drawing

On the left drawing toolbar, open Forecasting and measurements tools and select Ghost Feed. Choose a starting point and map the intended direction. Double-click the ghost candles to open settings. TradingView recommends standard candles for this tool.

  • Use a visibly different drawing color and add a separate text annotation: HYPOTHETICAL, scenario ID, creation time and expiry. Do not rely on color alone.
  • Save a screenshot before any later bars arrive. Lock is an editing aid, not an immutable audit record.
  • For illustration, 80 minimum ticks × an assumed 0.01 price unit per tick = 0.80 price units. Record the actual instrument tick size; this setting supplies no probability or confidence interval.
ControlWhat to record
InputsAvg HL in minticks and Variance: candle range and spacing controls.
CoordinatesStarting price and bar position.
StyleBody, border and wick colors, plus transparency.
VisibilityThe intervals where the drawing appears.
Right-click menuLock prevents accidental dragging; Object Tree groups drawings.

Freeze a baseline that another person can locate

Use the most recent completed bar as t0, then separately record when you created the sketch. A chart bar timestamp and your decision timestamp are different fields. If a new bar has already begun, the record must say what information was visible when you made the decision.

  • Count future completed bars on the frozen interval. Three bars does not always mean three calendar periods because sessions and gaps matter.
  • Use the written checkpoint prices as the comparison values. A pixel position or a wick that looks close is not a numeric observation.
  • If the feed is delayed, preserve that fact. Do not label the sketch as preceding a market event merely because that event was not yet visible in your feed.
Baseline fieldRequired entry
Chart identityExchange-qualified symbol, interval, standard candles, session and adjustment settings.
Information cutofft0 bar timestamp, timezone, completed close and data delay status.
Decision timeCreation timestamp with timezone; note any partially formed bar already visible.
Sketch definitionStarting coordinate, path checkpoints, drawing inputs and original screenshot reference.
Evaluation rulePrice source, close versus intrabar test, horizon, failure precedence and missing-data policy.

Worked scenario: the rebound does not erase the failure

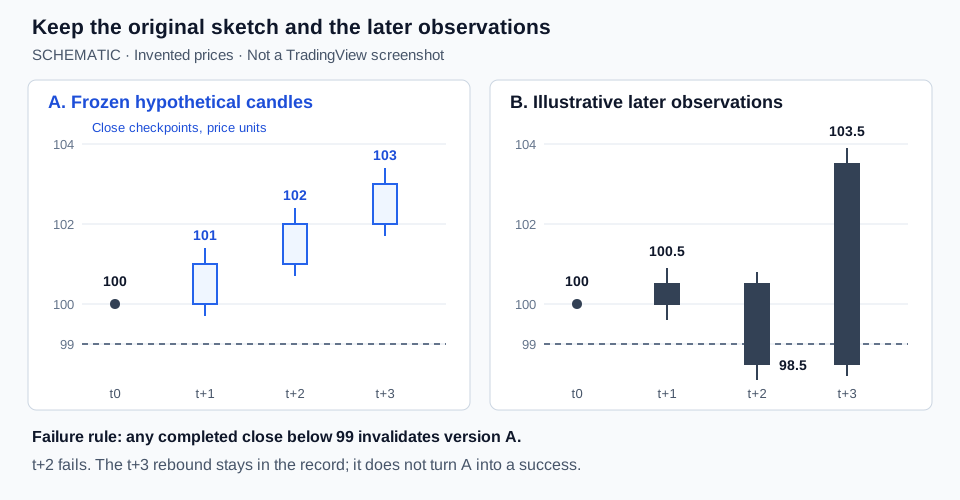
This invented exercise uses a t0 close of 100.00 and three future completed bars. The sketch has close checkpoints of 101.00, 102.00 and 103.00. Define completion as a close at or above 103.00 by t+3, provided no earlier close is below 99.00. A close exactly at 99.00 does not fail this rule. Once invalidated, the scenario stays invalidated.

Schematic with a frozen hypothetical rise and a separate observation sequence that closes below 99 at the second bar before rebounding.
Original schematic, not a TradingView screenshot. All prices are invented. Hollow candles show the frozen hypothesis; the separate filled candles illustrate later observations. View original source
  • Signed checkpoint error is observed close minus sketch close: -0.50, -3.50 and +0.50 price units. These are path errors, not trading profits or losses.
  • If every close stays at or above 99.00 but none reaches 103.00 by t+3, record expired, target not reached. A missing required observation produces an incomplete record, not a success.
  • The hypothetical endpoints and candle shapes are study inputs. They do not estimate the likelihood of this path or specify an executable entry, exit, size or fill.
CheckpointFrozen sketch closeIllustrative observed closeRecord after bar closes
t0100.00 baseline100.00Archive version A; no future observations yet.
t+1101.00100.50Below sketch by 0.50; still active.
t+2102.0098.50Below sketch by 3.50; first invalidation.
t+3103.00103.50Above sketch by 0.50; version A remains invalidated.

Review actual candles without rewriting the forecast

Keep version A and its original screenshot unchanged. At each checkpoint, capture a new image and append the observed value and classification. The table above can be copied into notes with its observation cells left blank at creation. Label the values as actual only when they come from the market series you recorded.

  • Temporarily hide the drawing when reading market OHLC values, then restore it for a separate comparison screenshot. Preserve both images with their timestamps.
  • If the symbol, interval, session or adjustment basis changes, reconcile the data before comparing. Do not quietly substitute a more favorable series.
  • A revised outlook gets version B, a new creation time and a reason for the revision. Keep the failed version in the review sample.
  • A drawing positioned over known history is a retrospective illustration unless you have a record proving when the hypothesis was made. Moving it backward does not turn it into an earlier forecast.
  • If a provider later corrects a bar, retain the originally observed value and append the corrected value with its retrieval time.

Ghost Feed, alerts and backtests use different inputs

Pine Script cannot interact with manual chart drawing tools. A script therefore cannot read Ghost Feed candles as OHLC, obtain its anchor automatically, or treat its path as a strategy input. Encoding the written rule with explicit numbers is a separate implementation that must be tested on market bars.

  • An intrabar price alert below 99.00 is not the close-below-99.00 rule in this exercise. Review the completed close or use a separately coded confirmed-bar condition.
  • Do not interpret a notification as an order or a verified fill. This scenario review does not configure trade execution.
TaskSupported input and boundary
Visual scenarioGhost Feed supplies a drawing. No executions or return series follow from the sketch.
Historical practiceBar Replay reveals recorded market history. A Ghost Feed overlay does not replace those bars.
Strategy TesterA Pine strategy and broker emulator simulate trades on chart data. Manually drawn candles do not become the dataset.
Alert notificationUse a separately defined price or script condition. Ghost Feed is absent from the official list of supported drawing alerts.

Save the plan and review notes in Pineify

Trading Journal supports written plans and diary notes. Save the scenario ID, baseline, rules and original screenshot reference in the plan, then append observations in diary notes. Store image files separately and include their file references or share links; this workflow does not assume automatic drawing import or market synchronization.

  • AI Chart Analysis accepts chart images. For a review, supply an image whose hypothetical area is visibly labeled, or hide the sketch and submit the market-only view.
  • Use screenshot analysis to discuss visible features, then check quoted prices against the chart. An image alone cannot establish when a prediction was made, recover an unseen price history or verify a fill.
  • Keep scenario review separate from trade performance. Neither a journal entry nor AI commentary establishes profitability, and this workflow does not place trades.
Where Pineify fits

Trading Journal

Keep the original scenario in a written plan and add later observations in diary notes, including failures, revisions and missing data.

Also useful: AI Chart Analysis. Review a chart image with the hypothetical area clearly labeled. Check the interpretation against your recorded market observations.

Explore Trading Journal

Frequently asked questions

Educational information, not investment advice. All example prices and candle shapes are invented. Scenario sketches, screenshot analysis and journal records do not establish forecast accuracy, executable fills or future returns.

Sources and verification

Published by Pineify. Pineify is an independent product and is not affiliated with TradingView. Sources support the technical explanations; examples do not establish trading performance.