TradingView chart settings

TradingView baseline charts: reference levels and return interpretation

A TradingView baseline chart colors a price line and its fill according to their position above or below a reference. Base level sets that reference as a percentage of chart height, rather than a purchase price. Use it to inspect a chart relative to a chosen visual level; calculate your own return from executed trades and costs.

See the decision guide

Set the baseline and its colors

In Supercharts, use the upper toolbar chart-type menu and select Baseline. Open the Settings gear, then Symbol. The Baseline section contains the controls below. TradingView documents a default Base level of 50%; 0% is the bottom edge and 100% the top. Price source defaults to Close.

  • The baseline adjusts to the displayed chart area. After zooming or scrolling, inspect its price again before comparing screenshots.
  • For this exercise, use a regular price scale and record the visible bounds. A 50% height setting does not mean a 50% investment return.
ControlAction
Price sourceChoose the price series to plot. Keep it unchanged when comparing references.
Top line / Bottom lineSet each line color, thickness, and opacity.
Fill top area / Fill bottom areaSet the fill colors and opacity separately.
Base levelChange the chart-height percentage to move the boundary up or down.

Move the reference while holding prices fixed

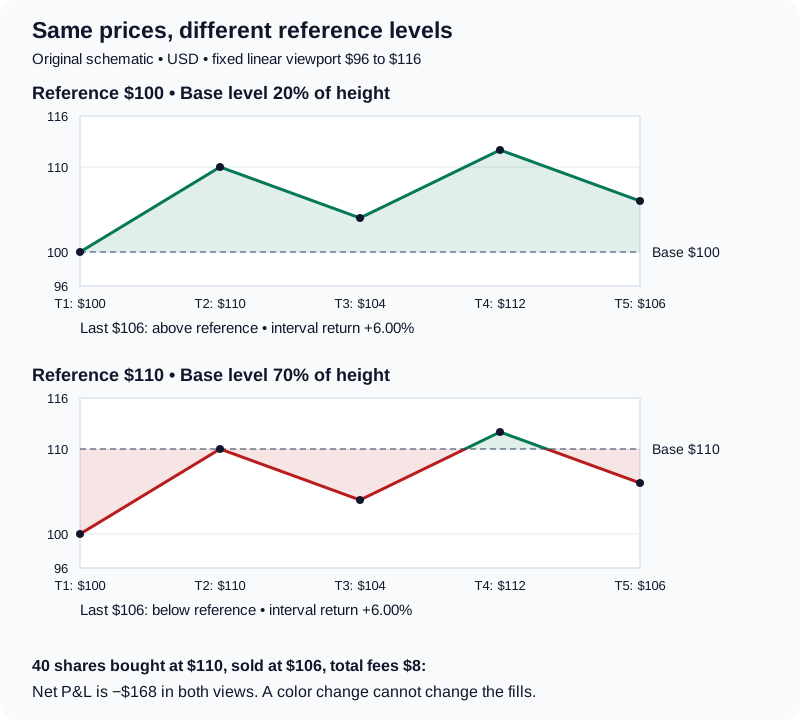
This original schematic uses five invented closes: $100, $110, $104, $112, and $106. Both panels have identical time points and a fixed linear display from $96 to $116. In this simplified viewport, a reference at $100 is 20% of the height and a reference at $110 is 70%: reference price = $96 + height fraction × ($116 − $96). This mapping assumes those exact displayed bounds; it is not a formula for logarithmic scaling or automatic chart margins.

Two schematic charts of the same five closes, with the last price of 106 above a 100 reference and below a 110 reference. The price path returns 6 percent in both panels.
Original educational schematic, not a TradingView screenshot. USD prices and display bounds are hypothetical. Above and below are labeled in addition to color. View original source
  • In Settings → Symbol → Baseline, try Base level 20, then 70. Your live chart will have its own price bounds, so read the resulting price rather than expecting $100 and $110.
  • At the final $106 close, the first panel is above its reference and the second is below. The historical closes are unchanged.
  • For the fixed first-to-last interval, the price return is ($106 ÷ $100 − 1) × 100 = 6% in both panels. Moving a visual reference cannot change that completed price move.
Measurement at $106Reference $100Reference $110
Position relative to referenceAbove by $6Below by $4
Distance relative to reference+6.00%−3.64%
First-to-last price return+6.00%+6.00%

Reconcile a position that lost money on a rising chart

Assume an unlevered USD stock trade: buy 40 shares at the second sample price of $110 and sell all 40 at the last price of $106. Each execution costs a hypothetical $4 fee. There are no dividends, financing charges, taxes, currency changes, or additional fills. These are invented executions for arithmetic practice, not actual trading results.

  • The chart interval began at $100, but this position began at $110. The chart gained 6% while the position lost $168 after fees; both statements use their own explicit starting point.
  • Setting a visual reference near $110 would omit the fees. Even the entry cost of $110.10 does not cover the assumed exit fee; liquidation break-even is $110.20.
  • Before a position closes, a calculation using a chart price is a mark-to-market estimate. An eventual exit fill and its costs determine the realized result.
  • For shorts, multiple fills, futures multipliers, leverage, or another account currency, use the appropriate position calculation and denominator. The cash-stock formula above does not describe all instruments.
Quantity being measuredCalculationResult
Entry cash outlay40 × $110 + $4$4,404
Entry cost per share including entry fee$4,404 ÷ 40$110.10
Exit cash proceeds after exit fee40 × $106 − $4$4,236
Gross realized P&L40 × ($106 − $110)−$160
Net realized P&L−$160 − $4 − $4−$168
Return on entry cash outlay−$168 ÷ $4,404 × 100−3.81%
Exit price needed to cover both fees($4,404 + $4) ÷ 40$110.20

Keep chart height, percentage scale, and cost separate

Percentage scale changes the units on the price axis; Base level controls the chart reference used for coloring. TradingView documents percentage scale as price changes relative to the chart starting point. Neither setting supplies your execution history. For a cost comparison, retain the numerical cost in your trade record and, if useful, add a separately labeled horizontal price drawing.

  • A green area is not an entry rule. Specify a timestamp, reference price, price source, and decision rule before testing any trading hypothesis.
  • If a screenshot looks different, compare its interval, session, price source, scale, and data adjustments before interpreting the difference. A chart display cannot reconcile missing fills or fees.
QuestionUseFailure to avoid
Is this close above the displayed reference?Baseline chart and a recorded reference priceTreating a color change after reframing as a new trade outcome
How much did price change over this interval?Explicit start/end prices and timestampsComparing screenshots with different starting dates
What did my trade earn?Execution ledger, quantity, and all applicable costsReading the filled area as account equity
Did price trade above my cost during a bar?Suitable intrabar data and actual cost recordsAssuming a line of closes contains every intrabar high and low

Preserve the setup and review the result in Pineify

Save the chart screenshot with a run name, then record the exchange-qualified symbol, interval, observation timestamp, price source, scale, visible date range, Base level, and the price at the reference. Keep the screenshot in your research files and put its filename or link in your journal notes. This preserves enough context to explain why two screenshots might use different colors.

  • In Trading Journal, manually record the trade side, entry, quantity, exit, and fees. Use plan and review notes to state the reference and your hypothesis. Reconcile the result with your execution record.
  • For the worked trade, record $8 total fees once in the relevant closing record; do not both add them to the fill price and subtract the same fees again. Keep the $4,404 return denominator explicit in the review.
  • For AI Chart Analysis, switch the same symbol and period to standard candlesticks before capturing an accompanying screenshot. Its upload workflow is intended for candlestick charts. Include legible axis labels and verify its observations against the original chart.
  • Neither a screenshot nor its colors reveals your purchase cost or complete fee history. Supply those facts in the journal yourself; this workflow does not execute trades or assume automatic TradingView synchronization.
Where Pineify fits

Trading Journal

Record fills and fees, then keep the chart reference and screenshot filename in your review notes. Compare the recorded trade result with the original hypothesis.

Also useful: AI Chart Analysis. Upload an accompanying standard-candlestick screenshot of the same symbol and period. Review the output yourself; it cannot recover an unseen execution ledger.

Explore Trading Journal

Frequently asked questions

Educational information, not investment advice. Prices, fills, fees, and chart bounds are hypothetical. Chart colors and historical results do not predict future returns.

Sources and verification

Published by Pineify. Pineify is an independent product and is not affiliated with TradingView. Sources support the technical explanations; examples do not establish trading performance.