TradingView geometry research

Fibonacci spiral trading: anchors, scaling and falsifiable tests

Fibonacci spiral trading uses an expanding curve to propose time-and-price intersections. TradingView has a native Fib spiral drawing, but an intersection depends on the anchors, orientation and coordinate scale. Freeze those choices before evaluating later prices. A curve fitted after a reversal cannot establish predictive value; the examples below make that sensitivity measurable.

See the decision guide

Separate the spiral from Fibonacci fans and arcs

For the golden logarithmic model, phi = (1 + sqrt(5)) / 2 and r(theta) = r0 × phi^(2theta / pi), where theta is in radians. Increasing theta by pi/2 multiplies the radius by phi; a full turn multiplies it by phi^4, approximately 6.8541. The time axis is not theta: time is the horizontal coordinate after converting polar coordinates to a chart.

  • A circular arc keeps a constant radius around its own center. A logarithmic spiral changes radius continuously around one pole. Sharing Fibonacci terminology does not make their intersections interchangeable.
  • Using q = 1.5 instead of phi still gives a logarithmic spiral, but it is no longer the golden spiral. The sensitivity test below labels that change explicitly.
ConstructionGeometryWhat must be specified
Golden logarithmic spiralOne pole; continuous exponential radial growthPole, initial radius, rotation, direction and coordinate units
Fibonacci quarter-circle constructionCircular arcs in squares of side 1, 1, 2, 3, 5, 8...The square layout and each arc center; this only approximates a logarithmic spiral
Fibonacci fanStraight rays through ratio divisionsSwing endpoints and the selected ray
Fibonacci arcsSeparate curved ratio levels around a reference constructionBaseline, radius levels and arc branch

Place and preserve the native TradingView drawing

Select Fib spiral in the drawing toolbar. The first click sets its center; the second sets initial size and orientation. The official tool documentation provides a Counterclockwise checkbox and Coordinates fields for the two anchor bars and prices. Record those values with the symbol, interval, session, adjustment settings and price scale.

  • Choose the anchor rule before looking ahead. One possible rule uses a low with two strictly higher lows on each side, followed by a high with two strictly lower highs on each side; ties do not qualify. The second pivot becomes known only after its two confirming bars close.
  • Save the drawing and a screenshot when both pivots are available. A historical pivot label does not make the pivot usable on the bar where it occurred.
  • The official page documents placement and controls, but not a complete numerical coordinate transform. The formulas below are an explicit research model, not a reverse-engineered claim about native TradingView prices.
  • To audit the native tool, preserve both anchors and direction, change only Regular versus Logarithmic scale, and record the curve price at the same timestamp. Repeat with only chart proportions changed. Keep observed native values separate from the model calculations.

Define the chart coordinates before drawing the curve

Use hypothetical anchors A = (bar 0, price 100) and B = (bar 10, price 105). The linear model uses H = 10 bars per horizontal unit and V = 5 price units per vertical unit. B therefore has normalized coordinates xB = 1 and yB = 1 relative to A, initial radius r0 = sqrt(2), and rotation alpha = pi/4. A is the pole, which the spiral approaches inward; it is not a finite point on the curve.

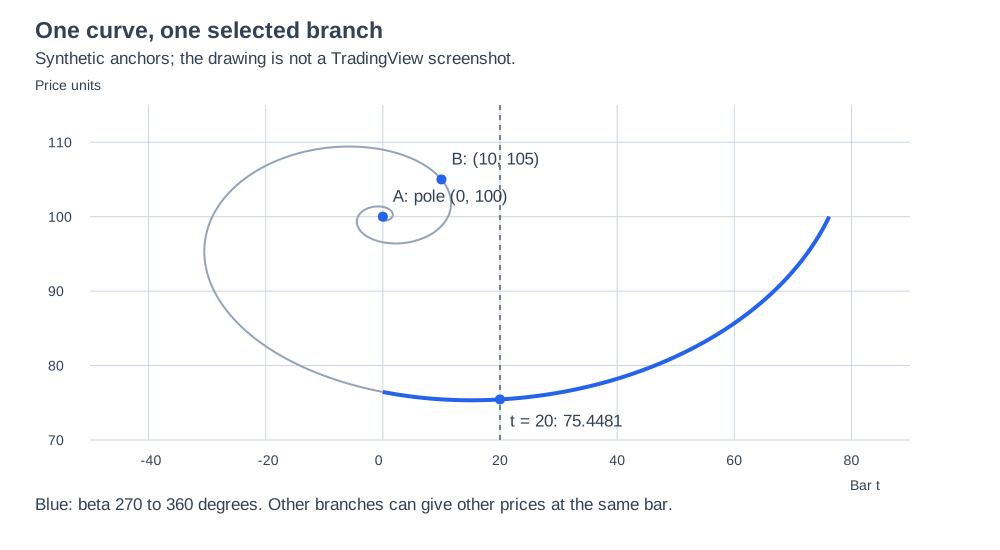
Original synthetic golden spiral with pole A at bar 0 price 100, anchor B at bar 10 price 105, and a blue branch crossing bar 20 at price 75.4481.
The blue branch is beta from 270 to 360 degrees. Gray shows the rest of the same curve. Download and run reproduce.py with Python 3 to regenerate both figures and calculations.json. View original source
  • For log price, choose L = ln(1.05), so one vertical unit is a 5% multiplicative change. The same B price of 105 again maps to yB = 1. Positive prices are required.
  • A full spiral can cross one vertical bar line more than once. This experiment fixes the branch beta in [3pi/2, 2pi]. Its horizontal coordinate strictly increases when q > 1, so each eligible bar has one branch price.
  • Solve t(beta) = 20 by bisection on that interval. With q = phi, the linear price is 75.44813175. The reproduction script and Pine example both use 60 bisection steps.
  • H and V are model units, not the pixel dimensions of your browser. Resizing an already computed data-coordinate curve changes its appearance without changing its numeric intersections. Recalculating H from screen proportions defines a different model.
Counterclockwise growth in coordinates with price increasing upward. The same formulas define the downloadable figures.Mathematical specification
xB = (tB - tA) / H
yB = (PB - PA) / V                         [linear]
yB = ln(PB / PA) / L                       [log price]
r0 = sqrt(xB^2 + yB^2)
alpha = atan2(yB, xB)
k = 2 × ln(q) / pi
r(beta) = r0 × exp(k × (beta - alpha))
t(beta) = tA + H × r(beta) × cos(beta)
P(beta) = PA + V × r(beta) × sin(beta)      [linear]
P(beta) = PA × exp(L × r(beta) × sin(beta)) [log price]

Change one assumption and measure the new intersection

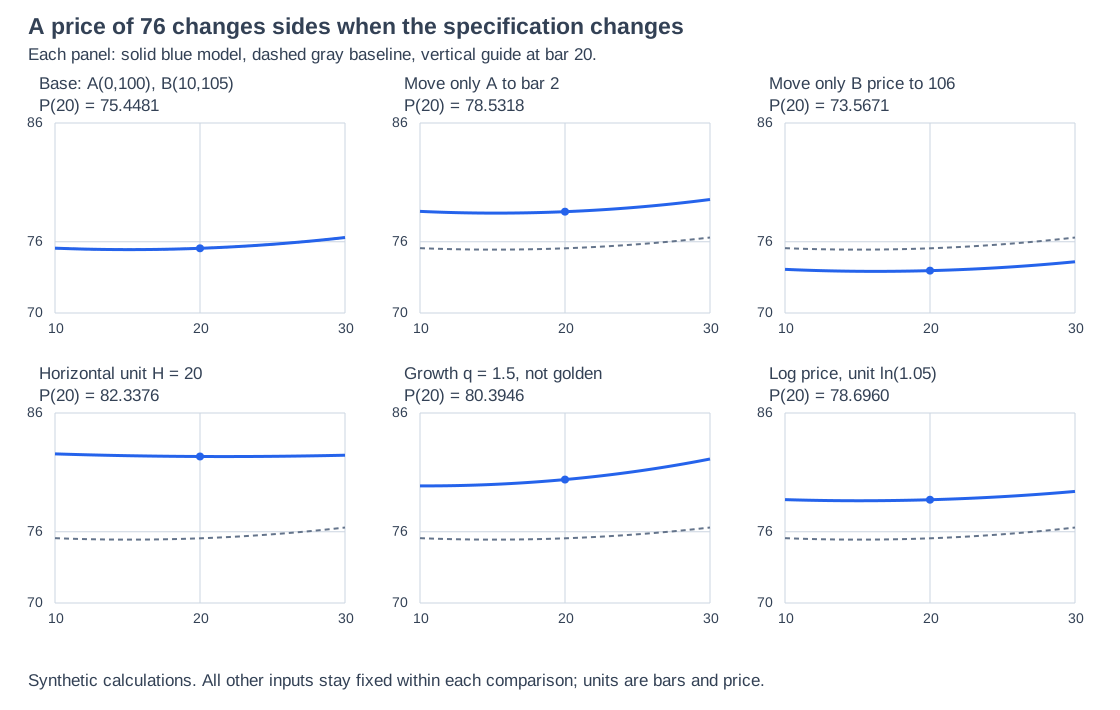
These six specifications all evaluate bar 20. Each row changes only the named input from A(0,100), B(10,105), H = 10, V = 5 and q = phi, except the log row, which replaces the linear vertical transform with L = ln(1.05). A price of 76 is above the baseline curve but below several alternatives. Selecting the preferred version after seeing 76 would change the test.

Six plots compare the frozen baseline with one changed input. At bar 20 the calculated prices are 75.4481, 78.5318, 73.5671, 82.3376, 80.3946 and 78.6960.
Identical axes in every panel. Solid blue is the named specification; dashed gray is the baseline. These are computed fixtures, not observed market or TradingView drawing results. View original source
  • The word logarithmic has two separate meanings here. Exponential radius growth defines a logarithmic spiral; taking ln(price) changes the chart coordinate system. A golden logarithmic spiral can be constructed in either linear-price or log-price coordinates.
  • Switching your chart display to Logarithmic does not change the formula inside a Pine script. Select and record the calculation model explicitly. A native drawing requires its own observed scale audit.
SpecificationCurve price at bar 20Price 76 relative to curve
Baseline linear model75.4481Above
Move only A from bar 0 to bar 278.5318Below
Move only B from price 105 to 10673.5671Above
Change horizontal unit H from 10 to 2082.3376Below
Change quarter-turn growth q from phi to 1.580.3946Below
Use log price with L = ln(1.05)78.6960Below

Fix the scoring rule before evaluating a contact

For the following arithmetic fixtures, lock the baseline geometry by bar 12 and inspect only bar 20 for a contact. Contact means low ≤ P(20) ≤ high, with no tolerance. After a contact, inspect closes at bars 21 and 22 in order. A rebound requires a close at least 2 price units above the contact-bar close. A failure is a close at least 2 units below it before a rebound. Stop at the first outcome; otherwise mark the case expired after bar 22.

  • These four deliberately constructed episodes exercise the classifications. They are not a historical sample, a pre-registered market trial or an estimate of a win rate. The numerical rule is fixed across all four; no anchors move to rescue episode 2.
  • The test uses completed-bar ranges and closes. It neither establishes intrabar execution order nor assumes a trade filled at the curve. A backtest would also need entry timing, exits, sizing, fees and slippage.
  • The 2-unit threshold is an illustrative choice. If a real study scales it by volatility, define the volatility measure and freeze its value before the observation window. Tuning the threshold after seeing failures adds another selection choice.
Independent synthetic episodeBar 20 low / high / closeCloses at bars 21 / 22Recorded outcome
175 / 76 / 75.576.5 / 78Contact; rebound at bar 22
275 / 76 / 75.573 / 79Contact; failure at bar 21, even though bar 22 rebounds
377 / 78 / 77.578 / 80No contact; later rise is not a hit
475 / 76 / 75.576 / 75.8Contact; expired without either outcome

Reproduce the same fixtures in Pine Script v6

Paste this complete indicator into Pine Editor. It displays the six calculated prices and the four episode outcomes in a table, independent of the chart symbol. Expected outputs are the two tables above. The script is an arithmetic audit: it does not select market pivots, read a manual Fib spiral, draw the full curve or place trades. Pine scripts cannot access manual chart drawing objects.

  • B must be later than A. This makes xB positive, so atan(yB / xB) in the code matches atan2(yB, xB) in the specification. That restriction avoids a quadrant ambiguity.
  • Read the calculated values at four decimals and compare every outcome, including Failure and Expired. Successful syntax validation does not establish predictive performance or verify the native drawing formula.
Complete source. The log unit is fixed at ln(1.05). Invalid units, reversed anchor times and non-positive log prices return na; bars outside the selected branch return na.Pine Script v6
//@version=6
indicator("Frozen spiral arithmetic fixtures", overlay = true)

// Counterclockwise golden-log model, not the native Fib spiral drawing.
// Solve only the increasing-x branch beta in [270, 360] degrees.
spiralPrice(float t, float ta, float pa, float tb, float pb, float h, float v, float q, bool logPrice) =>
    float result = na
    bool valid = tb > ta and h > 0 and v > 0 and q > 1
    valid := valid and (not logPrice or (pa > 0 and pb > 0))
    if valid
        float unit = logPrice ? math.log(1.05) : v
        float x = (tb - ta) / h
        float y = logPrice ? math.log(pb / pa) / unit : (pb - pa) / unit
        float radius = math.sqrt(x * x + y * y)
        float alpha = math.atan(y / x)
        float k = 2.0 * math.log(q) / math.pi
        float endTime = ta + h * radius * math.exp(k * (2.0 * math.pi - alpha))
        if t >= ta and t <= endTime
            float lo = 1.5 * math.pi
            float hi = 2.0 * math.pi
            for i = 0 to 59
                float beta = (lo + hi) / 2.0
                float r = radius * math.exp(k * (beta - alpha))
                float candidate = ta + h * r * math.cos(beta)
                if candidate < t
                    lo := beta
                else
                    hi := beta
            float beta = (lo + hi) / 2.0
            float yy = radius * math.exp(k * (beta - alpha)) * math.sin(beta)
            result := logPrice ? pa * math.exp(unit * yy) : pa + unit * yy
    result

outcome(float level, float lowPrice, float highPrice, float touchClose, float close1, float close2) =>
    string result = "No contact"
    if not na(level) and lowPrice <= level and level <= highPrice
        result := "Expired"
        if close1 <= touchClose - 2
            result := "Failure"
        else if close1 >= touchClose + 2
            result := "Rebound"
        else if close2 <= touchClose - 2
            result := "Failure"
        else if close2 >= touchClose + 2
            result := "Rebound"
    result

float phi = (1.0 + math.sqrt(5.0)) / 2.0
float base = spiralPrice(20, 0, 100, 10, 105, 10, 5, phi, false)
var table audit = table.new(position.top_right, 2, 12, border_width = 1)
if barstate.islast
    names = array.from("Base", "A bar = 2", "B price = 106", "H = 20", "q = 1.5", "Log price")
    values = array.from(base, spiralPrice(20, 2, 100, 10, 105, 10, 5, phi, false), spiralPrice(20, 0, 100, 10, 106, 10, 5, phi, false), spiralPrice(20, 0, 100, 10, 105, 20, 5, phi, false), spiralPrice(20, 0, 100, 10, 105, 10, 5, 1.5, false), spiralPrice(20, 0, 100, 10, 105, 10, 5, phi, true))
    table.cell(audit, 0, 0, "Synthetic specification")
    table.cell(audit, 1, 0, "Price at bar 20")
    for i = 0 to 5
        table.cell(audit, 0, i + 1, array.get(names, i))
        table.cell(audit, 1, i + 1, str.tostring(array.get(values, i), "#.0000"))
    table.cell(audit, 0, 7, "Synthetic episode")
    table.cell(audit, 1, 7, "Fixed-rule outcome")
    results = array.from(outcome(base, 75, 76, 75.5, 76.5, 78), outcome(base, 75, 76, 75.5, 73, 79), outcome(base, 77, 78, 77.5, 78, 80), outcome(base, 75, 76, 75.5, 76, 75.8))
    for i = 0 to 3
        table.cell(audit, 0, i + 8, "Episode " + str.tostring(i + 1))
        table.cell(audit, 1, i + 8, array.get(results, i))

Carry a frozen specification into a market study

Pineify Pine Script AI Coding Agent can help turn the explicit formula and initialization into editable Pine code. Supply the anchor-selection rule, when each pivot becomes available, coordinate units, branch interval and completed-bar event definition. Use the supplied arithmetic fixtures as acceptance cases before adding market-data logic.

  • For each eligible market setup, retain a record ID, instrument, interval, anchor coordinates, activation bar, scale, direction, units, branch, observation window and first outcome. Keep untouched and expired setups in the denominator.
  • If you try multiple branches, anchor rules or growth factors, record every candidate. Reserve a later period before choosing the final specification, and compare it with a defined baseline such as the same rebound rule applied at matched non-spiral times.
  • An implementation should report a missing branch value rather than substitute the nearest curve point. Do not backdate availability to a pivot bar, or silently recalculate old records when an input changes.
  • Publish the original rule and subsequent failures together. A different anchor or coordinate scale starts a new experiment; it does not revise an old failure into a successful prediction.
Where Pineify fits

Pine Script AI Coding Agent

Draft editable Pine code from the specified geometry and event rules, then review its calculations against the supplied fixtures.

Build from the spiral specification

Frequently asked questions

Educational research, not investment advice. All prices, figures and outcomes on this page are synthetic arithmetic examples. They are not market performance, native TradingView measurements, trade recommendations or evidence of future returns.

Sources and verification

Published by Pineify. Pineify is an independent product and is not affiliated with TradingView. Sources support the technical explanations; examples do not establish trading performance.