

Two profiles, one $100 VWAP
These are invented transaction records for two separate six-trade windows, A and B. Prices are in US dollars and quantities are shares. Each row below is one complete trade in its own window; there are no omitted trades. Both windows begin immediately before trade 1 and end immediately after trade 6. Their identical price sequence isolates the change in volume allocation.
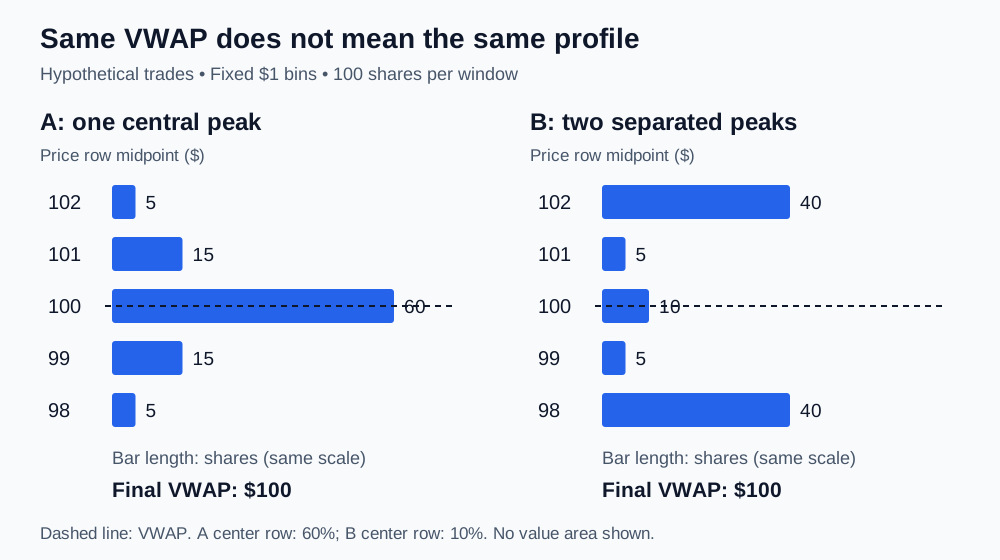
- Transaction VWAP = sum(price × shares) / sum(shares). A: (490 + 1,485 + 3,000 + 3,000 + 1,515 + 510) / 100 = $100. B: (3,920 + 495 + 500 + 500 + 505 + 4,080) / 100 = $100.
- This equality holds at the final cutoff. After trade 3, each window has 50 shares, but A has $4,975 of traded value and B has $4,915. Their developing VWAPs are $99.50 and $98.30 respectively.
- Reordering the records within either window preserves its final VWAP and profile. It can change the developing path. Neither final summary reconstructs the transaction sequence.
| Trade order | Price | A shares | A price × shares | B shares | B price × shares |
|---|---|---|---|---|---|
| 1 | $98 | 5 | $490 | 40 | $3,920 |
| 2 | $99 | 15 | $1,485 | 5 | $495 |
| 3 | $100 | 30 | $3,000 | 5 | $500 |
| 4 | $100 | 30 | $3,000 | 5 | $500 |
| 5 | $101 | 15 | $1,515 | 5 | $505 |
| 6 | $102 | 5 | $510 | 40 | $4,080 |
| Total | 100 | $10,000 | 100 | $10,000 |