TradingView indicator comparisons

DEMA vs EMA: reduced lag and extra overshoot

DEMA corrects an EMA with the difference between that EMA and a second EMA of it: DEMA = 2 × EMA − EMA(EMA). At the same length it responds more strongly to new data, but can overshoot a price that has stopped moving. In the length-9 experiments below, DEMA reaches 90% of a step in 4 bars versus 11 for EMA, and confirms a reversal 2 bars earlier. It also retains more alternating noise. Choose by the event your rule needs to detect and the false signals it can tolerate, rather than treating reduced lag as a trading advantage by itself.

See the decision guide

Step response: earlier arrival, then overshoot

Start both EMA stages at 100 on bar 0, equivalent to a constant prior price of 100. On bar 1 the source jumps to 110 and stays there. Every stage has length 9. Define arrival as the first completed bar at or above 109, which is 90% of the 10-unit change. DEMA arrives on bar 4; EMA arrives on bar 11. These are threshold measurements for this input, not universal lag values.
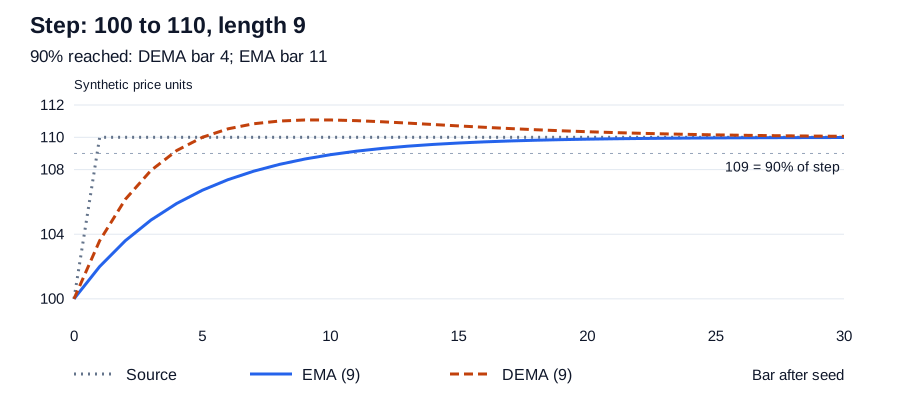
Length-9 step responses: DEMA reaches 109 on bar 4 and peaks above 111; EMA reaches 109 on bar 11 and remains below 110.
Original synthetic response chart. Price is gray dotted, EMA blue solid and DEMA orange dashed. The source link contains the calculated CSV for all three experiments. View original source
  • The exact DEMA peak is 111.073741824 on bars 9 and 10. Overshoot relative to the step size is (111.073741824 − 110) / 10 × 100 = 10.73741824%. This is not a return.
  • A close crossing above its average happens on bar 1 for both lines. Faster threshold arrival therefore does not guarantee an earlier price-cross entry.
  • Price never falls in this experiment, yet DEMA eventually sits above it. A subsequent price-below-DEMA condition can reflect the filter correction rather than a new decline in price.
BarSourceEMA (9)EMA of EMA (9)DEMA (9)
0100100.000000100.000000100.000000
1110102.000000100.400000103.600000
4110105.904000102.627200109.180800
5110106.723200103.446400110.000000
9110108.657823106.241904111.073742
10110108.926258106.778775111.073742
11110109.141007107.251221111.030792

The correction uses two EMA states, not twice the length

For N ≥ 1, set alpha = 2 / (N + 1). E1(t) = alpha × x(t) + (1 − alpha) × E1(t−1). E2(t) = alpha × E1(t) + (1 − alpha) × E2(t−1). EMA is E1; DEMA is 2E1 − E2. E2 uses the current E1 and the same N. E2 alone is a twice-smoothed EMA, not DEMA. Doubling N or alpha produces a different calculation.

  • For the first step bar: E1 = 0.2 × 110 + 0.8 × 100 = 102; E2 = 0.2 × 10² + 0.8 × 100 = 100.4; DEMA = 204 − 100.4 = 103.6.
  • With previous states fixed, a one-unit change in the current source changes EMA by alpha = 0.2 and DEMA by 2alpha − alpha² = 0.36. This explains its stronger initial response at the same length.
  • An independent check for this step is EMA(t) = 110 − 10 × 0.8^t and DEMA(t) = 110 + 10 × 0.8^t × (0.2t − 1). The formulas include bar 0 and reproduce the table before rounding.
  • Initialization matters. This page explicitly seeds both states at 100. A first-observation seed and an SMA seed can disagree near the beginning of a dataset. Match the loaded history and allow warm-up before comparing chart values. A fixed warm-up count is not a universal error bound.
  • At N = 1, alpha = 1 and both outputs equal the source. The response advantage disappears. The synthetic experiments have no missing observations; do not assume another platform handles missing source values identically.

Reversal: the peak and its confirmation are different bars

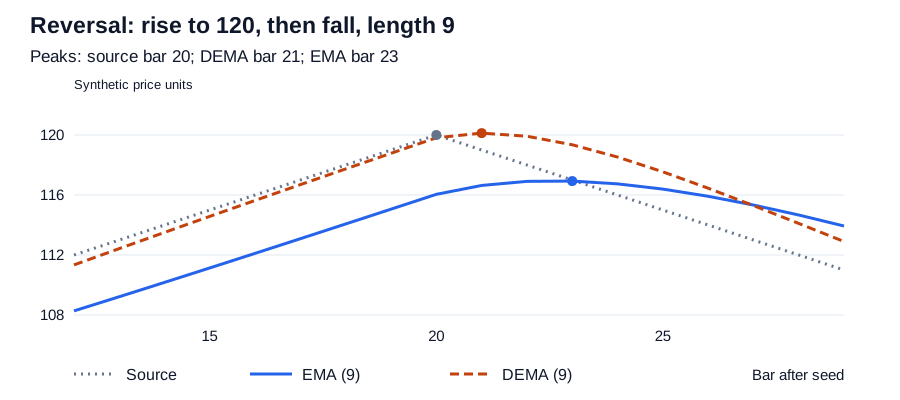
Reset both states to 100. Let x(t) = 100 + t for bars 1 through 20, then x(t) = 140 − t for bars 21 through 40; hold 100 afterward. Price peaks at bar 20. DEMA peaks at bar 21 and EMA at bar 23. Their peak offsets are therefore 1 and 3 bars. The chart shows the same data and length; it does not shift either line backward.

Synthetic reversal with source peak at bar 20, DEMA peak at bar 21 and EMA peak at bar 23; DEMA slightly exceeds the source peak of 120.
Markers locate peaks after calculation. A first-downward-slope rule detects each peak one bar later; the Pine script marks the detection bar. View original source
  • The tested rule is current average < previous average, with the previous slope nonnegative. At bar 21, DEMA is still rising despite the first falling close. It confirms a downward turn only at bar 22.
  • DEMA also rises above the highest source value: 120.125047 versus 120. An earlier turn and an overshooting peak can occur in the same experiment.
  • A different reversal speed, length or entry condition changes these offsets. This two-bar difference cannot be transferred to every market or timeframe.
MeasurementSourceEMA (9)DEMA (9)
Peak bar202321
Peak value120.000000116.927612120.125047
First declining completed bar212422
Delay from first source decline0 bars3 bars1 bar

Noise counterexample: a faster line can trigger an extra threshold

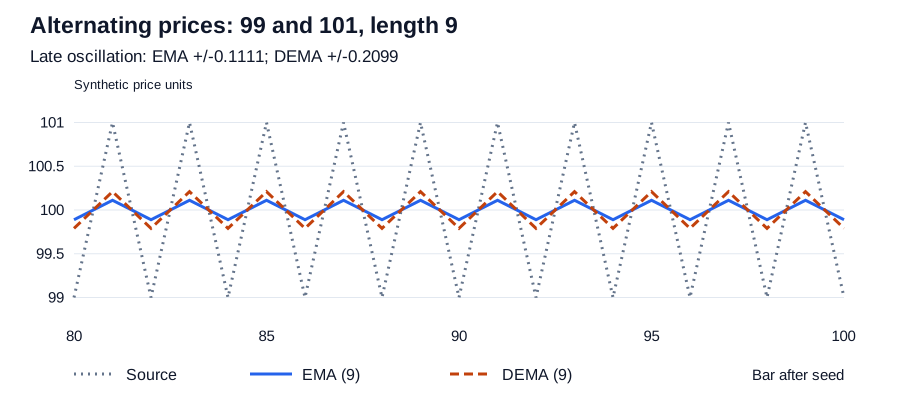
Reset again to 100, then alternate 101 on odd bars and 99 on even bars. There is no continuing trend. After 80 alternating observations, EMA is approximately 100 ± 0.111111 and DEMA is approximately 100 ± 0.209877. DEMA retains about 1.889 times the oscillation amplitude. This deterministic alternation is a counterexample to better smoothing at equal length, not a model of all market noise.

Bars 80 through 100 of alternating 99 and 101 prices: DEMA oscillates around 100 with larger amplitude than EMA.
The same seed and length are retained. Late bars show the response after the initialization transient has nearly decayed. View original source
  • For an alternating ±1 input at steady state, EMA gain is alpha / (2 − alpha) = 1/N. DEMA gain is 2/N − 1/N². With N = 9 these are 1/9 and 17/81. Their ratio is 17/9, approximately 1.889.
  • Suppose a test declares an upward move whenever the average exceeds a fixed 100.15 threshold. On bars 81 through 100, DEMA passes it on all 10 odd bars and falls below it on the next even bar. EMA never passes it. Under this explicit persistence criterion, DEMA creates 10 failed upward excursions.
  • A different rule gives a different result: close switches sides relative to both averages on every bar of that interval. Both have 19 side changes between bars 81 and 100. More line oscillation does not always mean more trades.
  • The threshold is chosen to expose a failure mode on a known synthetic baseline. It is not a recommended market level or a profitable strategy.

Choose the average by a rule you can measure

Use EMA as a candidate when suppressing short alternating movements matters more than reacting to a turn. Use DEMA as a candidate when an earlier change in slope is useful and you can explicitly handle overshoot and failed excursions. Neither choice is established by a smooth-looking chart or a same-length label.

  • First hold symbol, source, timeframe, session, length, history, zero plot offset and bar-close confirmation fixed. Change only the average formula.
  • Define equality handling, minimum movement and persistence before counting signals. Record the delay distribution and failed events, not just the most attractive turn.
  • If you add a persistence filter or increase DEMA length to reduce false signals, measure the delay again. The extra confirmation can consume the earlier response.
  • For strategy evaluation, keep entry and exit rules, position sizing, commission, slippage and fill timing consistent. Select parameters on one period and evaluate on untouched data. These response experiments alone support no profitability claim.
Your rule needsCandidate to testAcceptance test
A stable directional baselineEMAMeasure slope flips and late responses on reserved trend and range periods.
An earlier completed-bar slope reversalDEMARecord detection time plus reversals that fail your persistence rule; include overshoot cases.
A price-cross entryCompare both signal seriesCount actual timestamp differences. The step example gives the same initial cross.
Similar noise suppression with less delayTune length in a separate experimentMatch a stated noise or turnover measure first, then compare delay on held-out data.

Reproduce the comparison on the same confirmed bars

Paste this Pine Script v6 indicator into TradingView. Keep length 9 and select Step, Reversal or Noise to reproduce the CSV. The first 10 × length chart bars are constant 100; experiment bar 0 is the last initialization bar. The Data Window exposes experiment-bar numbers and E2. With length 9, at least 191 completed chart bars cover experiment bars 0 through 100. The script plots completed bars and marks the first declining slope at its detection time. Synthetic data uses the chart only as a bar clock.

  • Chart close mode uses the first available close as the initial E1 and E2. It waits 10 × length bars before displaying results, but you must still check sensitivity to loaded history and missing values. It does not reproduce a deliberately different SMA-seeded implementation.
  • Both averages are evaluated on every bar. The confirmed-bar gate controls displayed outputs and signals; it does not update only one average or omit intervening observations.
  • In Reversal mode, D appears at experiment bar 22 and E at bar 24 for length 9. No negative plot offset, future pivot data or higher-timeframe request is used. An alert condition is not an automatic order.
  • For a custom comparison, give the Pine Script AI Coding Agent the shared source, length, seed convention and signal definition. Ask it to draft the code and explicitly request a syntax check. Then compare the returned values and event timestamps with this experiment before testing trades.
Explicit first-observation seeds and shared EMA stages. This indicator has no orders or backtest. Change only Data to compare the same chart closes after the stated warm-up.pine
//@version=6
indicator("DEMA vs EMA: matched inputs", overlay = false)
length = input.int(9, "Shared length", minval = 1, maxval = 500)
mode = input.string("Step", "Data", options = ["Step", "Reversal", "Noise", "Chart close"])
warmup = 10 * length
t = bar_index - warmup
float sample = close
if mode != "Chart close"
    sample := 100.0
    if t > 0
        if mode == "Step"
            sample := 110.0
        else if mode == "Reversal"
            sample := t <= 20 ? 100.0 + t : math.max(100.0, 140.0 - t)
        else
            sample := t % 2 == 1 ? 101.0 : 99.0
alpha = 2.0 / (length + 1)
var float e1 = na
var float e2 = na
e1 := na(e1[1]) ? sample : alpha * sample + (1.0 - alpha) * e1[1]
e2 := na(e2[1]) ? e1 : alpha * e1 + (1.0 - alpha) * e2[1]
dema = 2.0 * e1 - e2
ready = t >= 0 and (mode == "Chart close" or t <= 100)
confirmed = ready and barstate.isconfirmed
emaDown = e1 < e1[1] and e1[1] >= e1[2]
demaDown = dema < dema[1] and dema[1] >= dema[2]
plot(confirmed ? sample : na, "Source", color.gray)
plot(confirmed ? e1 : na, "EMA", color.blue, 2)
plot(confirmed ? dema : na, "DEMA", color.orange, 2)
plot(ready ? t : na, "Experiment bar", display = display.data_window)
plot(confirmed ? e2 : na, "EMA of EMA", display = display.data_window)
plotshape(confirmed and emaDown, "EMA first down slope", shape.triangledown, location.top, color.blue, text = "E")
plotshape(confirmed and demaDown, "DEMA first down slope", shape.triangledown, location.bottom, color.orange, text = "D")
alertcondition(confirmed and emaDown, "EMA down turn", "EMA first down slope on a closed bar")
alertcondition(confirmed and demaDown, "DEMA down turn", "DEMA first down slope on a closed bar")
Where Pineify fits

Pine Script AI Coding Agent

Draft a comparison from your EMA and DEMA rules, request a syntax check, and inspect the resulting formulas and confirmed-bar signals.

Draft a matched comparison

Frequently asked questions

Educational comparison, not investment advice. Synthetic prices illustrate calculations and do not represent market performance. Syntax validation does not establish profitable behavior or correct trade execution.

Sources and verification

Published by Pineify. Pineify is an independent product and is not affiliated with TradingView. Sources support the technical explanations; examples do not establish trading performance.