TradingView chart patterns

Wolfe wave pattern: five points, a target line and a timing problem

A Wolfe wave pattern uses five alternating turning points, converging 1-3 and 2-4 boundaries, and a projected 1-4 target line. It studies a possible reversal around point 5. A useful chart must also show when each pivot became knowable and what would invalidate the candidate. A target drawn on a chart is not evidence that price will reach it.

See the decision guide

Published structure and the limits of its projection

Bill and Brian Wolfe describe the bullish sequence as a low at 1, a high at 2, a lower low at 3, a rebound high at 4 and a low at 5 that can exceed the 1-3 line. The bearish sequence reverses the highs and lows. Their rules require 1-3 and 2-4 to converge.

  • In their terminology, the boundary intersection gives Estimated Time of Arrival (ETA). The 1-4 line evaluated at that time gives Estimated Price at Arrival (EPA). Their practical discussion says they do not count on ETA.
  • The W-1 example below adds numerical filters, pivot confirmation and expiry for reproducible review. These are teaching choices, not a claim to reproduce every part of the discretionary method in the source.
  • An ordinary wedge breakout can be described with two boundaries. W-1 also requires a particular five-point order and a separate 1-4 projection; a wedge label alone does not satisfy these tests.
Reconstruct one hypothetical bullish candidate

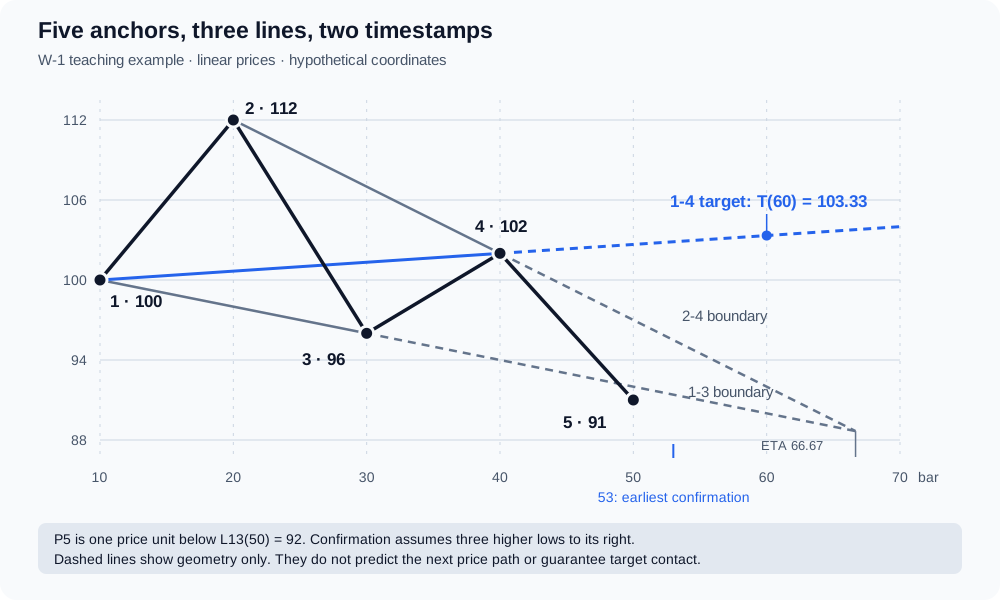
Use linear prices, bar indices and wick extremes on one fixed timeframe. W-1 selects alternating lows and highs at the coordinates below. Its custom filters require P3 < P1 < P4 < P2, a future intersection, and point 5 between zero and two price units below the projected 1-3 boundary. Zero overshoot is excluded. These thresholds are illustrative, not optimized.

Hypothetical Wolfe wave points 1 through 5 with converging boundaries, a rising 1-4 target and separate pivot and confirmation timestamps.
Original W-1 coordinate diagram. Dashed extensions are geometric projections, not a forecast price path. No candles after point 5 are claimed as observed market data. View original source
  • Assume points 1 through 4 already pass the same pivot test. W-1 requires three completed bars on each side of a low to have strictly higher lows; reverse the test for highs and reject ties.
  • Keep the ten-bar spacing in this example separate from a general rule. A detector specification still needs minimum spacing, maximum duration and a policy for overlapping candidates.
PointBar tPriceW-1 role
110100First selected low
220112Selected high
33096Lower selected low
440102Selected high between prices 1 and 2
55091Provisional low, one unit below L13(50) = 92

Calculate the boundary intersection and the moving target

For anchors (ta, Pa) and (tb, Pb), the linear equation is L(t) = Pa + (Pb - Pa) × (t - ta) / (tb - ta). Distinct anchor bars are required. With the saved coordinates, L13(t) = 102 - 0.2t, L24(t) = 122 - 0.5t and T14(t) = 100 + (t - 10) / 15.

  • The boundary intersection and target are different prices at the same projected time. Confusing 88.6667 with 103.7778 reverses the intended interpretation of this bullish example.
  • Evaluate target contact against T14 on the actual bar being reviewed. A fixed price of 102.8667 copied from bar 53 no longer represents the line at bar 60.
  • Bar 66.6667 is an intersection between integer bar positions, not an executable timestamp. Session gaps and weekends also prevent a bar count from being treated as uninterrupted clock time.
  • These equations use linear price coordinates. A straight line drawn on a logarithmic scale needs a corresponding log-price calculation; do not mix its visual slope with these formulas.
QuantityCalculationMeaning in this example
Boundary intersection102 - 0.2t = 122 - 0.5t; t = 66.6667Geometric ETA, measured in bars
Intersection priceL13(66.6667) = 88.6667Where the wedge boundaries meet, not the target price
Target at bar 53100 + 43 / 15 = 102.8667Target after the assumed confirmation delay
Target at bar 60100 + 50 / 15 = 103.3333Later line value, not a fixed take-profit price
Target at geometric ETA100 + 56.6667 / 15 = 103.7778EPA under this coordinate model

Wait for confirmation and preserve the failed alternatives

At bar 50, future lows are unknown. If bars 51, 52 and 53 all finish with lows strictly above 91, the assumed pivot test confirms point 5 only when bar 53 closes. TradingView repainting documentation explains why placing a pivot label back in history can conceal this delay. An alert or simulated entry must use the confirmation time.

  • For a complete W-1 observation rule, require a close above L13 on or after confirmation, no low below the saved P5, and a bar index no later than 64. Invalidation takes precedence over the close test. Expiry at 64 is a chosen cutoff before the geometric intersection.
  • If bar 53 has low 92.5 and close 94, with the preceding pivot conditions satisfied, then 94 > L13(53) = 91.4: the observation rule passes at that close. This does not assume an executable fill at 94 or at the earlier low of 91.
Alternative to the exampleW-1 resultReason
Change point 4 to price 108 at bar 40Reject geometryL24 = 116 - 0.2t is parallel to L13; no finite intersection
Change point 5 to 89 at bar 50Reject overshoot filterL13(50) - P5 = 3, above the chosen two-unit allowance
Bar 52 makes a low of 90.8Reject the bar-50 pivotA required right-side low is below 91
After confirmation, bar 54 makes a low of 90.8Invalidate the saved candidateThe saved point-5 floor has broken under W-1
No qualifying close through bar 64Expire at the close of bar 64A bar-65 recovery is outside the chosen window

Mirror the arithmetic for a bearish Wolfe wave pattern

For an original bearish test case, reflect every example price with P′ = 200 - P while keeping the bars unchanged. The five prices become 100, 88, 104, 98 and 109. The reflected boundaries are 98 + 0.2t and 78 + 0.5t; they still intersect at bar 66.6667. The reflected target is 100 - (t - 10) / 15, giving 96.6667 at bar 60.

  • Mirror the entire W-1 rule: three lower highs on each side confirm point 5; a later qualifying close lies below the reflected 1-3 line; a high above the saved 109 invalidates it.
  • Changing only the target direction while leaving the bullish pivot or invalidation tests unchanged produces a different, inconsistent detector. Verify the mirrored example independently.
  • Neither numerical case measures a win rate. A trading test also needs order timing, costs, position sizing, stop behavior and an exit rule, including what happens when both stop and target lie inside one bar.

Mark the chart, then ask for a reviewable implementation

On a TradingView chart, label the selected pivots 1 through 5 and draw separate lines through 1-3, 2-4 and 1-4. Save the symbol, timeframe, session, price scale and anchor coordinates with the screenshot. Check the line values numerically before interpreting the drawing.

  • Upload the annotated screenshot to AI Chart Analysis for a visual review. Verify its suggested points against the saved coordinates; a screenshot cannot supply hidden history or prove that a pivot was known at the time.
  • For a Pine Script AI Coding Agent request, attach the chosen pivot test, tolerance, overlap policy, confirmation timestamp, expiry and invalidation precedence. Ask the draft to expose rejection reasons and both pivot and confirmation bars.
  • Review generated code and request syntax validation before chart testing. Replay candidates bar by bar and retain rejected and invalidated cases. This page supplies the specification example, not a working Wolfe scanner.
Where Pineify fits

AI Chart Analysis

Upload a chart screenshot labeled with its symbol, timeframe and five candidate pivots for a visual review. Check the returned interpretation against your saved coordinates and rules.

Also useful: Pine Script AI Coding Agent. Turn an explicit point-selection and confirmation specification into a Pine Script draft for inspection and testing. Generated logic still requires review and validation.

Review an annotated chart

Frequently asked questions

Educational information, not investment advice. W-1 prices, filters and event paths are hypothetical. No live detection, backtest, win rate or expected return is presented. A projected line does not guarantee a reversal, target contact or profit.

Sources and verification

Published by Pineify. Pineify is an independent product and is not affiliated with TradingView. Sources support the technical explanations; examples do not establish trading performance.