

Follow the slope change across the crest
The illustration uses invented prices on an arithmetic scale. A prior rise from 85 to 100 precedes the arc. Over equal ten-bar intervals, the sampled closes change by +16, +4, -4 and -15.2. Those increments show the transition from a fast rise to a flat crest and then a steeper decline. They are checkpoints for reviewing the full candles, not enough data to reconstruct every swing.
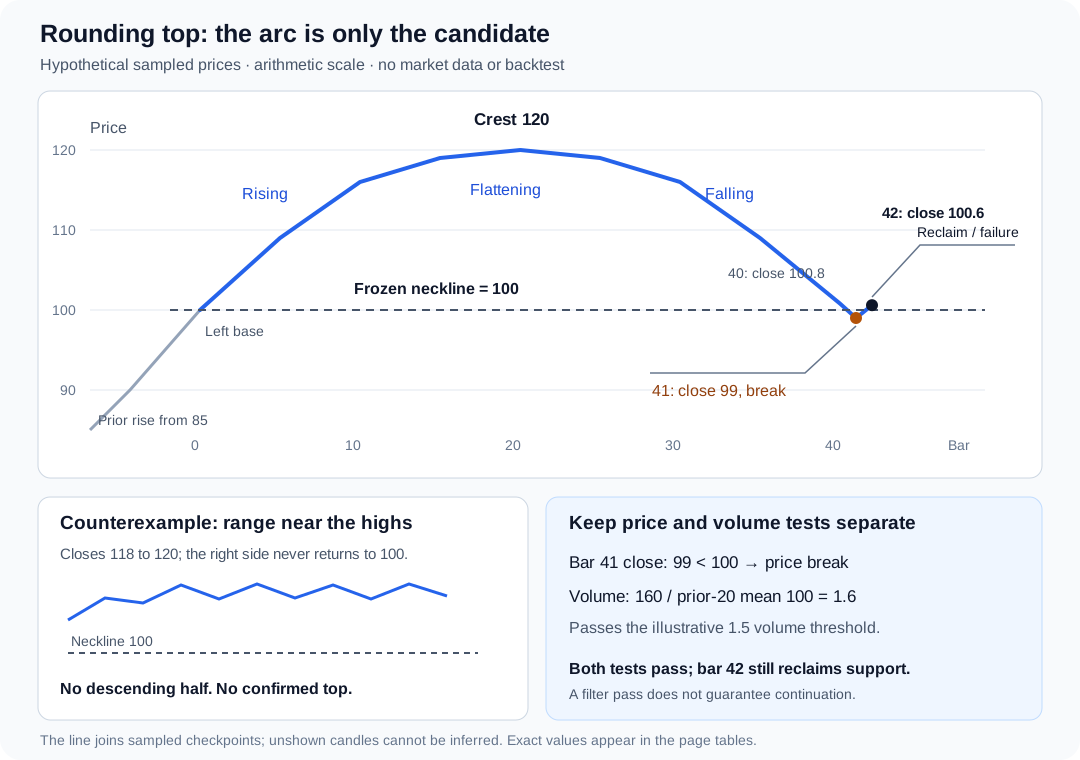
| Checkpoint | Hypothetical close | Observation |
|---|---|---|
| Bar 0 | 100 | Start of arc at previously selected support |
| Bar 10 | 116 | Advance remains steep |
| Bar 20 | 120 | Broad crest, with nearby samples at 119 |
| Bar 30 | 116 | Right side has turned down |
| Bar 40 | 100.8 | Near support, but no close below 100 |