Quasimodo pattern: structure break, then shoulder retest
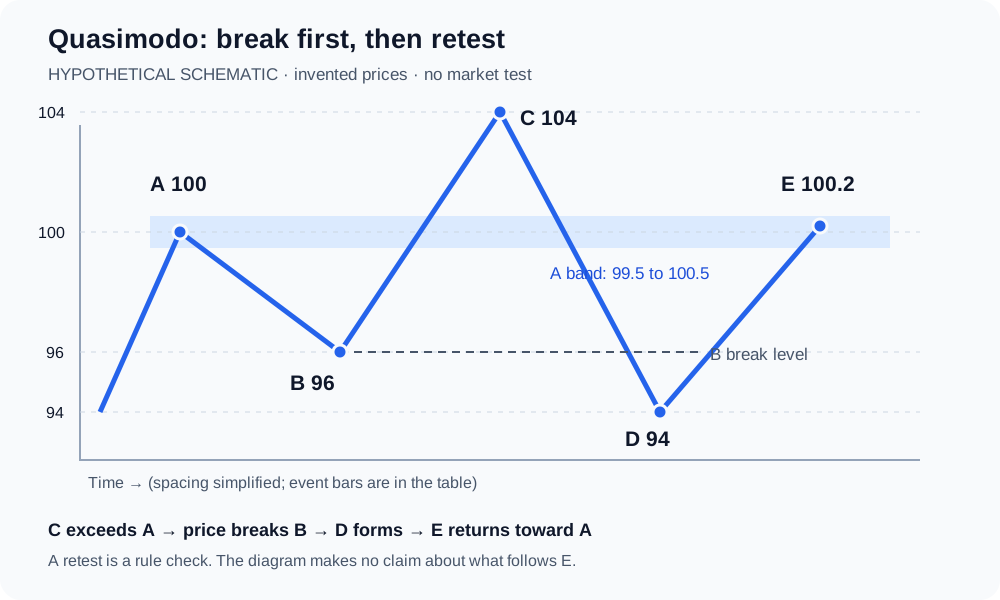
A bearish Quasimodo pattern is a reversal candidate in which price makes a higher high, breaks the intervening swing low, then returns toward the earlier high. The bullish version reverses those directions. The order matters: a shoulder retest must follow the structure break. A recognizable shape alone does not establish a trade or a reliable prediction.
This page uses the five-point reversal sequence described in FBS education: A is the left shoulder, B the intervening swing, C the new trend extreme, D the opposite extreme beyond B, and E the return toward A. QML means the A price here. Terminology varies between authors and scripts, so compare their actual levels and event order rather than the label alone.
The A-B-C rise supplies the HH/HL context; the move through B disrupts it. A range with a random broken low is insufficient for this version.
D is a swing location. The first close through B can happen before D becomes a confirmed pivot.
E is the retest location. Whether it needs a confirmed pivot, a rejection candle or only a touch is a separate rule. The worked example uses a completed retest candle.
Point
Bearish version after a rise
Bullish version after a decline
A
Earlier swing high
Earlier swing low
B
Pullback low above the preceding trend low
Pullback high below the preceding trend high
C
Higher high above A
Lower low below A
D
Lower low below B after the break
Higher high above B after the break
E
Return near A while remaining below C
Return near A while remaining above C
Read an original five-point example
These are invented prices in arbitrary units, not a market chart or a backtest. Assume a preceding high of 98 and low of 94, followed by A = 100, B = 96, C = 104 and D = 94. Thus A exceeds the earlier high, B remains above the earlier low, C exceeds A, and D falls below B. E later reaches 100.2 near A. No price path after E is implied.
Original schematic. Invented prices, simplified connecting lines and no measured market performance. The table below supplies the event timing. View original source
The broken structure level is B = 96; the retest zone is centered on A = 100. They are different prices.
Set the retest tolerance to 0.5% of A for this example: 100 × 0.005 = 0.5. The allowed band is 99.5 to 100.5, inclusive.
E differs from A by 0.2, or 0.2% of A. It passes the selected tolerance and remains below C = 104.
Attach times to the break and retest
For this manual audit, assume A-D are alternating pivots with two strictly lower highs or higher lows on each side; ties fail. Freeze these selected anchors once D is confirmed. Intermediate candles are assumed to satisfy that rule. Use standard price candles, one symbol, one timeframe and one session. The thresholds below are study choices, not TradingView defaults.
Assume bars 43 and 44 stay below 99.5. Accept only the first bar whose high lies inside the band; require that same bar to close below 99.5. A first visit that closes inside the band is logged as a retest without confirmation and consumes this candidate.
A high above 100.5 before a qualifying visit rejects this narrow retest specification, even if it stays below C. A wick or high at or above C invalidates the bearish candidate; check invalidation before accepting a retest on the same bar.
A retest before D is confirmed is excluded by this chosen timing rule. Do not backdate eligibility to capture it. This restriction can miss patterns that a faster rule accepts.
TradingView documents that a pivot drawn on an earlier candle can be discovered only after later candles. Save both the pivot location and the first bar on which its information was available.
Time
Observed information
Audit state
Bars 10, 20 and 30
A = 100, B = 96, C = 104; each becomes known two bars later
A-B-C sequence available at the close of bar 32
Bar 35 closes
Previous close 96.2; current close 95.5, below B = 96
First close-based structure break; no retest yet
Bar 40, known at close of 42
D = 94 is below B = 96
Freeze A-D; begin retest window on bar 43
Bar 45 closes
High 100.2 is inside 99.5 to 100.5; close 99.4 is below 99.5
E retest and rejection meet this example rule
After bar 52
No eligible E occurred in bars 43 through 52 in an alternative path
Expire that candidate without moving its anchors
Quasimodo versus head and shoulders
Both drawings can contain three peaks with a higher middle peak. The operational difference is the confirmation sequence. TradingView describes a head and shoulders pattern as formed when the close falls beneath the neckline after the right shoulder. Under the Quasimodo version used here, the break through B already occurred before E returned toward the left shoulder.
Some charts can satisfy both sets of rules at different times. Their labels need not be mutually exclusive.
A sloping neckline alone does not distinguish them. Compare what was known at the proposed signal bar.
Question
This Quasimodo specification
Head and shoulders comparison
Which line matters first?
The saved swing level B
A neckline through the two intervening lows
When is the break required?
Before the shoulder retest E
After the right shoulder for neckline confirmation
What is the retest area?
A band around A
A later neckline retest may be studied separately
Is every structure break enough?
No; A-B-C-D-E order and tolerance must also hold
No; the shoulder and head geometry must also hold
Record rejections separately from failures
A candidate that never reaches E is incomplete, while an accepted setup can fail afterward. For this hypothetical study, a high at or above the saved C ends the bearish hypothesis even after E. This is a structural failure label, not an executable stop order or a promise of a fill at C.
Do not infer a win rate from a diagram. A strategy test still needs entries, exits, position sizing, fees, spreads, slippage and gap handling.
If several nested swings fit, choose the swing scale before reviewing outcomes. Switching from hourly A-B-C to five-minute D-E creates a different specification.
This page does not infer institutional orders, stop locations or trader intent from the shape. Those explanations require evidence beyond the displayed price sequence.
Alternative observation
Result under the stated rules
Low dips below 96, but the close stays above 96
No close-based break; wait rather than labeling D-E as confirmed
Price breaks B and never returns to the A band
No completed retest setup; expire at the stated deadline
First visit high is 100.2 and close is 100.0
Retest without the required rejection; consume and log the candidate
Price reaches 104.1 before E
Invalidated before completion; no bearish signal
After an accepted E, price later reaches 104.1
Confirmed setup failed under this audit rule; preserve the original event
Review the screenshot, then write the detector specification
For AI Chart Analysis, upload a readable chart screenshot with the symbol, timeframe, session and dates visible. Mark A-E and the prices at A, B and C. Review its output for point order, whether B broke before E, and any prices that cannot be read confidently. Verify the response against the underlying candles; a screenshot cannot reveal the full intrabar order.
For Pine Script AI Coding Agent, provide the pivot selection rule, bullish or bearish direction, A-based tolerance, close-based break, D confirmation delay, retest window and invalidation priority.
Request separate markers for candidate creation, structure break, retest, rejection, expiry and failure. Require event timestamps to show when the condition became known.
Review and syntax-check the generated draft, then inspect it bar by bar on TradingView. This page supplies a specification, not a tested detector or a measured recognition accuracy.
Where Pineify fits
AI Chart Analysis
Upload a labeled screenshot to review the candidate structure. Compare the response with A-E prices and the event log; visual analysis can miss or misread points.
Also useful: Pine Script AI Coding Agent. Turn the chosen swing, tolerance and confirmation rules into a Pine Script draft for review and testing.
QML means the left-shoulder level A here. The broken structure level is B. Authors and indicators may use the name differently, so identify the actual anchor before comparing signals.
The shapes can overlap, but the event rules differ. Here the break through B precedes the E retest. Head and shoulders confirmation uses a neckline break after the right shoulder. Check the timing instead of classifying by silhouette alone.
No. Price may continue without returning, overshoot the chosen band or invalidate the setup. Under the example rules, a missing retest expires after the fixed window; it must not be added later using hindsight.
This page establishes no success rate. Results depend on the exact swing, entry, exit, cost and sample definitions. The numbers here demonstrate rule checks using invented prices and contain no historical or live performance evidence.
Educational information, not investment advice. All example prices, tolerances and bar numbers are hypothetical. The schematic is not a market observation or backtest. Recognition and confirmation do not guarantee a reversal or a profitable trade.
Published by Pineify. Pineify is an independent product and is not affiliated with TradingView. Sources support the technical explanations; examples do not establish trading performance.