TradingView chart patterns

Cypher pattern: measure D against XC

A Cypher pattern is a five-point XABCD structure used to mark a possible reversal area. Its defining measurement is the D retracement: 78.6% of XC, measured from C toward X. Using XA instead moves the completion price. Matching the ratios identifies a candidate; it does not establish that price has reversed.

See the decision guide

Choose a ratio convention before selecting points

TradingView's current Cypher drawing-tool guide specifies B at 0.382 to 0.618 of XA, C at 1.13 to 1.414 of XA, and D at 0.786 of XC. This page uses that convention. A detector configured with a 1.272 minimum for C applies a narrower filter; record that choice rather than silently treating the two ranges as identical.

  • Points must occur in time order X, A, B, C, D. For the bullish example, X is a low, A a high, B a retracement above X, C a new high above A, and D a pullback between X and B. Reverse these directions for a bearish candidate.
  • Use price differences, not diagonal line lengths. Keep one price convention, such as high and low wicks, for every pivot. Reject zero-length XA or XC.
  • Ratios alone do not check direction. Absolute distances can look correct even when the anchors are in the wrong order.
PointAbsolute price-distance ratioReference level
B|A - B| / |A - X|0.382 to 0.618
C|C - X| / |A - X|1.13 to 1.414
D|C - D| / |C - X|0.786

Recalculate a bullish candidate and its bearish mirror

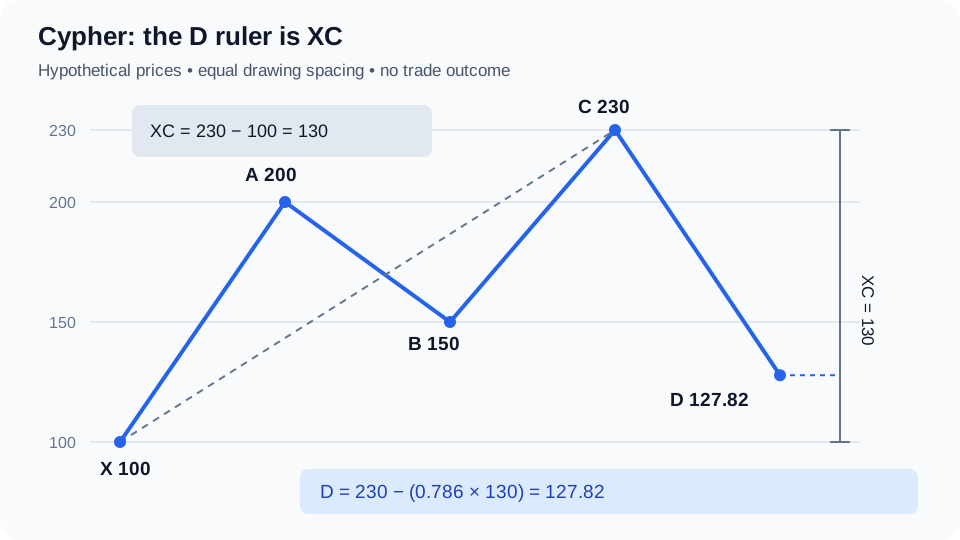
The original diagram uses hypothetical prices and equal drawing spacing, not market observations. For X = 100, A = 200, B = 150 and C = 230, the projected D price is 230 - 0.786 × 130 = 127.82. The signed formula D = C - 0.786 × (C - X) also works when C is below X.

Hypothetical bullish Cypher: X 100, A 200, B 150, C 230, D 127.82. D retraces 78.6 percent of the 130-unit XC range.
Original arithmetic illustration. The dashed XC ruler spans 130 price units; D is 102.18 units below C. No future reversal or trade outcome is shown. View original source
  • The bearish cypher pattern mirrors each bullish price around 200: new price = 400 - original price. Its D is a rebound from C toward X, where a downward reversal would still need separate confirmation.
  • These calculations verify geometry only. They contain no OHLC history, transaction costs, entry fills or performance result.
CheckBullish illustrationBearish mirror
X, A, B, C, D100, 200, 150, 230, 127.82300, 200, 250, 170, 272.18
AB / XA50 / 100 = 0.50050 / 100 = 0.500
XC / XA130 / 100 = 1.300130 / 100 = 1.300
CD / XC102.18 / 130 = 0.786102.18 / 130 = 0.786

Reject the wrong D anchor before judging the shape

Keep X = 100, A = 200 and C = 230 fixed. The correct D is 127.82. Each alternative below applies the same 0.786 number to a different measurement, so a familiar Fibonacci label can hide a material price error.

  • The C extension uses XC / XA. Substituting BC / AB changes both numerator and denominator; it is not another way to calculate the same ratio.
  • Do not relocate X or C after seeing the outcome to make D land on a preferred candle. Freeze the anchors and log a new candidate if your selection rule later chooses different pivots.
CalculationPriceWhat went wrong
A - 0.786 × (A - X)121.40Uses XA and starts from A
C - 0.786 × (A - X)151.40Starts from C but still uses XA
X + 0.786 × (C - X)202.18Measures from X toward C instead of retracing from C
C - 0.786 × (C - X)127.82Correct XC retracement from C

Write tolerance as a numerical acceptance test

For a teaching specification named CY-1, use the reference B and C intervals inclusively and allow an absolute D-ratio error of 0.010: |CD / XC - 0.786| ≤ 0.010. This is a custom allowance of one percentage point of XC, not a 1% relative error or a recommendation. Evaluate unrounded prices before displaying rounded ratios.

  • With XC = 130, the allowed D price band is 126.52 to 129.12. Its half-width is 130 × 0.010 = 1.30 price units.
  • Decide how tick rounding affects acceptance before testing. A displayed 0.786 can conceal an unrounded value outside a narrower allowance.
  • A wick-based specification rejects a C wick beyond its upper extension limit. A close-based exception is a different rule and must be named; do not switch between them to rescue a candidate.
Hypothetical caseCalculationCY-1 decision
Original pointsD ratio = 0.786Pass the ratio tests
Change D to 129.12(230 - 129.12) / 130 = 0.776Pass at the inclusive boundary
Change D to 130.00(230 - 130) / 130 = 0.769231Reject: outside the D band
Change B to 135.00(200 - 135) / 100 = 0.650Reject: B retracement too large
Change C to 220 and D to 125.68XC / XA = 1.200; CD / XC = 0.786Pass CY-1; fail a separate C minimum of 1.272

Separate a touch, a confirmed pivot and a failed setup

CY-1 is an arithmetic example, not a finished trading strategy. For an optional timing exercise, define a low pivot as a bar with three strictly higher lows on each side, using completed bars and rejecting ties. Mirror the rule for highs. Assume XABC were already confirmed and frozen before the D touch.

  • An annotation at bar 50 must disclose that D became known at bar 53. Backdating the annotation does not permit an alert or simulated entry at the earlier price.
  • For this timing exercise, cancel first if a completed bar after bar 50 has a low below the saved D, then check confirmation or the optional entry filter. If a bar both breaks D and closes above its high, cancellation wins. For bearish setups, use a high above D and a close below the saved D-candle low.
  • After confirmation, allow the optional entry filter only on bars 53 through 62 inclusive; otherwise expire the candidate. These cancellation and expiry rules belong to the exercise, not a universal Cypher standard.
  • A move through X invalidates the illustrated price ordering. A move through the saved D may cancel this stricter setup earlier. Neither threshold guarantees a stop order can fill at its trigger price.
  • Pattern rejection, setup cancellation and a losing executed trade are different records. A strategy still needs order timing, position sizing, costs and exits before its results can be evaluated.
EventAvailable evidenceStatus
Bar 50 touches 127.82The next three bars are unknownProjected area touched; D provisional
Bar 53 closes; bars 51 to 53 all have lows above 127.82The left-side test also passedD pivot confirmed at bar 53
Alternative: bar 52 makes a lower or equal lowThe strict bar-50 pivot test failsReject this D; evaluate any replacement separately
A later bar closes above the saved D-candle highOnly considered on or after pivot confirmationOptional bullish entry filter passed

Draw the anchors, then review the evidence

In TradingView, select the Cypher pattern drawing tool and place X through D in time order. Its Coordinates settings let you enter each anchor price and bar number. A manual drawing helps inspect a proposed structure; it does not prove an objective detector selected those points.

  • Save the symbol, timeframe, chart date, price convention and the five prices. Add your C interval and D tolerance to the notes so the drawing can be reconstructed.
  • For Pineify AI Chart Analysis, upload a clear screenshot with the symbol, timeframe and labeled anchors. Use the response to review visible structure, then check every price and ratio against the chart data. Screenshot interpretation can miss small price differences.
  • For a Coding Agent request, supply the exact ratio tests, pivot rules, candidate selection, timing and rejection policy. Request measured ratios and both pivot and confirmation timestamps as outputs. Review the generated Pine Script, validate its syntax, and test bar by bar before adding orders.
Where Pineify fits

AI Chart Analysis

Upload a labeled Cypher screenshot for a second review of visible structure. Recalculate the anchor prices yourself; image analysis does not establish exact ratio compliance or predict a reversal.

Also useful: Pine Script AI Coding Agent. Turn your written Cypher rules into a script draft, then inspect the calculations, confirmation timing and syntax. No automatic recognition accuracy is promised.

Review a labeled chart

Frequently asked questions

Educational information, not investment advice. Prices, CY-1 thresholds and event paths are hypothetical. No backtest, win rate or expected return is presented. Pattern completion does not guarantee reversal or profit.

Sources and verification

Published by Pineify. Pineify is an independent product and is not affiliated with TradingView. Sources support the technical explanations; examples do not establish trading performance.